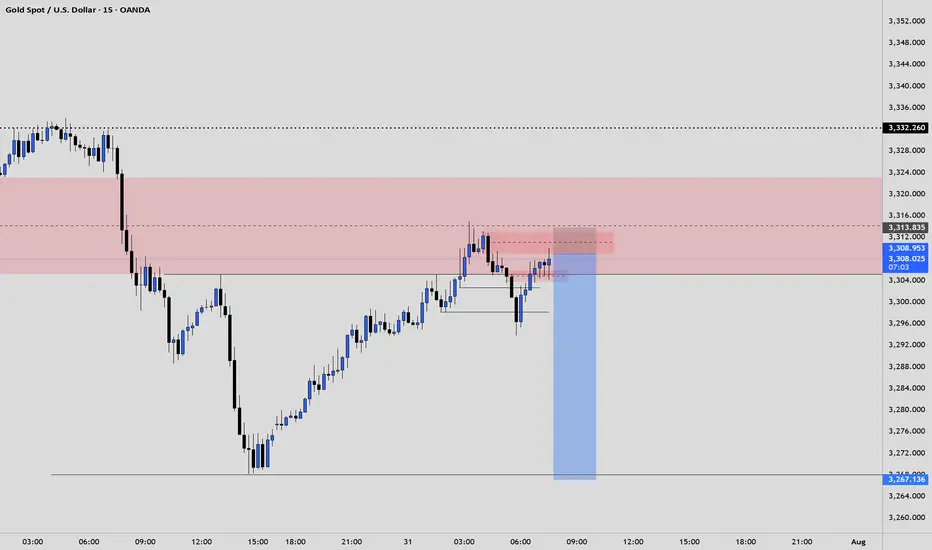
gold on buy retrace#XAUUSD price have reformed back above 3306, now we are expecting bullish from 3309 on 2 times breakout.
Entry 3309 2 times breakout, target 3326-3335, SL 3297.
Below 3297 holds bearish reversal, target 3270. 3317 will reject, H1 closure there will continue bullish.
GOLDCFD trade ideas

XAUUSD: UptrendOn XAUUSD as you can see on the chart we would have a good uptrend. After the vwap indicator breaks, you can double your buy position.

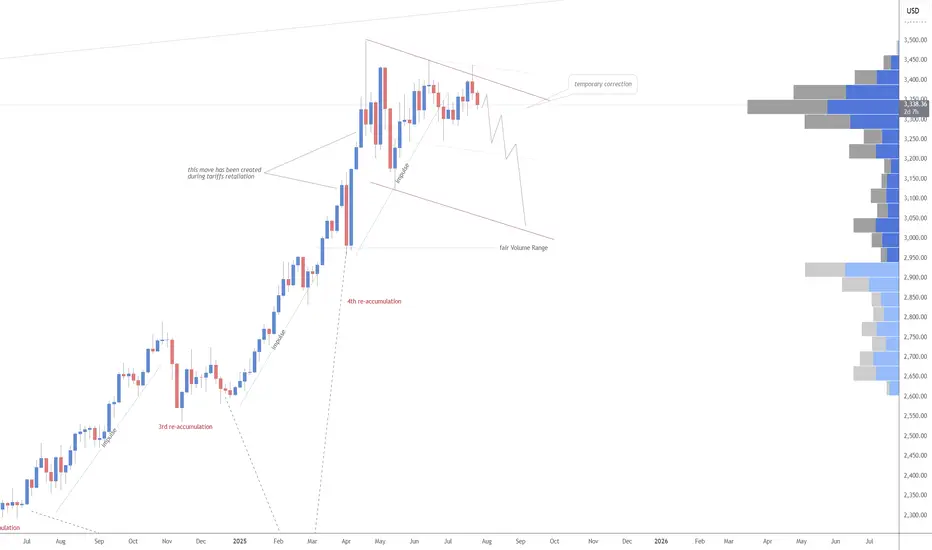
Gold analysis by majidbabaeiasl My predictions for gold in previous years have been quite accurate and calculated. Right now, I think a wave 4 correction, which is a micro-wave, is taking place.

Xausd techinical analysis.Xausd techinical analysis next move posibale at h2 time frame not finchinal advice.

GOLD H2 Intraday Chart Update For 29 July 2025Hello Traders, Welcome to new day
we have US JOLTS high impact news today, for market sustains above 3300 psychological level
if market successfully break 3280 level then it will move towards 3280 or even 3270
if market crosses 3330 level successfully then it will move towards 3345 or even 3360
All eyes on FOMC & NFP news for the week
Disclaimer: Forex is Risky

Gold Price Update – Bearish Flag Signals Possible Drop AheadGold is currently trading around $3,324, showing consolidation after a recent decline from the $3,345 region. The chart shows a bearish flag pattern forming after the sharp drop, indicating potential continuation of the downtrend. If gold fails to break above this region, sellers may push the price lower towards $3,301 and possibly $3,275.
The descending trend line adds further bearish pressure, limiting upside momentum unless gold decisively breaks and holds above $3,345. Overall, gold remains under short-term bearish sentiment, with the focus on support retests. Any bullish momentum will only be confirmed if the price closes above the flag and trendline resistance.
Key Points
Resistance Zones: $3,328 (0.618 Fib), $3,345 (flag top).
Support Zones: $3,301 (Fib base), $3,284, and $3,275 (bearish extension).
Trend Outlook: Short-term bearish unless price breaks above $3,345 with volume.
Bearish Targets: $3,301 → $3,284 → $3,275.
Bullish Invalidations: Break and close above $3,345 may shift bias to bullish.
Note
Please risk management in trading is a Key so use your money accordingly. If you like the idea then please like and boost. Thank you and Good Luck!

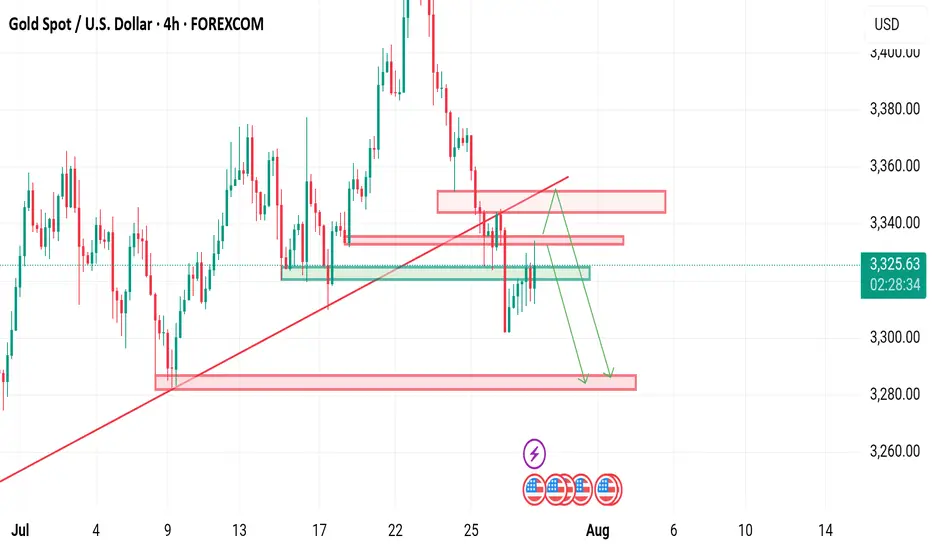
XAU/USD - Potential TargetsDear Friends in Trading,
How I see it,
Let me know if anything is unclear.
If Gold is attempting to achieve 4000, a proper correction is necessary.
Keynote:
The big red arrow/short below the range is what is supposed to happen,
but nobody will agree.
It's okay - I'm biased, I love to short!
I sincerely hope my point of view offers a valued insight
Thank you for taking the time study my analysis.

GOLD: In-depth Fundamental and Technical AnalysisGOLD: In-depth Fundamental and Technical Analysis
In this video analysis, I discussed in detail how gold can develop from a fundamental and technical perspective.
It remains a very risky and highly manipulated instrument.
You may watch the analysis for further details
Thank you!

GOLD - Price can make correction and then bounce upHi guys, this is my overview for XAUUSD, feel free to check it and write your feedback in comments👊
The price has been developing within a broadening wedge formation for some time.
This pattern began after the asset found strong support in the key zone around the $3305 level.
Within this structure, buyers recently pushed the price upwards in a notable impulse wave.
This impulse culminated in a test of the wedge's upper boundary and the resistance area near $3430.
After being rejected from that resistance, the price is now in a corrective decline towards the lower trendline.
I expect that this correction will find its footing on the lower boundary, leading to a rebound and a new rally towards the $3430 resistance.
If this post is useful to you, you can support me with like/boost and advice in comments❤️
Disclaimer: As part of ThinkMarkets’ Influencer Program, I am sponsored to share and publish their charts in my analysis.

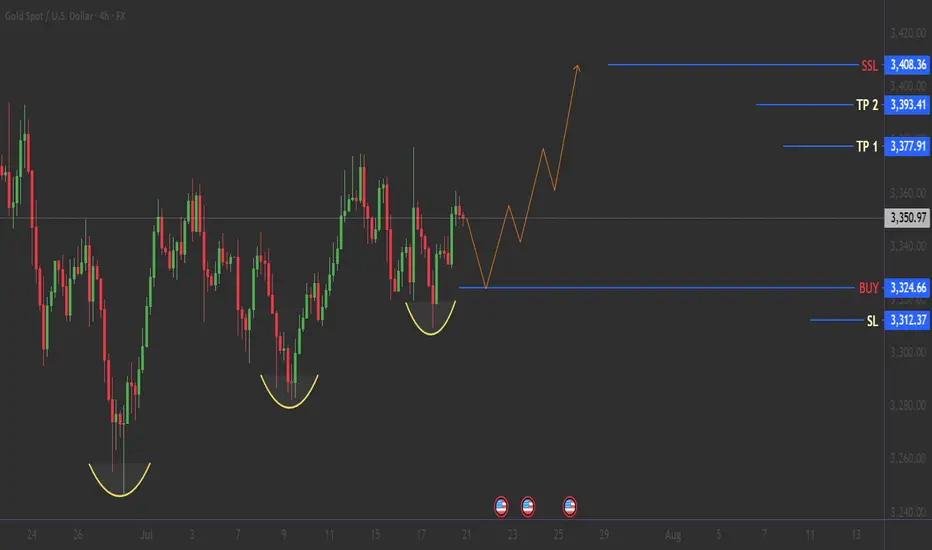
GOLD: Bullish Reversal Pattern Activated! 21/07/2025THE GOLDEN SETUP: Triple Bottom Masterpiece :
🟢 BULLISH BREAKOUT SETUP
🎯 BUY ZONE: $3,324 (Neckline Break)
🚀 TP1: $3,377
🚀 TP2: $3,393
🚀 LAST TP : $3,408
Stop Loss: $3,312 (Below recent low) 🚨
🌟 Before You Trade:
✅Wait for neckline break ($3,325+)🔥
✅Confirm with volume surge
✅Set stop loss below pattern ($3,312)
✅Calculate position size (max 2% risk)
--------------- N O T E ----------------
🚨 RISK MANAGEMENT 💡DYOR
Follow for more high-probability setups! 📊✨
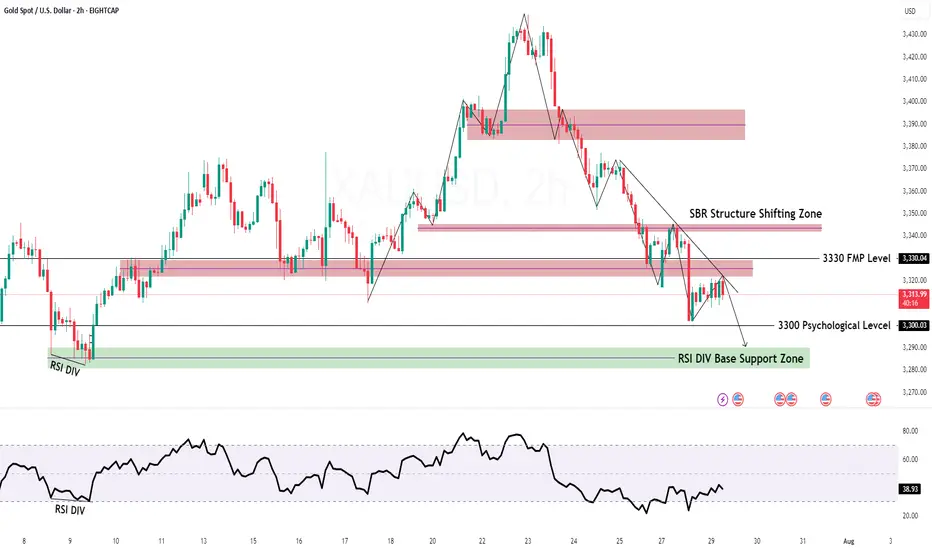
#XAUUSD H1 Setup – Smart Money Outlook📊 **#XAUUSD H1 Setup – Smart Money Outlook**
What we've been observing over the **last 3 sessions** is consistent **selling pressure** with **no meaningful pullback** yet — something that’s usually inevitable, even in strong downtrends.
🔁 A **retracement** is likely, and to identify key levels, we use the **Fibonacci Retracement Tool**.
---
### 🔍 **Market Sentiment Right Now**:
* Many traders are expecting a pullback into the **3348–3360 H1 Order Block**,
* Others are targeting **3368–3375** as a sell zone.
But here’s the twist:
⚠️ **Both these zones** could be potential **sell trap areas** (Fakeout Zone 1 & 2).
Why? Because **massive liquidity sits just above these levels**.
---
### 💡 **Smart Money Logic**:
Above the second fakeout zone lies an **inducement area** (liquidity pool).
And beyond that sits our **true institutional sell zone** at **3388–3393**, which aligns perfectly with the **Golden Fibo Zone (0.50–0.618)**.
📌 This is where we may see the **real bearish reaction**.
---
### 🟢 **Buy Setup Plan (Short-Term Opportunity)**:
If we get a **fully bullish H1 candle close above 3345**, we’ll look to **buy** with:
* **Entry:** Above **3345**
* **Stoploss:** Around **3332**
* **Target 1:** **3355**
* **Target 2:** **3368**
*(Potential final move into the trap zone)*
📢 **Important Note**: No buy will be considered without a strong **bullish H1 candle close** for confirmation. ✅
---
Let the market come to us — stay smart, not emotional. 🧠💰
\#SmartMoneyConcepts #XAUUSD #H1Analysis #LiquidityHunt #OrderBlock #GoldenFiboZone

XAUUSD Update - Continuation to Break the Bermuda triangle ?on the last week, we could see that triangle pattern has been breakout.
This week, it will continuation to break more higher ?
Let the chart answer it...if 3380's level could be touch, it's a first symptom of reversal to upside movement.
At the bottom side of triangle, we could see that it still respect to the bottom trend line.
Have a blessing week a head !

Gold’s Precision Drop: Wave 5 Ignites the Bullish Reversal
---
### 🚀 **Golden Opportunity Ahead: Wave 5 Bullish Breakout Incoming!**
After perfectly completing the **bearish Gartley pattern**, gold dropped precisely to the **target zone at 3,323**, just as predicted. This move confirmed the formation of **Wave 5**, signaling the end of the corrective phase.
Now, all signs point to a **strong bullish reversal**—and the next step is a powerful rally toward the predefined targets. This is a **prime buying opportunity** for traders looking to ride the wave!
### 🎯 **Buy Zone:**
- **Entry:** Around **3,323 USD**
### 📈 **Profit Targets:**
| Target | Fibonacci Level | Price (USD) |
|--------|------------------|-------------|
| TP1 | 1.0 | 13,447.875 |
| TP2 | 1.27 | 13,536.025 |
| TP3 | 1.618 | 13,649.640 |
The link of. The previous analysis is below in the comment
---

GOLD Weekly Idea💡Why Gold Pulled Back
- Gold pulled back today after hitting $3439.04, just below resistance at $3451.53. Traders took profits ahead of key Fed and trade headlines. Right now, it’s trading around $3414.48, down 0.50%.
- The dip came after the U.S.-Japan trade deal eased geopolitical tension, cutting safe-haven demand. Plus, U.S. bond yields are climbing (10-year at 4.384%), which adds pressure on gold.
Support is building at $3374.42, with stronger buying interest expected around $3347.97 and the 50-day moving average at $3336.40 — a key level bulls want to defend.
Short-term looks a bit weak, but as long as gold holds above the 50-day MA, the bullish trend remains intact. Longer-term, weakness in the dollar, central bank gold buying, and concerns about Fed independence could push prices higher.
🔍Watching the Fed’s July 29–30 meeting next
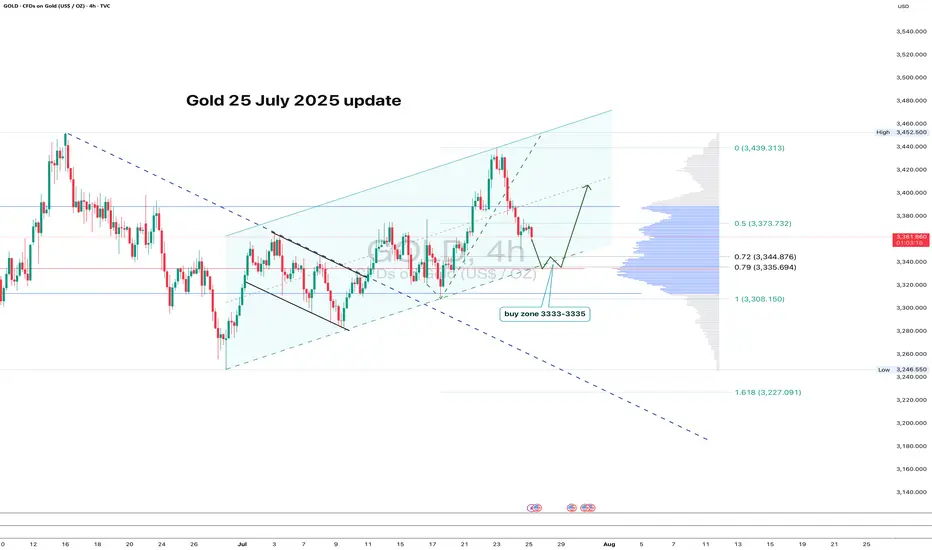
GOLD: clean pullback - now let’s see if support holdsGold continues to trade within an ascending channel on the 4H chart. After a local high, the price pulled back and is now approaching the key zone at 3333–3335. This area lines up with the 0.79 Fib retracement, the lower channel boundary, and a major volume cluster — a classic confluence zone.
If buyers show up here and we get a bullish reversal candle, this becomes a valid long setup with a tight stop just below the level. First target is 3373 (0.5 Fib), followed by a potential retest of the high near 3439.
The structure remains intact, the pullback is orderly, and volume supports the move. As long as the channel holds - the bias stays bullish.
xauussWe will probably have a minor correction in this direction. We will wait for the trend line to break, if it breaks, the targets will be touched in order.

How to correctly grasp the gold trading opportunities?Yesterday, gold prices saw a technical rally amidst volatile trading, followed by a downward trend under pressure. Bulls strongly supported a rebound at 3280 in the Asian session. The European session saw an accelerated upward move, breaking through 3314 before retreating under pressure. We also precisely positioned short positions below 3315, achieving a perfect target of 3290-3295. During the US session, the market again faced pressure at 3311, weakening in a volatile trend before breaking through 3300. The daily chart ultimately closed with a medium-sized bullish candlestick pattern, followed by a pullback and then a decline.
Overall, after yesterday's rebound, gold prices remain under pressure at the key resistance level of 3314. The short-term bearish weakness line has moved down to this level. If pressure continues in this area in the short term, gold will maintain a weak and volatile structure, with intraday trading remaining focused on rebounds and upward moves. If you are currently experiencing confusion or unsatisfactory trading strategies, please feel free to discuss your options and help avoid investment pitfalls.
From a 4-hour analysis perspective, focus on resistance at 3305-3315 on the upside. A rebound to this level is a good opportunity to short against resistance. Focus on support at 3280-3270 on the downside. Unless the price stabilizes strongly, consider not entering long positions below this level. The overall strategy remains to short on rebounds, with the same rhythm. I will provide timely notifications of specific levels from the bottom, so keep an eye on them.
Gold Trading Strategy: Short on rebounds near 3305-3315, with targets at 3290-3280-3270.
XAUUSD ShortElite analysis - NEWS TRADE
Executed of a 3m OB
Targeting lower LPs
Price is reacting at New Event of this OB.
XAUUSD (1H Time frame) Read the captionXAU/USD Analysis (1H Timeframe )
This chart represents the XAU/USD (Gold vs US Dollar) price movement on a 1-hour timeframe, showcasing a well-defined ascending channel. The analysis highlights three critical zones:
1. Resistance Level (Upper Blue Zone):
This zone, located around the $3,440 - $3,450 range, marks the potential upper limit of the current bullish channel. A breakout above this level could indicate strong bullish momentum continuation.
2. Key Support Breakout Zone (Middle Purple Zone):
Around the $3,390 - $3,400 range, this area previously acted as resistance and now serves as a key support level. A price retest and bounce from this zone could confirm it as a new support base, potentially triggering a move toward the resistance zone again.
3. Support Level (Lower Purple Zone):
Found near the $3,320 level, this is the broader trendline and horizontal support zone that would be critical if the price breaks below the key support area. It acts as a major demand zone within the ascending channel.
Observations:
The price is currently in a strong uptrend within the rising channel.
A retest of the key support breakout zone is anticipated before potentially pushing higher toward resistance.
A breakdown below the key support could trigger a move toward the lower support level.
Technical Bias:
Bullish as long as the price remains above the key support level.
Bearish reversal may occur on a confirmed breakdown below the ascending channel and lower support zone.

XAUUSD bullish reversal from a demand zoneThe setup also aligns with a liquidity sweep below previous lows, which could trigger a reversal. Price is now breaking minor resistance levels, creating early confirmation for bullish momentum.

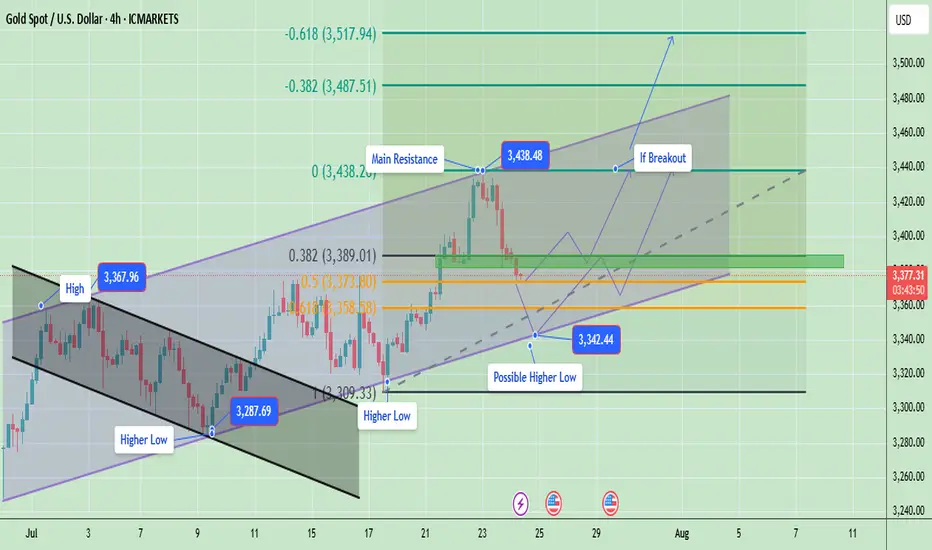
Gold Breakout or Pullback Ahead?Currently, price is in a correction phase within this rising channel after hitting the upper resistance near $3,438. The pullback is moving toward the mid and lower channel zones, which is healthy for a bullish continuation. Gold is in a healthy pullback phase inside a bigger bullish trend. If support at $3,358 – $3,373 holds, expect an upward push back to $3,438 → $3,487 → $3,517 in the coming sessions. Only a clean break below $3,309 would signal a deeper bearish move.
Gold is likely to consolidate or retest the lower channel support ($3,358 – $3,373). If buyers defend this zone, the price is expected to bounce back toward $3,400 – $3,420 and eventually retest $3,438.
Key Price Zones
- Main Resistance: $3,438 (if broken, potential rally toward $3,487 → $3,517)**
- Immediate Support: $3,373 (first reaction level)
- Major Support: $3,358 (key level to protect bullish structure)
- Potential Higher Low Zone: Around $3,342.44
Expected Price Behavior
- If gold holds above $3,373 – $3,358, it is likely to form a new higher low near $3,342 – $3,358 before attempting to push higher.
- A successful breakout above $3,438 would indicate continuation of the bullish momentum targeting $3,487 and $3,517 ).
- Failure to hold above $3,358 may open the door for a deeper correction toward $3,309, but the overall trend remains bullish unless that level is broken.
Trend Outlook
- Short-Term Trend: Consolidation / corrective pullback within a bullish channel
- Medium-Term Trend: Bullish (higher lows and breakout structure intact)
- Long-Term Trend: Bullish as long as the channel holds above $3,309
Gold is currently in a pullback phase after a strong bullish breakout. The market is likely forming a higher low and may resume upward momentum once the $3,373 – $3,358 zone is confirmed as support. A breakout above $3,438 would validate a bullish continuation toward $3,487 - $3,517.
Note
Please risk management in trading is a Key so use your money accordingly. If you like the idea then please like and boost. Thank you and Good Luck!
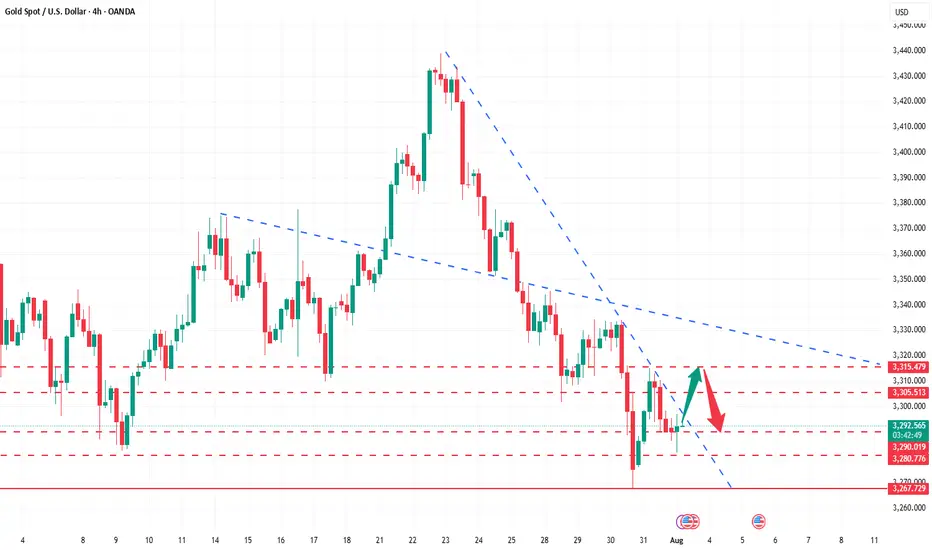
XAUUSD is still bearish Gold is currently below rising channel and holding the Range of 3320-3335,although yesterday implusive drop is incompleted without testing 3290-3280
What's possible scanarios we have?
▪️I'm still on bearish side till 3345 is invalidated and candle flips above. I open sell trades at 3332 again and holds it .
if H4 & H1 candle close above 3345 I will not hold or renter sell.
▪️Secondly if H4 candle closing above 3345 this down move will be invalid and Price-action will reached 3370.