GOLDCFD trade ideas
XAUUSD Expecting bullish Movement Gold is currently testing a strong demand zone between 3340 to 3335, which previously acted as a support area. The price action indicates potential for a bullish reversal from this zone, supported by oversold conditions and historical reaction levels.
Entry Zone: 3340 to 3335
First Target: 3375
Second Target: 3390
Two potential scenarios are highlighted:
A direct bullish reversal from the 3340–3335 zone
A slight consolidation before continuation to the upside
This setup offers a favorable risk-to-reward opportunity for intraday or short-term swing traders. Monitor price action confirmation signals before entering

Gold rebound is weak, short below 3315
Gold remains weak, with multiple intraday rebounds failing to maintain momentum. The upper moving average continues to suppress the market, and the short-term market remains dominated by bears. Today, we are following the trend and taking a bearish stance. The key upside level is around 3315. If it reaches this level before the US market opens or if it peaks in the short term, we will short sell. The non-farm payroll data will be released today, and we will consider reversing our direction based on the situation after the data.
Gold prices have once again encountered resistance to their upward trend, and the volatile pattern continues. The gold price trend is trending lower highs, and today's low is expected to be lower than yesterday's. Therefore, our intraday short target could be 3268 or even lower, so it's crucial to seize the right entry point.
If you're new to the market, come to me. I'll teach you how to trade while you learn. If you're already in the market and struggling, come to me. I'll help you avoid repeating the same mistakes. If you've already experienced this market and are battered, come to me. I'm confident I can help you regain confidence. If you're stuck in a position, I'll develop a strategy tailored to your entry point. Because everyone's trapped positions are different, the solutions will vary, some suitable for conservative traders and others for aggressive ones. However, I can't offer a perfect answer to every situation. I suggest you bring your order with you. Once you contact me, I'll use the most appropriate method to resolve your situation and help you exit the market.
Specific Strategy
Short gold at 3315, stop loss at 3325, target at 3280

Gold (XAU/USD) on the 1‑hour timeframeGold (XAU/USD) on the 1‑hour timeframe
Chart Structure & Bias
* Price remains trapped in a **rising channel** (\~\$3,328–3,333), pressing against resistance near **\$3,340–3,345**.
* Short-term momentum is bearish: both EMA 7 and EMA 21 sit above current price, with declining volume signaling weakening buyer strength.
* Overall trend leans neutral‑to‑bearish until market clears key zones decisively.
Trade Scenarios
**Bearish Breakdown (Preferred)**
* **Trigger:** Break and close below channel support (\~\$3,326).
* **Targets:** Initial drop toward **\$3,320**, then **\$3,300**, and possibly lower if momentum intensifies.
* **Invalidation:** Price pushes back above **\$3,333–3,335**, negating bearish structure.
**Bullish Breakout (Conditional)**
* **Trigger:** Clean breakout and sustained close above **\$3,342–3,345**.
* **Targets:** Upward stretch toward **\$3,355–3,360**, and if strong, **\$3,367–3,375+**.
* **Invalidation:** Fails to hold structure—retesting from above back beneath **\~\$3,338**.
Macro Drivers & Market Conditions
* Caution prevails pre‑Fed decision and ADP / GDP releases—market awaits cues on interest rate direction.
* Safe‑haven demand has softened as global trade sentiment improves, while U.S. dollar strength continues to cap upside in gold.
* Analysts favor **sell‑on‑rise positioning**, bumping up potential for controlled pullbacks.
Verdict
Gold is consolidating in a tight upward channel, showing short-term bearish pressure. The **bearish breakdown scenario holds the edge** unless price convincingly clears above **\$3,345** on strong volume, which could flip bias. A confirmed break below **\$3,326** sets the stage for downward moves toward **\$3,300** or lower.

XAUUSD
XAUUSD Updated in 15M :
The gold signal is marked on the chart based on the latest price changes and the supply and demand in the market. These points include the entry point, stop loss, and take profit

GOLD SETUP – BUY THE DIP OR SELL THE LIQUIDITY?Smart Money Playbook with Macroeconomic Context
📅 Date: July 31, 2025
🧠 Analyst: Clinton Scalper
🔍 Technical Breakdown (XAU/USD – H1/H4 Confluence)
Price is currently reacting within a key Fair Value Gap (FVG) zone and appears to be setting up a liquidity sweep on both sides before committing to a strong directional move.
🟢 BUY PLAN
Entry: 3,284
SL: 3,275
TP Targets:
▫️ TP1: 3,290
▫️ TP2: 3,300
▫️ TP3: 3,310
▫️ TP4: 3,320
▫️ TP5: 3,330
▫️ TP6: 3,340
▫️ TP7: 3,350
Key Support Zone: 3,276–3,284
→ Bullish OB + previous demand + potential BOS if price holds
🔴 SELL PLAN
Entry: 3,324
SL: 3,334
TP Targets:
▫️ TP1: 3,320
▫️ TP2: 3,310
▫️ TP3: 3,305
▫️ TP4: 3,300
Sell Zone: Inside FVG + liquidity inducement structure
→ Sell into imbalance after price fakes above recent swing highs
🔎 Smart Money Logic
Price is navigating a deep retracement inside a key FVG, targeting both sides of liquidity before trend continuation.
The BUY PLAN aligns with a classic "liquidity sweep → OB rejection → internal structure break".
The SELL PLAN is a short-term scalping idea inside the FVG liquidity zone, where institutional orders are often triggered before real bullish continuation.
🌍 Macroeconomic Context
US GDP data recently came in slightly below forecast → weaker USD outlook.
Gold demand remains supported due to:
Geopolitical risks (Ukraine, Taiwan tensions)
Market uncertainty over next Fed move (dovish bias increasing)
Real yields declining → bullish for precious metals
However, any hawkish Fed speak or sudden bond yield spikes can trigger intraday sell-offs into OB demand.
🎯 Trading Strategy Outlook
Buy if price sweeps below 3,284 and holds the demand zone. Target extended upside as macro supports gold.
Sell scalp at 3,324–3,330 zone if price shows rejection in FVG zone, but don’t overstay shorts.
⏳ Patience is key: Let price fill liquidity zones and follow smart money trail.
📌 Summary
🔸 Primary Bias: Bullish (Buy Plan favored due to macro + structure)
🔸 Secondary Bias: Bearish scalps from premium FVG
🔸 Watch for: USD volatility, yields, and institutional reaction in OB/FVG zones.

Gold Bearish OpportunityStrong bearish momentum
Close below 3300 could trigger further sell off
Possibility of liquidity & volatility is high due to monthly close - Stay Cautious

Gold Bulls Charging to 3305 But What’s Waiting There?Gold has recently taken support from the lower levels and has also shown a Break of Structure (BoS) to the downside. Currently, there is Imbalance and Internal Draw on Liquidity (IDM) resting around the 3305 level. The market appears to be moving upward to mitigate that imbalance. It's important to closely monitor this zone, as once the market reaches and fills this area, there is a high probability of a potential rejection or bearish move from that level

Gold 31 July – Bearish Bias Holds, Watching Supply ZonesGold (XAUUSD) Analysis – 31 July
Market structure is now aligned across both higher and lower timeframes:
H4: Bearish
M15: Bearish
This alignment strengthens the probability of trend-continuation setups in favor of the dominant downtrend.
🔄 Current Market Behavior:
The M15 chart is currently in a pullback phase, retracing toward its previous lower high and approaching a key supply zone.
📍 Key Supply Zones to Watch:
Zone 1 – Immediate Supply Zone (3299 – 3305)
• First area of interest where price may react.
• If respected and followed by M1 confirmation, a short setup could be initiated.
• Watch for signs of exhaustion or sharp rejection.
Zone 2 – Higher Supply Zone (3326 – 3332)
• If the first zone fails, this becomes the next high-probability area.
• Well-aligned with the broader bearish structure — expect stronger reaction potential.
• Suitable for cleaner high RR short trades if price reaches this level.
✅ Execution Plan:
• Observe how price behaves inside the marked zones.
• Only plan short entries after M1 confirmation — this adds precision and prevents premature entries.
• Stay patient. Let the market come to you and reveal intent before acting.
📌 Summary:
Bias: Bearish
Structure: H4 and M15 both support downside bias
Zones in Focus:
– Primary: 3299–3305
– Secondary: 3326–3332
Execution: Wait for confirmation before entering.
Risk-Reward: Maintain 1:3 RR minimum (e.g., 40 pip SL, 120 pip TP).
Let the structure guide your setups — not impulse.
📘 Shared by ChartIsMirror

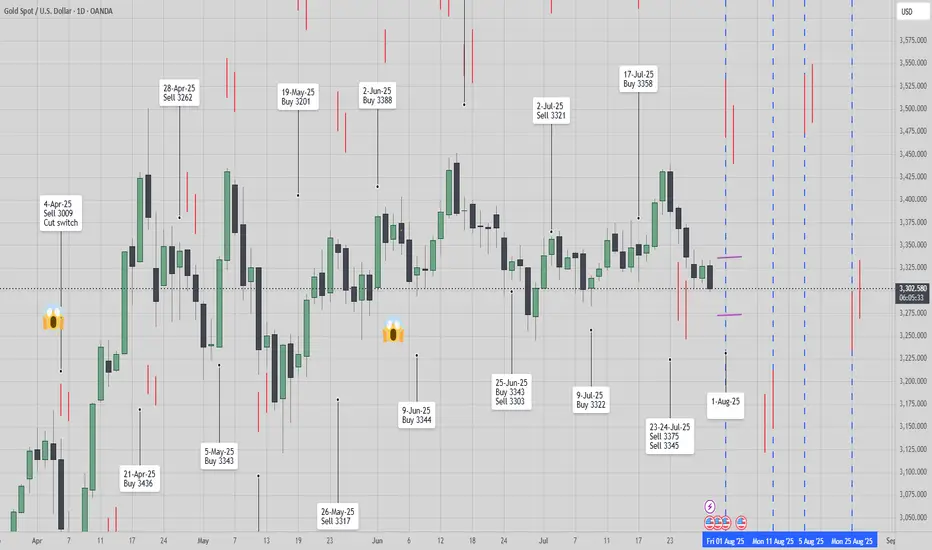
[ TimeLine ] Gold 31 July 2025📆 Today’s Date: Wednesday, July 30, 2025
📌 Upcoming Signal Dates:
• July 31, 2025 (Thursday) — Single-candle setup
• July 31–August 1, 2025 (Thursday–Friday) — Two-candle combined range
🧠 Trading Outlook & Notes
✅ Gold has recently dropped sharply from 3439 to 3298, and current conditions suggest this bearish momentum may continue.
✅ I’ll be actively trading both the July 31 and July 31–August 1 setups as part of my ongoing strategy testing and live analysis.
✅ This method and timing structure can also be applied to other assets like BTC, the US Index, and various commodities.
⚠️ For those taking a more cautious approach, it’s absolutely okay to skip the single-candle setup on July 31 and wait for the more confirmed 2-day range setup (July 31–August 1).
📋 Execution Guidelines
🔹 Range Identification:
• Let the Hi-Lo range of the chosen candle(s) form completely.
• Purple lines will mark these ranges on the chart.
• After the daily close, charts will be updated to include a 60-pip buffer, Fibonacci zones, and relevant indicators.
🔹 Entry Conditions:
• Trades are triggered only if price breaks above/below the full range, including the buffer zone.
🔹 Risk Management – Recovery Logic:
• If the Stop Loss is triggered, the trade is exited or switched, and the next valid breakout setup will use a doubled lot size to attempt recovery.
📉📈 Chart Snapshot
🔗 Paste this in TradingView: TV/x/fykxBG6w/
📌 Stick to the plan, follow the system, and let the chart lead the way.
🛡️ Capital protection comes first — always manage your risk.
Scalping Sell Setup – Trendline Break & Pullback Confirmation📉 Scalping Sell Setup – Trendline Break & Pullback Confirmation
Posted earlier – trade progressing as planned.
As shared in the previous chart, a Sell scalp position was executed based on the trendline break followed by a pullback retest.
Three Take-Profit levels were marked and the price is moving in line with the forecast. ✅
🟢 TP1 Hit
🟢 TP2 Reached
🔵 TP3 in progress
📌 The setup remains valid, and as long as structure holds below the retested trendline, the bearish bias continues.
We will monitor price action near TP3 zone for final exit or trailing stop update.
> Analysis worked perfectly so far – let’s see if TP3 gets cleared soon. 🔍💥

Gold VS US 10- year yield Gold pared most of its gains on a strong US dollar. It hits an intraday low of $3307 and is currently trading around $3311.
Any breach below $3305 (365- 4H EMA) confirms trend weakness and a dip to $3245/$3200 is possible. The strong US dollar and surge in US 10-year yield after strong US jobless claims and GDP data.
It is good ot sell below $3305 with an SL around $3330 for a TP of $3245/$3200.

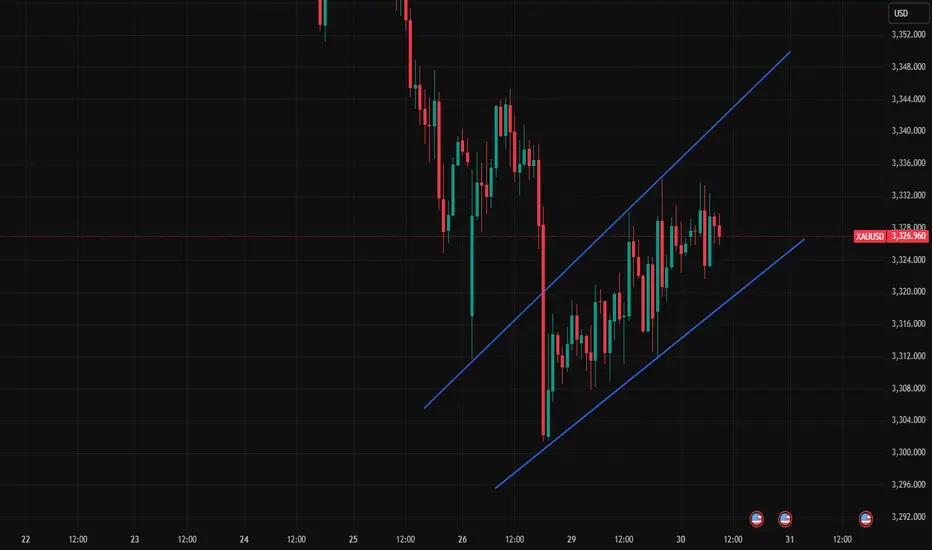
Gold Channel on 1h chartThis is Gold channel on 1H chart it is showing support and resistance levels. If Gold cross this channel then an strong trend could be possible.
XAUUSD CAN FLY HIGHXauusd market running in side from last few days now market will touch the support zone so if you to buy gold then you have to good oppourtanity to buy from support level
TRADE AT YOUR OWN RISK
REGARD ALBERT

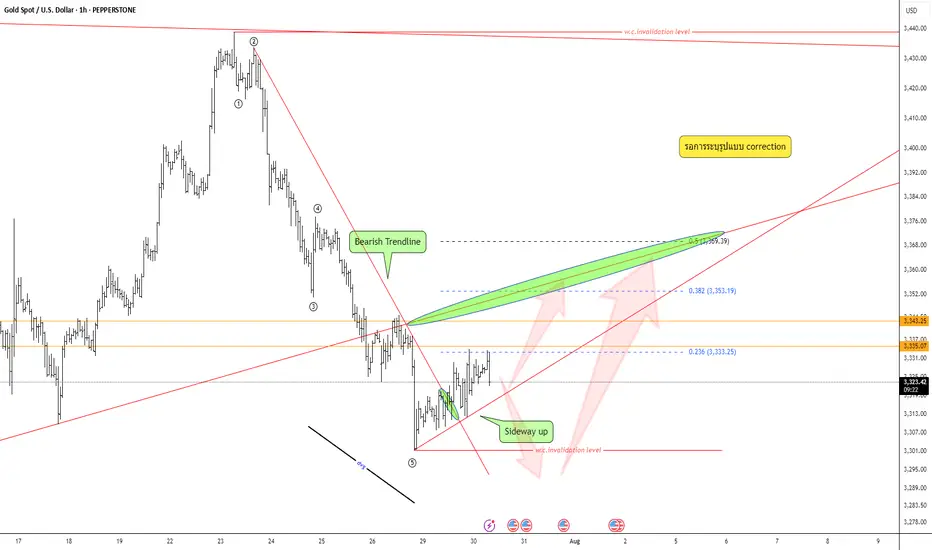
Keep an eye on the correction pattern —Quick Take:
- Strong bearish move, but wave structure still unclear — not a confirmed impulse.
- Bear trendline has broken; market now leaning toward sideways-up.
- Divergence is visible.
Plan:
Wait for correction pattern → confirm with your system → execute only with full data and strict risk management.
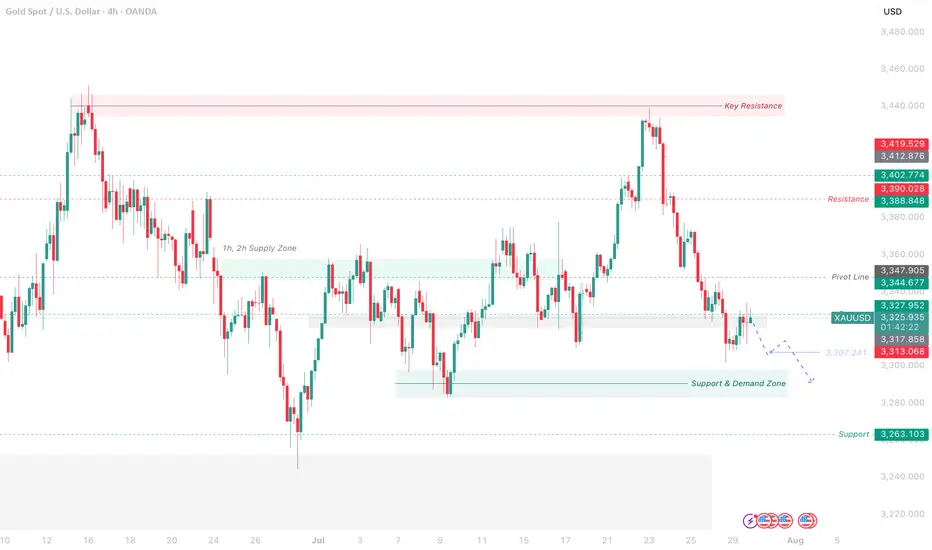
Gold Struggles Near Resistance – Eyes on 3313 for Further DropXAU/USD Slips as Dollar Gains on Trade Deal – Bearish Below Pivot Zone
Gold is under pressure as the U.S. dollar strengthens on optimism around a trade agreement. Risk appetite has returned, weighing on safe-haven demand.
Price failed to hold the pivot zone (3347–3360) and is now slipping below 3327. A 4H close below 3313 will likely trigger further downside.
Until bulls reclaim the pivot, bias stays bearish. Next support sits near 3287 if 3313 breaks clean.
Key Levels:
Resistance: 3388 – 3390 – 3412
Pivot Zone: 3340 – 3347
Support: 3313 – 3263
How to plan for the evening, pay attention to the 3300 markAfter the shorts took profits, gold consolidated in the 3310-3300 area. Judging from the daily chart, the decline in gold seems to have just begun, with the middle track of the Bollinger Band at around 3345 and the lower track at 3285. The possibility of falling below the 3300 mark cannot be ruled out in the evening. If gold falls below the 3300 mark, it may first hit 3295. If the decline continues, it may even hit the low of 3285-3275 below. However, if the 3300 mark can be effectively defended, then the possibility of maintaining the consolidation of 3300-3345 in the evening may be maintained. Therefore, it is not recommended to easily participate in transactions at the current position in the evening. It is mainly advisable to wait and see and pay attention to the breakthrough of the 3300 mark.
My premium privileges are about to expire, and subsequent trading strategies and analysis will be published in the group.
Waiting for Gold to Dump| Area Of OpportunityWe can clearly see the overall trend of Gold, which is bearish. As the price action we see bearish FVA (Fair Value Areas/Swing Lows) being run. The anticipation is to wait for the latest Swing low to be ran, before looking for entries.
Why?
Because, the path towards our nearest POI (Point Of Interest) will have a low resistance. Meaning price might expand lower smoothly.

buy idea xauusdxauusd buy scenario
demand created we can long xauusd untill we reach the next supply
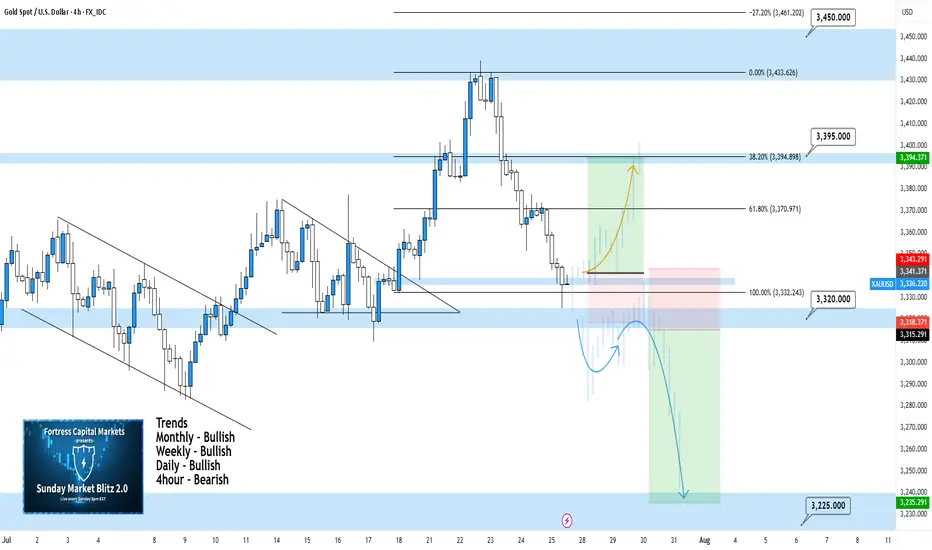
XAUUSD 4Hour TF - July 27th, 2025XAUUSD 7/27/2025
XAUUSD 4 hour Neutral Idea
Monthly - Bullish
Weekly - Bullish
Daily - Bullish
4hour - Bearish
Last week we saw a perfect setup playout and then it retraced 100% to close out the week. This is looking more bearish on the 4Hour timeframe now but we need to see how price action reacts at the 3,320 support zone first.
Here are two potential scenarios we want to see for the week ahead.
Bullish Reversal - If we are to see gold as bullish again we would ideally like to see some consolidation at the current level followed by strong bullish conviction.
We need to see convincing price action before we can begin targeting higher. Consolidation + Bullish conviction will be our best chance at a long position.
Bearish Continuation - The 4hour sure looks bearish but will it sustain? Looking ahead into the week we want to see price action push below 3,320 with bearish structure below.
I would also like to see a pattern or a few hours to a day of consolidation below 3,320. If this happens we can begin to target lower toward major support levels like 3,225.
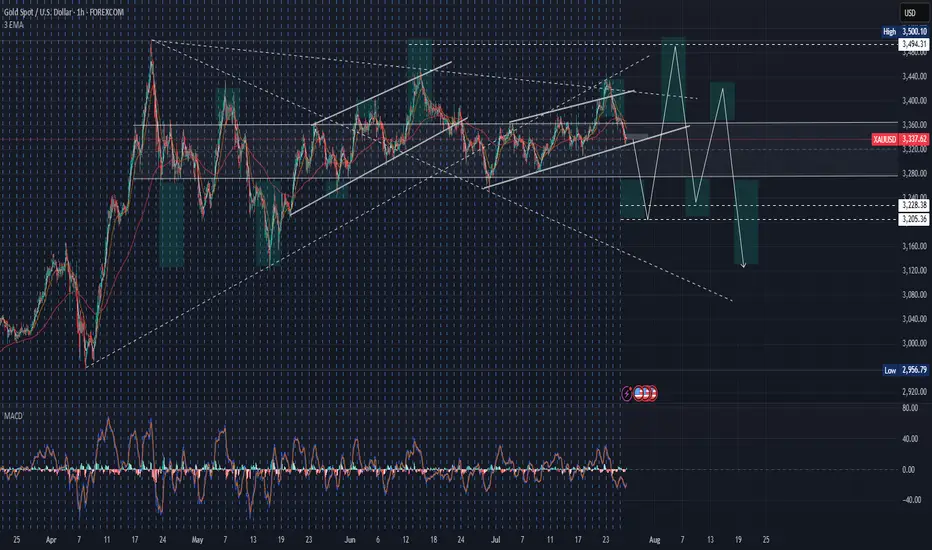
GOLD CONTINUATION PATTERNHello folks, here we go again, This idea stuck in my head only today and its friday. rather shared it or none, but see the charts for stops and target. this might be your lucky day on my page.
Here is my idea, take it if you love to swing or watch it fade. Congrats were on 800 community or I got more followers because of this. and Previous idea we made a lot thats 1200 pips good for a month trade. lets see this August. my target is labeled this chart first at 3500 zone. next target will be posted on my notes or updated the idea. no charts until it breaks that labeled on chart. until it goes higher again.
You will never see this kind of idea for a month again. So follow on my page, I have some for you if you have small accounts.d m here
My goal is to target the highest TP will be above this new highs.

XAUUSD – Demand Zone Reaction & Potential Markup (VSA Analysis)💡 Idea:
Gold is testing a major 4H demand zone with early signs of smart money accumulation. VSA signals show supply exhaustion and potential for a bullish reversal toward upper resistance.
📍 Trade Setup:
Entry Zone: 3,265 – 3,285 (current demand zone)
Target 1: 3,380 – 3,400 (mid supply zone)
Target 2: 3,440 – 3,460 (major supply zone)
Stop Loss: Below 3,240 (to avoid false breakouts)
R:R Potential: ~3:1
📊 Technical Reasoning (VSA)
Stopping Volume Detected
On the recent drop into the demand zone, a wide spread down-bar on ultra-high volume appeared, followed by no further downside progress.
This is a classic stopping volume pattern where professional money absorbs selling pressure.
No Supply Confirmation
Subsequent candles inside the zone show narrow spreads on decreasing volume, indicating a lack of genuine selling interest.
Demand vs Supply Shift
Multiple attempts to break below 3,265 have failed, showing absorption of supply and positioning for markup.
If price rallies from here on increasing volume and wider spreads up, it would confirm demand dominance.
Structure Context
This demand zone has historically produced strong rallies.
Break above the minor resistance inside the zone could trigger a swift move toward Target 1, with momentum possibly extending to Target 2.
📌 Trading Plan:
Look for bullish confirmation bars with high volume before entry.
If price breaks below 3,240 on high volume, invalidate the long setup and watch for the next demand level around 3,140.
Partial profits can be taken at Target 1, and the remainder trailed toward Target 2.

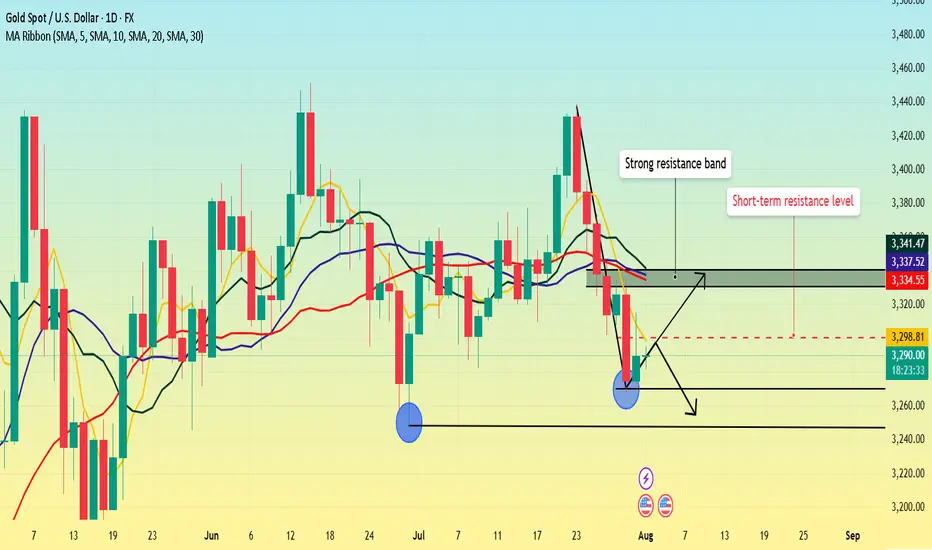
Non-farm payrolls are coming. What's the gold trend?Gold fell sharply on Wednesday, but Thursday's market didn't continue the downward trend as some investors expected. Instead, it showed a trend of rising and then falling.
From the daily perspective, we first need to focus on the resistance level near 3300 where the 5-day moving average is located. This position is not only a short-term technical resistance, but also reflects the market's psychological expectations to a certain extent. If prices can successfully break through this level and stabilize above it, it will indicate that bullish momentum is strengthening, potentially boosting market sentiment. At this point, the next resistance area to watch is the 3330-3340 range. This area converges the 10-day, 20-day and 30-day moving averages, forming a strong resistance band.
As for the support below, the primary focus is Wednesday's low of 3268. However, if this level is lost and the price continues to fall, the next support area will be around 3245, which is the previous low.
Trading strategy:
Short around 3300, stop loss at 3310, profit range 3280-3260.