gold has reach daily supportMomentum is still bearish however selling low is not advisable.
so there are certain point of interest that we want to look for as gold currently is at the support level. a strong one
GOLDCFD trade ideas

Gold (XAUUSD) Breaks Trendline – Potential Downside Ahead?Gold (XAU/USD) has officially broken below a long-term ascending trendline on the 4H chart, indicating a potential shift in market structure. The recent breakout from a bear flag pattern confirms bearish momentum, and price is now approaching a key horizontal support zone around $3,249 and $3,242.
🔹 Trendline support (now resistance) broken
🔹 Bear flag breakdown – strong bearish candle
🔹 Eyes on support levels: $3,249, $3,165, and possibly lower
🔹 Watch for a potential retest of the broken trendline for short opportunities
A clean break and close below $3,249 could open the door for further downside in the coming sessions. Trade cautiously and manage your risk!

XAUUSD BUY AND SELL LEVELSGold (XAUUSD) is currently showing key movement potential as it reacts to major levels. We are watching closely for price action near important support and resistance zones to identify the next trade setup.
📌 Stay alert for possible retracements or breakouts. Both buying and selling opportunities may arise depending on market reaction.
Trade with confirmation and always manage risk wisely.

Gold--sellWell, gold is having an interesting moment. It is currently correcting in a downtrend and is holding steady. I don't feel any strength in its trend. How far will it correct to the specified area?


GOLD: Bearish Continuation & Short Trade
GOLD
- Classic bearish pattern
- Our team expects retracement
SUGGESTED TRADE:
Swing Trade
Sell GOLD
Entry - 3331.7
Stop - 3334.0
Take - 3327.0
Our Risk - 1%
Start protection of your profits from lower levels
Disclosure: I am part of Trade Nation's Influencer program and receive a monthly fee for using their TradingView charts in my analysis.
❤️ Please, support our work with like & comment! ❤️

Gold Market Builds Momentum Toward 3358 Supply ZoneGold market continues to build momentum gradually, with price action targeting supply mitigation at 3358.
The duration of this stance depends on whether price can clear this zone decisively; failure may lead to short-term consolidation before the next stance.comment ,boost idea and follow for more informed decisions on gold market

Gold recently experienced a typical "suppression and release"Capital dynamics and sentiment modeling, found that the gold market has recently experienced a typical "suppression and release" type of reaction. After a period of sustained pressure on the emotional background, the dominant force of the short side began to weaken, and both long and short sentiment tends to be balanced, and the logic of gold as a safe-haven asset has been re-explored and recognized.
This type of trend is often non-explosive, but through the emotional layers of repair and structural slow reversal of the gradual unfolding. The current signal strength has reached the bearish threshold set by the system, with a certain operational feasibility.
It is recommended that traders try to follow up with a low percentage of positions, but still need to retain enough position space to cope with the possible continuation of fluctuations. The whole layout is mainly defensive and offensive, and it is appropriate to seek progress in a stable manner.

Gold (XAU/USD) – Technical UpdateDate: July 30, 2025
✅ Market Reaction Confirms the Forecast
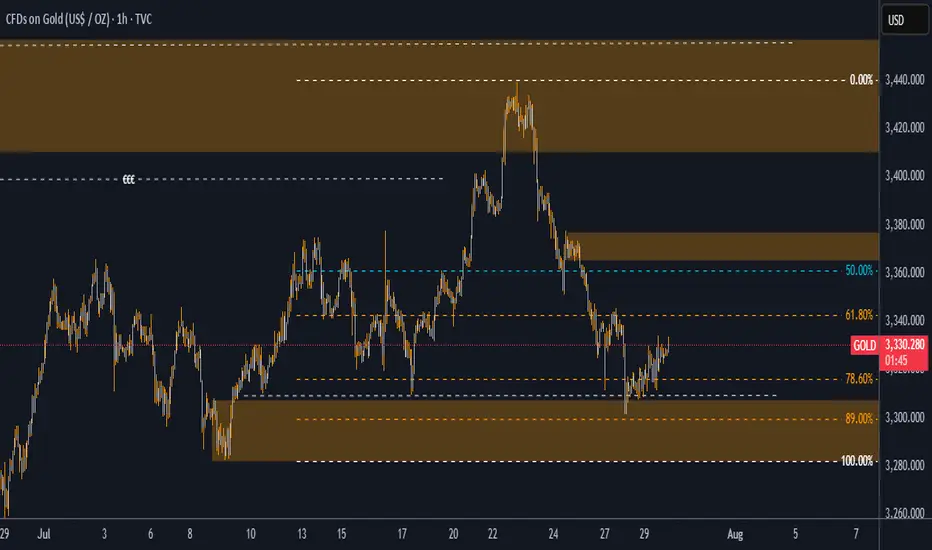
In our previous analysis, we highlighted the $3,308–$3,315 region as a high-probability demand zone, reinforced by a deep retracement into the 89% Fibonacci level. We also pointed to a liquidity grab beneath $3,308 and projected a potential bullish reversal toward $3,345 and $3,398.
Today, price action has validated this view with precision.
✅ Price swept liquidity below $3,308 as expected, triggering a sharp rejection from our zone.
✅ A clear bounce followed, pushing price upward and confirming that large buyers stepped in—exactly where we anticipated.
✅ The structure is now shifting bullish, with price currently trading above $3,331, heading confidently toward our first target at $3,345.
📊 Why This Matters
This reaction was not random—it followed the logic laid out in the prior analysis:
-The demand zone was respected.
-The discounted pricing at 89% retracement offered maximum risk-reward.
-The internal imbalance between $3,345–$3,398 continues to act as a magnet, just as we outlined.
This is a textbook move where price hunted stops, tapped into demand, and began its upward drive—exactly as described in advance.
🎯 Targets Remain Valid
Target 1: $3,345 → Currently in progress. Price is gravitating toward this level, which also aligns with the 50% Fib retracement and minor supply.
Target 2: $3,398 → The final destination of this bullish move, completing the fill of the inefficiency left behind by the last drop.
🧠 Final Word
This is a strong confirmation of the original idea. The technical story has unfolded step by step as predicted, proving the reliability of the analysis. For traders following along, this not only reinforces confidence in the setup—but also showcases the power of disciplined, structure-based trading.
🔥 The move is unfolding exactly as projected. Patience, precision, and planning are now paying off.
consider like and follow so you don't miss any next analysis or update of the chart
you can ask me in the comment section
Please check how to trade later.Since the release of the trading strategy, I have been able to accurately predict market trends. I am also grateful to so many brothers for following me. My premium privileges are about to expire. I will put the subsequent trading content in the group. If any brothers are interested, they can find me through 🌐. As for how to deal with the future market, I have stated the extraordinary situation and will patiently wait for the rebound of gold. At the same time, I will pay attention to the impact of the Sino-US trade talks.
European session under pressure 3321 continue to shortI reminded everyone last night that if gold holds the 3300 mark, it will consolidate in the 3300-3345 range in the short term. The current gold price basically fluctuates narrowly between 3320-3310. Judging from the daily chart, the short-term upper pressure is at 3330. Only if the daily line stands firmly above 3330, there is a possibility of a rebound upward in the short term. Judging from the hourly chart, gold is still in a downward trend, and the hourly line is blocked near 3321. In the short term, if it cannot break through 3320-3330, gold will continue to fall. You can consider shorting, with the target at 3310-3300. If the European session is still volatile, maintain high shorts and low longs to participate in the cycle.
My premium privileges are about to expire, and subsequent trading strategies and analysis will be published in the group.

Analysis on the 10 Elite PairsYou can follow us for more Analysis(Images and Videos) with Precise definition of the Financial Market.ENJOY!!!

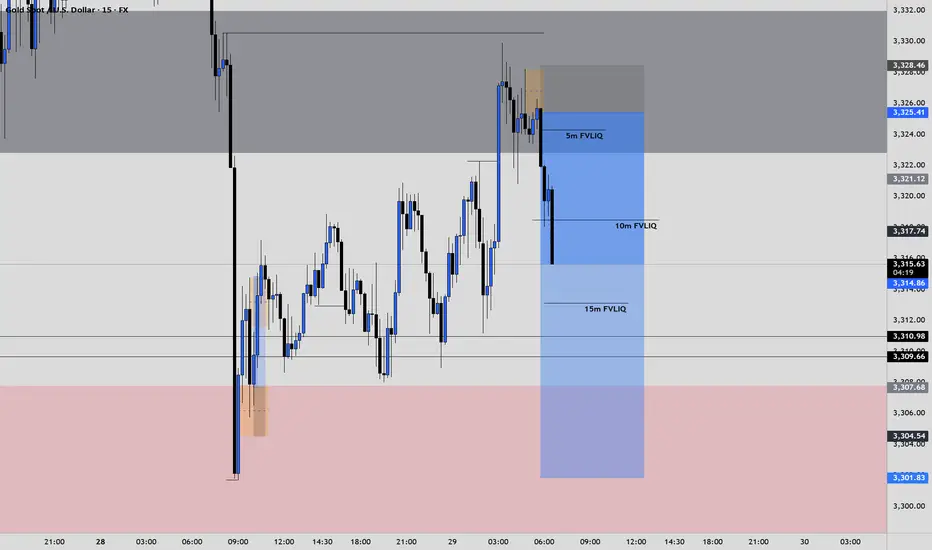
XAUUSD ShortElite Analysis
Noticed price came to structural liquidity
Obtain confirmations to short
Executed from 3m OB
Targeting Lower liquidity pools, main target London low
Gold Analysis and Trading Strategy | July 29✅ Fundamental Analysis
🔹 U.S. Dollar Index Surges Strongly: On Monday, the U.S. Dollar Index jumped over 1%, closing at 98.6, marking a new short-term high. This rally was primarily driven by the U.S.-EU trade agreement, which reduced tariffs to 15%, easing concerns of a trade war escalation. As a result, risk assets gained appeal, while gold's safe-haven demand was suppressed.
🔹 U.S.-China Talks Resume with Limited Expectations: The U.S. and China resumed trade negotiations in Stockholm, aiming to extend the 90-day tariff truce. However, the U.S. side made it clear that "no major breakthroughs are expected," leaving room for uncertainty, which provides some support for gold.
🔹 Geopolitical Risks Remain Elevated: President Trump has set a 10–12 day deadline regarding the Russia-Ukraine issue, warning of stronger measures if no progress is made. Meanwhile, tensions in the Middle East continue. Any escalation in conflicts could trigger renewed safe-haven buying in gold.
✅ Technical Analysis
🔸 Gold closed lower again on Monday, marking the fourth consecutive daily loss. The price rebounded to the 3345 level during the day but encountered strong resistance. During the European session, gold broke down swiftly, reaching a low of around 3301, showing a typical one-sided sell-off with strong bearish momentum.
🔸 On the 4-hour chart, gold broke below the key support level at 3320 and continued trading below the MA system. If the price fails to reclaim the 3330–3340 zone, the outlook remains bearish. However, if the European or U.S. session can push the price firmly above 3330, a potential bottom formation could be underway.
🔴 Resistance Levels: 3330 / 3345–3350
🟢 Support Levels: 3300 / 3285–3280
✅ Trading Strategy Reference:
🔻 Short Position Strategy:
🔰Consider entering short positions in batches if gold rebounds to the 3340-3345 area. Target: 3320-3310;If support breaks, the move may extend to 3300.
🔺 Long Position Strategy:
🔰Consider entering long positions in batches if gold pulls back to the 3300-3305 area. Target: 3325-3335;If resistance breaks, the move may extend to 3345.
🔥Trading Reminder: Trading strategies are time-sensitive, and market conditions can change rapidly. Please adjust your trading plan based on real-time market conditions. If you have any questions or need one-on-one guidance, feel free to contact me🤝


Gold----Sell near 3326, target 3300-3280Gold market analysis:
The recent gold daily line is still weak. It rebounded yesterday and fell again. It has touched the strong support of the weekly line. Today's idea is still bearish. Consider continuing to sell it if it rebounds. It is estimated that it will be repaired if there is support at 3300. The daily line was a cross star yesterday, and the upper shadow line was very long. The daily moving average suppression position was also around 3345, and the suppression position of the pattern was also around 3350. Today, the price is below 3345. We insist on being bearish. This week is a data week. The subsequent trend depends on the release of data. If the data is not strong and the weekly selling signal is added, it is very likely that gold will enter the 3200 era. After the weekly line breaks 3280, it basically opens up the weekly line's downward space, and will start a deep decline in the later period. In the Asian session of gold, we pay attention to the suppression of 3326. This position is the indicator suppression and the small suppression of the pattern. Consider selling it near this position. If it stands above 3326, don't sell it. The repair range will be 3345. Consider selling it at 3345. If the US market cannot break 3300, we should consider whether it will rebound. On the contrary, if it breaks 3300 directly in the Asian market, we should consider selling it directly.
Support 3300 and 3280, suppress 3326 and 3345, and the watershed of strength and weakness in the market is 3326.
Fundamental analysis:
This Monday and Tuesday are relatively quiet, and the big data will be released one by one starting from Wednesday.
Operation suggestion:
Gold----Sell near 3326, target 3300-3280

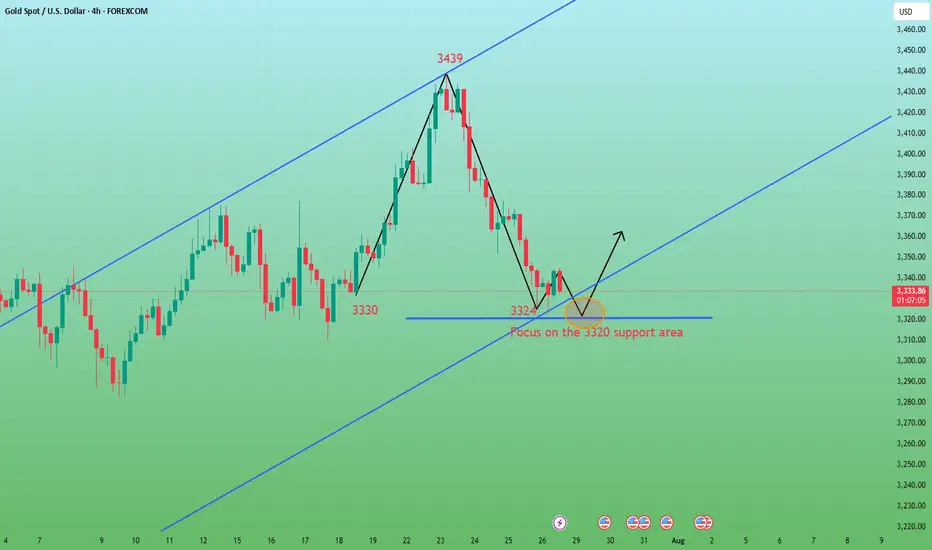
XAUUSD – Technical rebound, but downside risks remainOn the H4 chart, gold is bouncing slightly from the 3,323 support zone after a sharp drop. However, price remains within a large descending channel and is approaching a dense cluster of bearish FVGs around 3,360–3,374.
News context:
– US GDP and ADP data beat expectations, boosting the USD and adding pressure on gold.
– JOLTS dipped but remains above 7 million → limited support for gold.
– Thailand–Cambodia conflict provides only short-term impact.
Strategy: Favor SELL if price retests 3,360–3,374 and gets rejected. Downside targets: 3,323 or lower.
Main trend remains bearish, unless gold breaks above the descending channel.

Analysis and strategy of gold market on July 28:
Core influencing factors
Risk aversion cools down: Despite frequent geopolitical risk events, market panic has not significantly increased, weakening gold safe-haven buying.
US dollar strengthens: US economic data supports the continuous rise of the US dollar, and funds flow back to US dollar assets, suppressing the attractiveness of gold.
ETF holdings outflow: Short-term risk appetite has rebounded, and gold ETFs have seen a slight outflow of funds, reflecting the cautious attitude of the market.
Key events focus:
US-EU and US-China trade negotiations: If progress is optimistic, gold prices may fall to the $3,300/ounce mark.
Federal Reserve resolution: Pay attention to policy independence (affected by Trump's pressure) and interest rate guidance.
Non-farm data: Released on Friday, if the employment data is strong, it may strengthen the US dollar to further suppress gold.
Key technical points
Weekly level:
Watershed $3,325: If it is held, it will maintain high-level fluctuations, and if it is lost, it will open up downward space.
Support area: If the daily support is broken, the weekly support may be tested (reference 3300-3310).
Daily level:
Key support: The current daily support is facing the risk of breaking down, and we need to be alert to the acceleration of short positions.
4-hour level:
Resistance 3388 US dollars (middle track): Before the rebound is not broken, the short-term is short.
Weak signal: The price continues to run below 3363, and the rebound is weak.
Hourly chart:
Strong and weak boundary 3363 US dollars: Maintain weakness before breaking, and avoid bottom-fishing against the trend in the negative market.
Operation strategy suggestions
Short-term direction: Short-selling on rebound is the main, supplemented by light-weight buying at key support levels.
Short-term selling opportunities:
Ideal entry: 3370-3375 area (below the 4-hour middle track), stop loss above 3380.
Target: 3320-3310, if it breaks down, look at 3300.
Opportunities to buy long orders in the short term:
Participate cautiously: If the support of 3320-3310 stabilizes, combine the K-line signal to hold a light long position, and stop loss below 3300.
Quick in and out: You can exit the market when it rebounds to 3340-3350.
Risk warning:
Before the Fed’s decision: Avoid heavy positions, and be wary of unexpected hawkish policies that cause volatility.
Non-agricultural data: If the data exceeds expectations, it will be bearish for gold.
Summary: Gold is short-term technically bearish, but be wary of event-driven reversals. Trading requires strict stop losses and flexible response to data and policy risks.
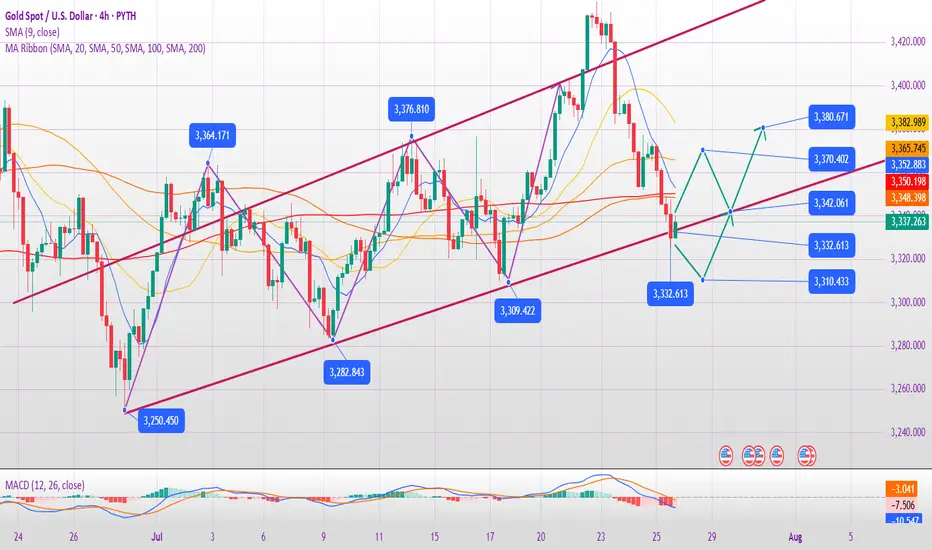
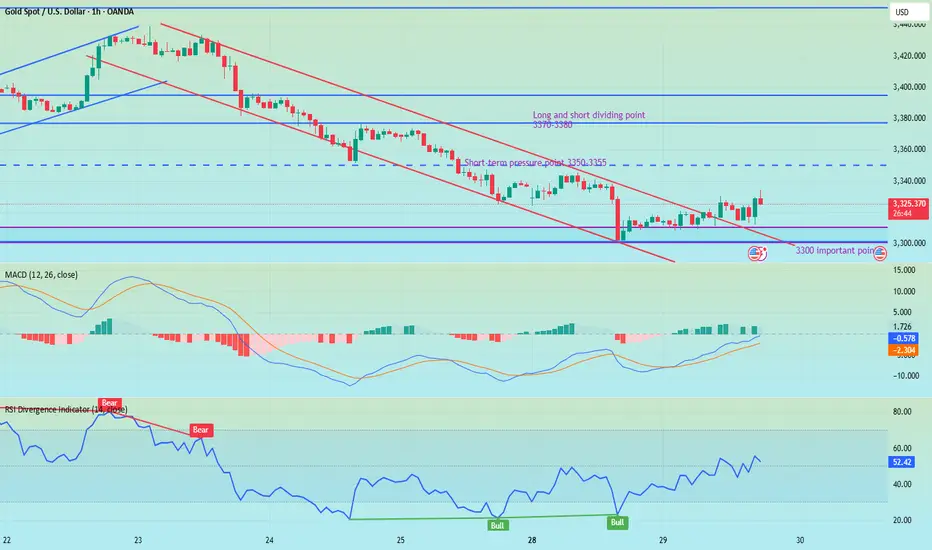
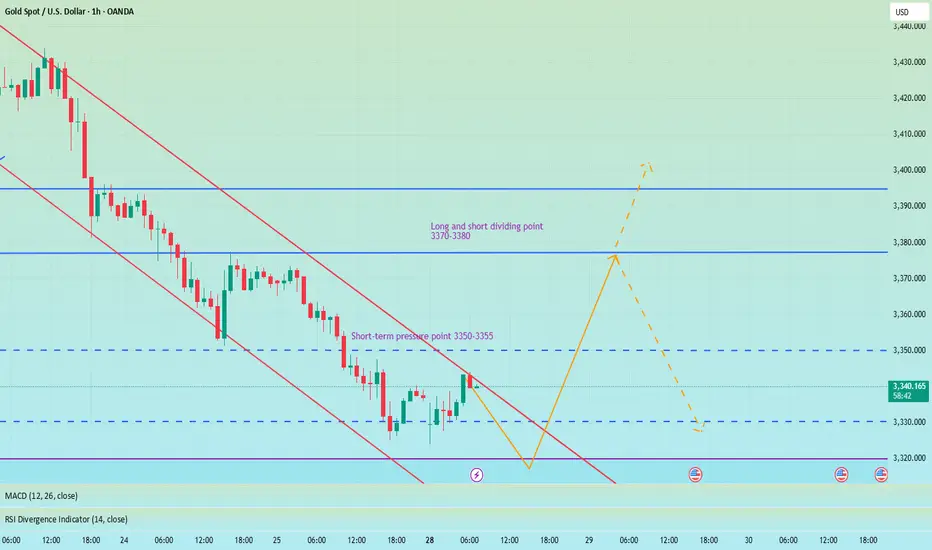
Pay attention to 3350 gains and lossesGood morning, bros. This morning gold again tested last week's low near 3325. From the chart, gold may continue to rise this week, with tariffs approaching, the Fed's interest rate cut, and NFP data imminent. The current strength and weakness are at 3350-3355. If it can effectively break through and stand above, it is expected to continue to test the previous high point, which is also the long-short dividing point of 3370-3380.
From the daily chart, there is not much change in the operational range of gold in the short term, and the change in the 4H chart is more obvious. After the decline in the early trading, it is now rebounding. There is a possibility of closing positive at the low. If it is directly positive on Monday, then it will bottom out directly at the beginning of the week. If it refreshes the low on Monday, the low point of 3285 will be seen below. Therefore, today's market focuses on the continuity of long and short. Of course, according to the current changes, the biggest possibility is to continue to rebound at the low point, pay attention to the support of 3310-3300 below, and pay attention to the gains and losses of the high point of 3355 above.
basicsmost recent trend in five , exhausted down trends with so much buy side demand and structural sets in OUR most recent play wisely


After continuous decline, oversold rebound opportunity.Last week, gold showed a trend of rising and falling. The weekly line closed with an inverted hammer and a long upper shadow, continuing the cross-line pattern of the previous week. The short-term rise was obviously blocked. Although the trend line connecting the daily lows of 3247-3282-3309 has been substantially broken, it may continue to fall after testing and sorting. In the short term, we need to focus on the 3348 suppression level and the 3324 support level. If they fall below, they may fall to the 3300/3285 support area. From the current trend, the overall bearish and lack of rebound momentum, the weak pattern may continue, and only when the price falls to a specific position to complete the bottoming will it attract entry.
Therefore, it is recommended to maintain a bearish mindset. The hourly line shows that the long and short conversions are relatively frequent. The upward trend channel was maintained in the first three days, but all gains were given up in the next two days and the downward channel was rebuilt. Given that both the 4-hour and daily lines have fallen below the key support level, 3348 has become the key point for today's bearishness, and it is necessary to change the mindset in time and go short.
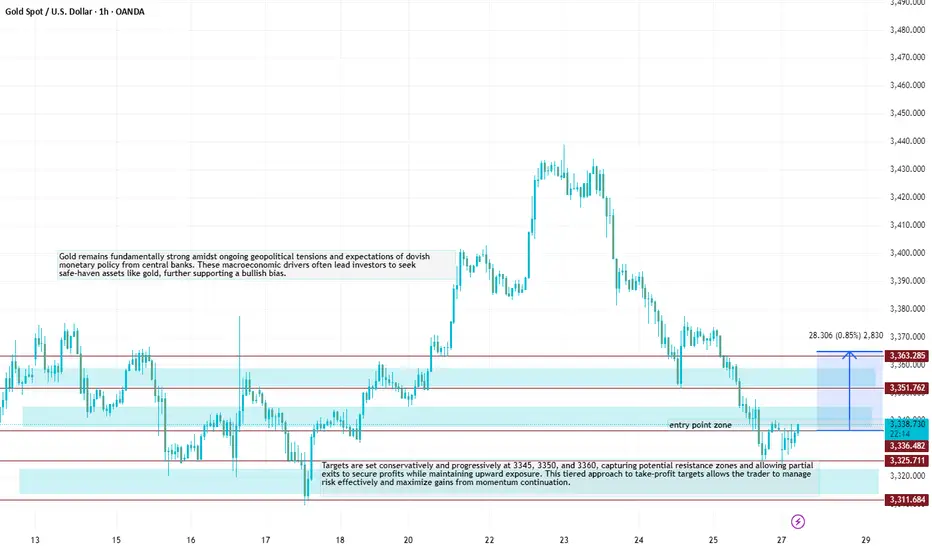
XAUUSDXAU/USD Trade Analysis – buy Setup
📍 Trade Idea: buy Gold (XAU/USD)
Entry Zone: 3338/3336
Stop Loss: 3326..00/Above key resistance zone)
Take Profit Levels:
🎯 TP1: 3345
🎯 TP2: 3350
🎯 TP3: 3360
Targets are set conservatively and progressively at 3345, 3350, and 3360, capturing potential resistance zones and allowing partial exits to secure profits while maintaining upward exposure. This tiered approach to take-profit targets allows the trader to manage risk effectively and maximize gains from momentum continuation.
Gold remains fundamentally strong amidst ongoing geopolitical tensions and expectations of dovish monetary policy from central banks. These macroeconomic drivers often lead investors to seek safe-haven assets like gold, further supporting a bullish bias.