Gold. Trade Swing buy setup 25/July/25XAUUSD "erased" all its early weekly gain by having deep pullback until its weekly pivot and channel support confluence zone again..
GOLDCFD trade ideas

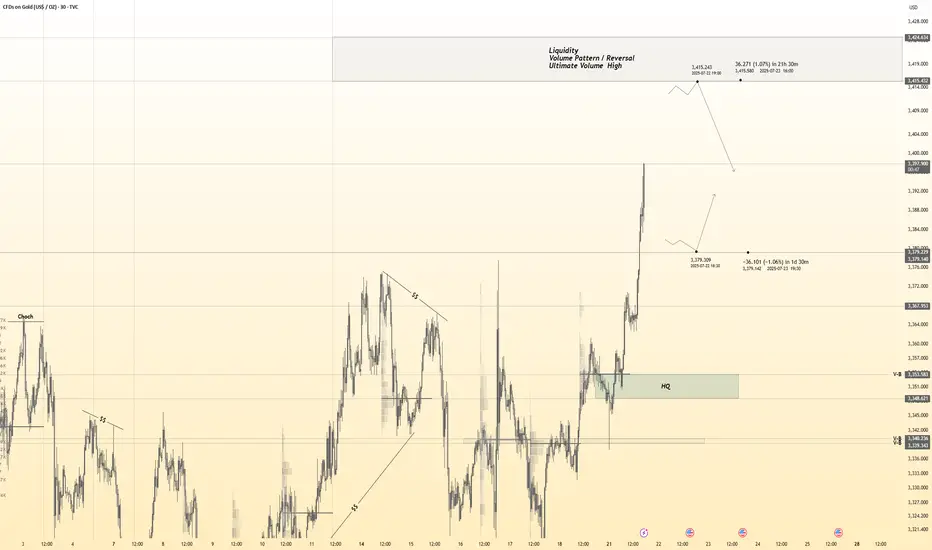
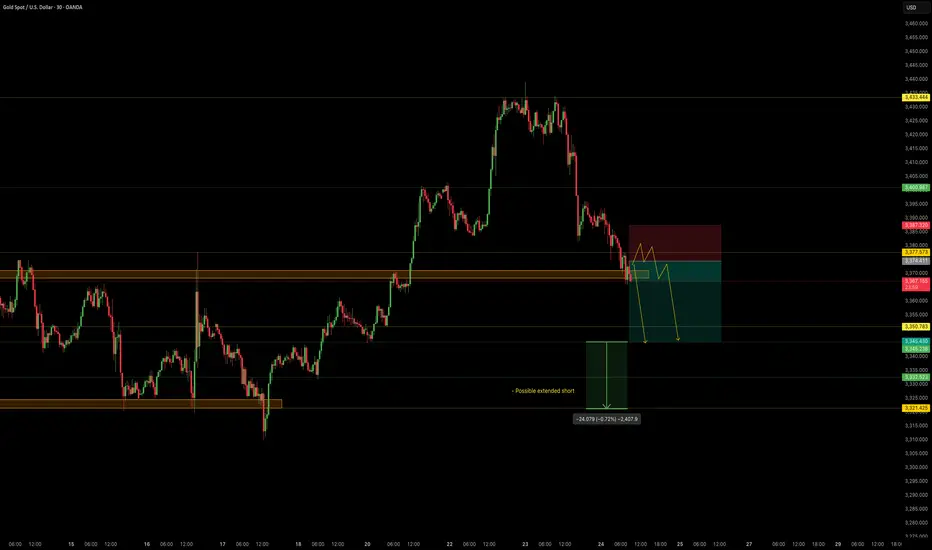
Gold 30Min Engaged ( Bullish & Bearish Reversal Entry Detected )————-
➕ Objective: Precision Volume Execution
Time Frame: 30-Minute Warfare
Entry Protocol: Only after volume-verified breakout
🩸 Accurate Bullish Reversal : 3380
🩸 Accurate Bearish Reversal : 3314.5
➗ Hanzo Protocol: Volume-Tiered Entry Authority
➕ Zone Activated: Dynamic market pressure detected.
The level isn’t just price — it’s a memory of where they moved size.
Volume is rising beneath the surface — not noise, but preparation.
🔥 Tactical Note:
We wait for the energy signature — when volume betrays intention.
The trap gets set. The weak follow. We execute.
Gold Market Completes Bullish Wedge at 3439Gold market lures to 3439, completing the bullish wedge formation as anticipated.
A retracement is now setting in, with price action expected to sweep through 3391—a key zone that may determine the next leg of the trend.
Watch closely for confirmation at this level for a potential bullish continuation or deeper correction. follow for more insight , comment and boost idea
#GOLD Will Keep Growing!
HI,Traders !
#GOLD keep trading in An uptrend
along the rising support So as the gold
is approaching A the support we will be
Expecting a bullish rebound !
Comment and subscribe to help us grow !

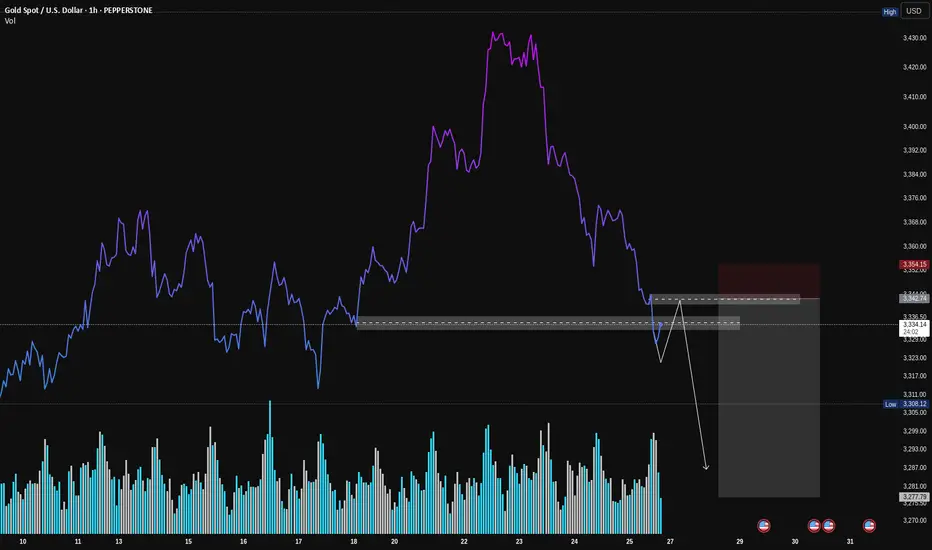
Gold (XAU/USD): A Classic VSA Short Setup in PlayHey Traders,
Following up on the general weakness we discussed in Gold, here's a closer look at a specific trade setup that's unfolding right now. This is a textbook example of a high-probability short setup according to Volume Spread Analysis (VSA).
Let's break down the story the volume is telling us.
1. The Breakdown: Sellers Show Their Hand
First, look at how the price broke down hard through that support level (the grey box). Notice the volume on that sharp drop? It was high. This is our clue that sellers are strong and in control. They had enough power to smash right through a level that was previously holding the price up.
2. The Retest: Buyers Don't Show Up
Now, the price is creeping back up to that same exact level. But here's the most important clue: look at the volume on this rally. It's much lower than the volume on the breakdown.
This is what VSA calls a "No Demand" rally. It’s like the market is trying to push a car uphill without any gas. It tells us that strong buyers (the "smart money") have no interest in buying at these prices.
3. The Setup: Selling into Weakness
This combination creates a classic short setup:
Logic: We are looking to sell at a level where old support has flipped into new resistance.
Confirmation: The low volume on the retest confirms the rally is weak and likely to fail.
How to Potentially Trade It
The grey box represents a high-probability entry zone. To time an entry, you could watch for a clear rejection signal right inside this zone. For example:
A "rejection candle" (like a pin bar) that pushes into the zone but gets slammed back down.
An up-bar with a tiny body and very low volume, showing buyers are completely exhausted.
Seeing one of these signs would be the final confirmation that sellers are about to take back control.
Conclusion:
This is a powerful setup because all the pieces line up: the background is weak, sellers have shown their strength, and buyers are now showing no interest at a key resistance level.
Disclaimer: This is my personal analysis using VSA and is for educational purposes only. It is not financial advice. Always do your own research and manage your risk. Good luck, traders!
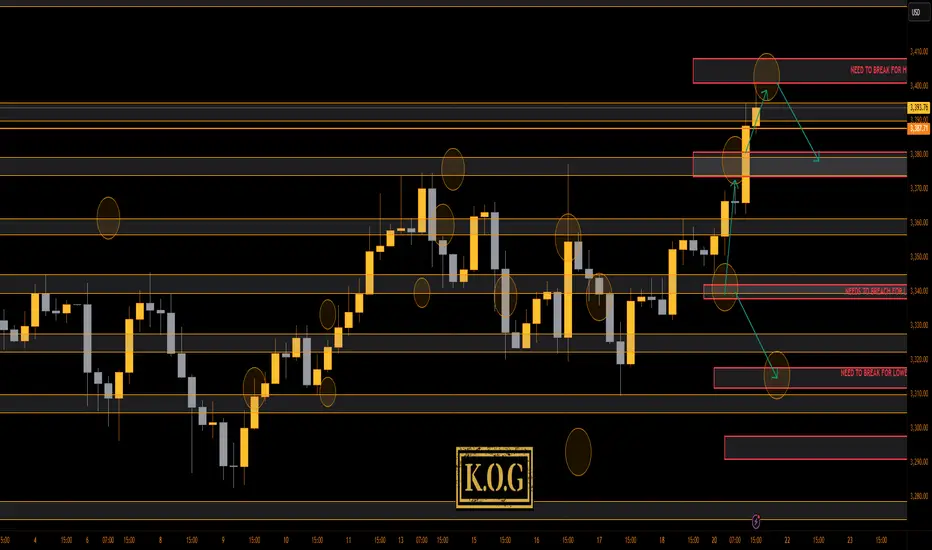
THE KOG REPORT - UpdateEnd of day update from us here at KOG:
Interesting open for the week, not just on gold but across the markets! Our plan yesterday in the KOG Report was to look for that lower support level to hold and then not only to target Excalibur which confirmed the move, but also the red box and bias level targets. This worked well and yet again, within a day, we've completed the week's targets upside!
We couldn't short from the first red box as it was broken. Now we have the red box above which is holding and giving a slight move downside and with the indicators flashing red, we'll stick with the move so far initially looking for 3390-85. We're not discounting a retest of the level, but as long as it holds, we'll go with it.
KOG’s Bias for the week:
Bullish above 3340 with targets above 3355✅, 3361✅, 3368✅, 3372✅ and above that 3385✅
Bearish below 3340 with targets below 3335, 3330, 3322, 3316, 3310 and below that 3304
RED BOX TARGETS:
Break above 3350 for 3355✅, 3361✅, 3367✅, 3375✅ and 3390✅ in extension of the move
Break below 3340 for 3335, 3330, 3320, 3310 and 3306 in extension of the move
Please do support us by hitting the like button, leaving a comment, and giving us a follow. We’ve been doing this for a long time now providing traders with in-depth free analysis on Gold, so your likes and comments are very much appreciated.
As always, trade safe.
KOG
Japanese Candlestick Cheat Sheet – Part OneSingle-Candle Formations That Speak
Before you dream of profits, learn the one language that never lies: price.
Indicators are just subtitles — price is the voice.
Japanese candlesticks are more than just red and green bars — they reflect emotion, pressure, and intention within the market.
This series will walk you through the real psychology behind candlestick patterns — starting here, with the most essential:
🕯️ Single-candle formations — the quiet signals that often appear before big moves happen.
If you can’t read a doji, you’re not ready to understand the market’s hesitation.
If you ignore a hammer, you’ll miss the moment sentiment shifts.
Let’s start simple. Let’s start strong.
This is Part One of a five-part series designed to build your candlestick fluency from the ground up.
1. DOJI
Bias: Neutral
What is the Doji pattern?
The Doji candlestick pattern forms when a candle’s open and close prices are nearly identical, resulting in a small or nonexistent body with wicks on both sides. This pattern reflects market equilibrium, where neither buyers nor sellers dominate. Dojis often appear at trend ends, signaling potential reversals or pauses.
As a fundamental tool in technical analysis, Dojis help traders gauge the psychological battle between buyers and sellers. Proper interpretation requires context and experience, especially for spotting trend shifts.
Meaning:
Indicates market indecision or balance. Found during trends and may signal a reversal or continuation based on context.
LONG-LEGGED DOJI
Bias: Neutral
What is the Long-Legged Doji pattern?
The Long-Legged Doji captures a moment of intense uncertainty and volatility in the market. Its long wicks represent significant movement on both sides, suggesting that neither buyers nor sellers have control. This back-and-forth reflects the psychology of market participants wrestling for control, which often foreshadows a shift in sentiment. When traders see a Long-Legged Doji, it highlights the need to monitor for potential changes in direction.
They can appear within trends, at potential reversal points, or at consolidation zones. When they form at the end of an uptrend or downtrend, they often signal that the current trend may be losing momentum.
Meaning:
The prominent wicks indicate volatility. Buyers and sellers pushed prices in opposite directions throughout the session, ultimately reaching an indecisive close.
SPINNING TOP
Bias: Neutral
What is the Spinning Top pattern?
A Spinning Top is a candlestick with a small body and long upper and lower wicks, indicating that the market has fluctuated significantly but ultimately closed near its opening price. This pattern often points to a moment of indecision, where both buyers and sellers are active but neither dominates. Spinning Tops are commonly found within both uptrends and downtrends and can suggest that a trend is losing momentum.
For traders, a Spinning Top provides a valuable insight into market psychology, as it hints that the prevailing sentiment may be weakening. While Spinning Tops alone aren’t always definitive, they can serve as a precursor to larger moves if the following candles confirm a shift in sentiment.
Meaning:
Shows indecision between buyers and sellers. Common in both up and downtrends; signals potential reversal or pause.
HAMMER
Bias: Bullish
What is the Hammer pattern?
A Hammer candlestick appears at the end of a downtrend, with a small body and a long lower wick. This shape reflects a moment when sellers pushed prices lower, but buyers managed to absorb the selling pressure and drive prices back up before the close. This pattern is particularly important for spotting potential reversals, as it indicates that buyers are beginning to reassert control.
Hammers reveal the underlying psychology of a market where buying confidence is emerging, even if sellers have dominated for a while. To successfully trade this pattern, it’s essential to confirm the reversal with subsequent candles.
Meaning:
Showing rejection of lower prices. Signals potential bullish reversal, especially if followed by strong buying candles.
INVERTED HAMMER
Bias: Bullish
What is the Inverted Hammer pattern?
The Inverted Hammer forms at the bottom of a downtrend, with a small body and long upper wick. This pattern shows that buyers attempted to push prices higher, but sellers ultimately brought them back down by the close. The Inverted Hammer is an early sign of buyer interest, hinting that a trend reversal may be underway if subsequent candles confirm the shift.
Interpreting the Inverted Hammer helps traders understand where sentiment may be shifting from bearish to bullish, often marking the beginning of a recovery. Recognizing these patterns takes practice and familiarity with market conditions.
Meaning:
Showing rejection of higher prices. Can signal bullish reversal if confirmed by subsequent buying pressure.
DRAGONFLY DOJI
Bias: Bullish
What is the Dragonfly Doji pattern?
The Dragonfly Doji has a long lower wick and no upper wick, forming in downtrends to signal potential bullish reversal. This pattern reveals that sellers were initially in control, pushing prices lower, but buyers stepped in to push prices back up to the opening level. The Dragonfly Doji’s unique shape signifies that strong buying support exists at the lower price level, hinting at an impending reversal.
Recognizing the psychology behind a Dragonfly Doji can enhance a trader’s ability to anticipate trend changes, especially in markets where support levels are being tested.
Meaning:
Found in downtrends; suggests possible bullish reversal if confirmed by a strong upward move.
BULLISH MARUBOZU
Bias: Bullish
What is the Bullish Marubozu pattern?
The Bullish Marubozu is a large, solid candle with no wicks, indicating that buyers were in complete control throughout the session. This pattern appears in uptrends, where it signals strong buying momentum and often foreshadows continued upward movement. The absence of wicks reveals that prices consistently moved higher, with little resistance from sellers.
For traders, the Bullish Marubozu offers a glimpse into market psychology, highlighting moments when buyer sentiment is particularly strong. Learning to identify these periods of intense momentum is crucial for trading success.
Meaning:
Showing complete buying control. Found in uptrends or at reversal points; indicates strong buying pressure and likely continuation of the trend.
SHOOTING STAR
Bias: Bearish
What is the Shooting Star pattern?
The Shooting Star appears at the top of an uptrend, characterized by a small body and a long upper wick, indicating a potential bearish reversal. Buyers initially drove prices higher, but sellers took over, bringing prices back down near the open. This shift suggests that buyers may be losing control, and a reversal could be imminent.
Interpreting the Shooting Star gives traders valuable insights into moments when optimism begins to fade, providing clues about a potential trend shift.
Meaning:
Indicating rejection of higher prices. Signals a potential bearish reversal if followed by selling pressure.
HANGING MAN
Bias: Bearish
W hat is the Hanging Man pattern?
The Hanging Man candle forms at the top of an uptrend, with a small body and long lower wick. This pattern suggests that sellers attempted to drive prices down, but buyers regained control. However, the presence of a long lower shadow hints that sellers may be gaining strength, potentially signaling a bearish reversal.
The Hanging Man pattern reflects market psychology where buyers might be overextended, making it a valuable tool for identifying potential tops in trends.
Meaning:
Signals potential bearish reversal if confirmed by selling candles afterward.
GRAVESTONE DOJI
Bias: Bearish
What is the Gravestone Doji pattern?
With a long upper wick and no lower wick, the Gravestone Doji reveals that buyers pushed prices up, but sellers eventually regained control. Found in uptrends, it suggests that a bearish reversal could be near, as the upper shadow indicates buyer exhaustion. The Gravestone Doji often appears at market tops, making it a valuable indicator for those looking to anticipate shifts.
Understanding the psychology behind this pattern helps traders make informed decisions, especially in markets prone to overbought conditions.
Meaning:
Showing rejection of higher prices. Found in uptrends; signals potential bearish reversal if followed by selling activity.
BEARISH MARUBOZU
Bias: Bearish
What is the Bearish Marubozu pattern?
The Bearish Marubozu is a large, solid bearish candle without wicks, showing that sellers held control throughout the session. Found in downtrends, it signals strong bearish sentiment and suggests that the trend is likely to continue. The lack of wicks reflects consistent downward momentum without significant buyer support.
This pattern speaks about market psychology, offering traders insights into moments of intense selling pressure. Recognizing the Bearish Marubozu can help you align with prevailing trends and avoid buying into weakening markets
Meaning:
Showing strong selling pressure. Found in downtrends; signals continuation of the bearish trend or an intensifying sell-off.
👉 Up next: Double-candle formations – where price meets reaction.
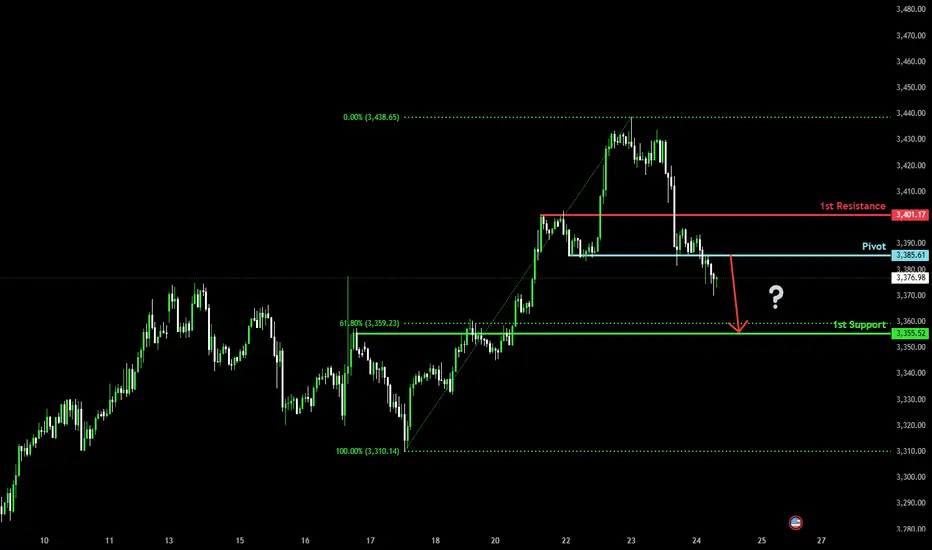
Bearish drop?The Gold (XAU/USD) has reacted off the pivot and could potentially drop to the 1st support, which is a pullback support that is slightly below the 61.8% Fibonacci retracement.
Pivot: 3,385.61
1st Support: 3,355.52
1st Resistance: 3,401.17
Risk Warning:
Trading Forex and CFDs carries a high level of risk to your capital and you should only trade with money you can afford to lose. Trading Forex and CFDs may not be suitable for all investors, so please ensure that you fully understand the risks involved and seek independent advice if necessary.
Disclaimer:
The above opinions given constitute general market commentary, and do not constitute the opinion or advice of IC Markets or any form of personal or investment advice.
Any opinions, news, research, analyses, prices, other information, or links to third-party sites contained on this website are provided on an "as-is" basis, are intended only to be informative, is not an advice nor a recommendation, nor research, or a record of our trading prices, or an offer of, or solicitation for a transaction in any financial instrument and thus should not be treated as such. The information provided does not involve any specific investment objectives, financial situation and needs of any specific person who may receive it. Please be aware, that past performance is not a reliable indicator of future performance and/or results. Past Performance or Forward-looking scenarios based upon the reasonable beliefs of the third-party provider are not a guarantee of future performance. Actual results may differ materially from those anticipated in forward-looking or past performance statements. IC Markets makes no representation or warranty and assumes no liability as to the accuracy or completeness of the information provided, nor any loss arising from any investment based on a recommendation, forecast or any information supplied by any third-party.
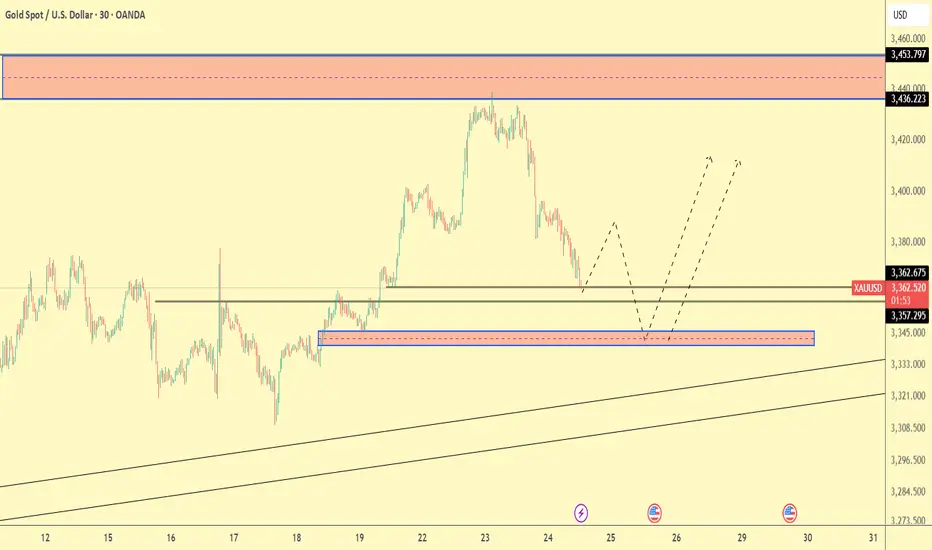
Gold sets sights on 3,500 USD – will the rally continue?Hello traders, do you think gold will keep rising?
Today, OANDA:XAUUSD is trading around 3,380 USD after a slight pullback from the 5-week high of 3,438 USD reached on Tuesday. Despite this short-term dip, the overall trend remains bullish, supported by both technical structures and market expectations.
On the news front, the US Dollar Index (DXY) has dropped to 97.4 – its lowest level in weeks. This reflects growing expectations that the Federal Reserve may cut interest rates by the end of the year, as recent data points to slowing inflation and weakening consumer spending. A softer dollar typically strengthens gold’s appeal.
From a technical perspective, the daily chart reveals a clear bullish structure supported by the rising trendline and the EMA34 and EMA89. Price is consolidating just above the trendline, forming a potential bullish continuation pattern. The resistance zone near 3,440 USD is being repeatedly tested – and if gold breaks out with strong volume, the path toward 3,500 USD could open up quickly.
From my perspective, I expect gold to make new highs above this level soon. What’s your take? Drop your thoughts in the comments!

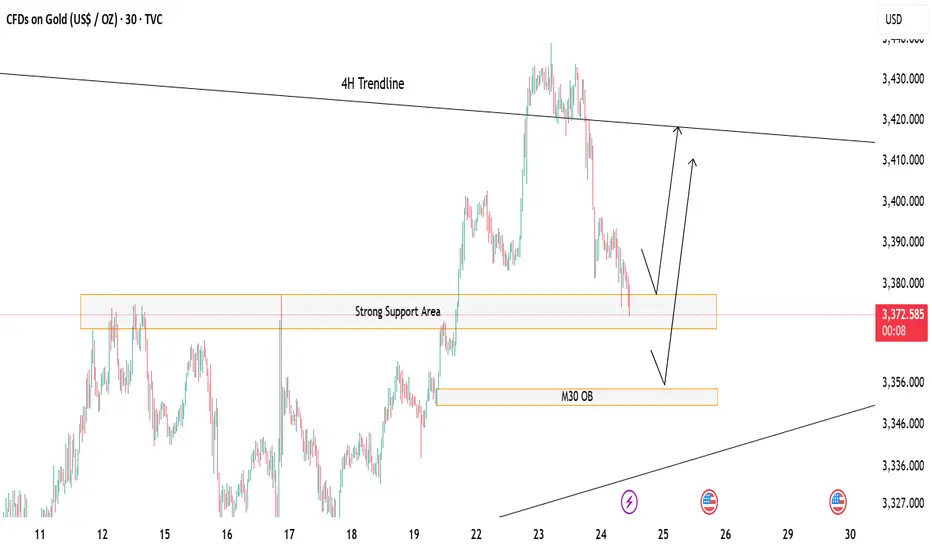
Gold at Key Decision Zone – Bounce or Break?Price is currently hovering above a strong support zone, showing potential for a short-term bounce. 🔁
If this zone holds, we could see a bullish reaction toward the 4H trendline resistance above. 📈
However, a break below may lead price to drop and tap into the M30 Order Block (OB) for a deeper mitigation before any move up. ⚠️
If this happen we could look for potential sell till the OB test otherwise the buying opportunity should focused more
🎯 Watch these key zones carefully – market is at a decision point!
Both buy and sell setups possible depending on how price reacts at these levels.
Gold Trade Plan 24/07/2025Dear Traders,
The price is currently near the demand zone in the range of 3358-3362. If the price holds above the support line, it could rise towards the 3388-3390 zone and then enter a correction again. However, if the 3362-3358 zone is broken, I expect a drop towards around 3350, followed by a potential rise towards the 3400 zone.
regards,
Alireza!
Gold 22 July 2025 updateGood afternoon, update to last week's post of 21 July on gold, which worked yesterday, new zone to buy, the chart shows everything in detail, so today with the message "brevity is the sister of talent"
#GOLD
BUY LIMIT ZONE 3365-3370
🎯 TP1: 3385
🎯 TP2: 3400
🎯 TP3: 3412
🎯 TP3: 3428
⛔️ Stop loss: 3355
Regards, Totoshka™

NordKern - XAUUSD InsightNordKern | Simplified Insight OANDA:XAUUSD – Short Opportunity Ahead
Gold is now near our important level at 3370, offering a shorting opportunity considering recent events and technical action.
Gold Price Decline – What's Behind It?
In the last two sessions (July 23–24), gold has retreated strongly owing to a set of global as well as market-specific circumstances:
1. Trade Deal Optimism
Advances in U.S.–Japan and U.S.–EU trade discussions lessened worldwide uncertainty, decreasing demand for gold as a safe-haven.
2. Higher U.S. Yields
Higher Treasury yields are rendering non-yielding assets such as gold less appealing, adding to downward pressure.
3. Technical & Profit-Taking
Following a recent rally, gold was exposed to selling. Stop-loss and profit-taking triggers hastened the fall.
Summary of Key Drivers
U.S. Trade Deals: Reduced geopolitical risk
Higher Treasury Yields: Decreased gold's relative attractiveness
Technical Selling: Enhanced the downward trend
Trade Setup – Bearish Bias
Entry : 3374.4
Stop Loss : 3387.3
Take Profit : 3345.4
Extended Target : 3322
Key Notes:
- Trade Deal Optimism: U.S.–Japan and U.S.–EU agreements eased global tensions, reducing demand for gold as a safe-haven asset.
- Yield Pressure: Rising U.S. Treasury yields made gold less attractive compared to interest-bearing alternatives.
- Technical Selling: Profit-taking and stop-loss triggers accelerated the decline after gold’s recent rally.
This setup remains tactically driven. Manage risk carefully and monitor for any renewed political shifts.
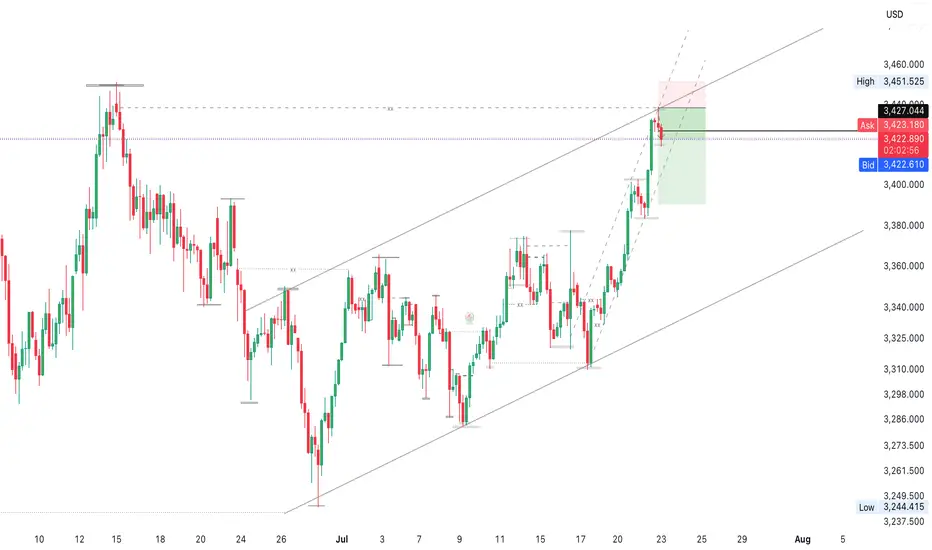
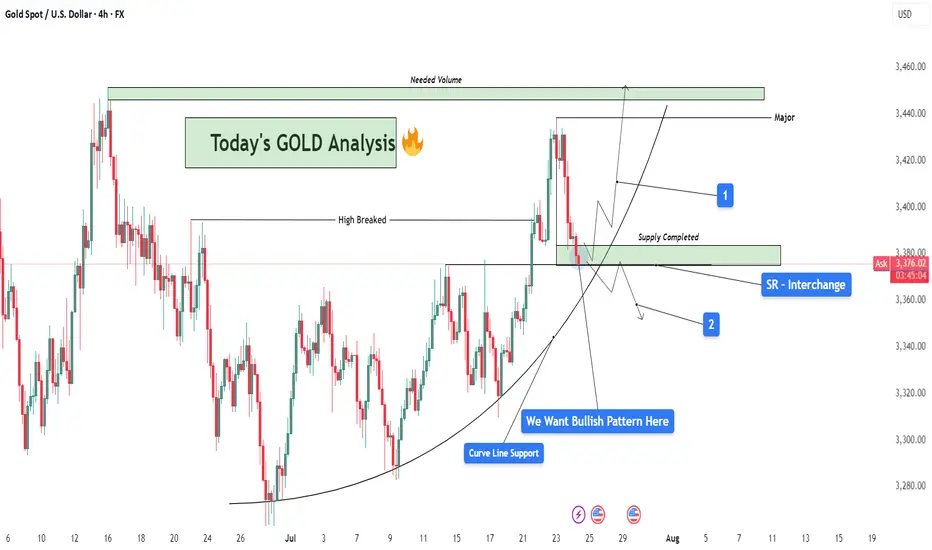
GOLD Analysis : SR Interchange , Reversal Zone + High Break🧠 Market Context & Structural Overview:
Gold has been trading within a clearly defined bullish structure after forming a rounded base pattern in early July, indicating accumulation by smart money. The market recently broke through a key horizontal resistance (previous swing high), marking a potential bullish continuation phase. However, we are now witnessing a pullback — a healthy corrective phase — that is currently testing multiple high-probability confluences.
🧱 Key Technical Zones Explained:
🔹 1. SR Interchange Zone – High Probability Reversal Area:
This area (roughly between $3,360 and $3,380) acted as previous resistance (supply) and has now flipped into support.
This is a textbook Support-Resistance Interchange (SR Flip) — a concept where prior resistance becomes new support.
Traders often look for entries here, especially when it aligns with other technical factors.
🔹 2. Curve Line Support – Dynamic Buyer Strength Indicator:
A curved trendline, often referred to as a parabolic support, has been respecting price structure for over two weeks.
Price is now sitting exactly on this support, signaling potential for another impulsive bullish leg if momentum builds.
🔹 3. Supply Zone Completed – Correction Phase Active:
The supply zone above (approx. $3,420–$3,440) has already been tapped and respected by the market.
This “completed” supply may now act as resistance unless broken with strong volume — we now watch how price reacts at the current pullback zone.
📊 What the Candles Are Telling Us:
The latest candles show some hesitation from sellers — wick rejections and smaller body candles hint at buyer interest at this level. However, confirmation is crucial. We want to see a bullish reversal pattern such as:
Bullish engulfing
Morning star
Pin bar (hammer)
Break and retest of minor resistance inside the SR zone
🔮 Scenarios to Watch:
✅ Scenario 1 – Bullish Continuation (Ideal Setup):
If a bullish reversal forms at this support zone:
Expect a potential rally back to the $3,420–$3,440 resistance area.
If this zone breaks with high volume, price could target the major supply zone near $3,465+, where we’ll need “Needed Volume” for a decisive break.
⚠️ Scenario 2 – Bearish Breakdown (Alternative View):
If the curve support and SR zone fail to hold:
Expect a drop towards $3,345 – $3,320 — where next structural support lies.
This would suggest a deeper retracement or range formation before bulls can regroup.
🧩 Strategy & Psychology:
“We want bullish pattern here.”
You’ve highlighted the importance of not entering impulsively. This is about trading with confirmation, not prediction. Waiting for a valid bullish pattern reduces risk and increases probability.
This is where smart traders win — waiting patiently for confirmation at a zone of confluence.
🧠 Learning Mindset – Why This Zone Matters:
Combines horizontal support, curved trendline, and broken structure retest.
This zone is the battleground between bulls and bears — whoever wins here will likely control short-term momentum.
Newer traders can study this as a classic example of multi-confluence trading, which combines price action, market structure, and dynamic trendlines.
XAUUSD--SHORT--second shoulder of "head and shoulder" pattern is about to form.
--next week, pullback to near to crossection point o two orange line, between levels 3369 and 3355
--then downward movement to the level 3283

Gold Sell 4hGold ready to sell ... See 4 Hour timeframe to get entry with your own confirmations..get partial entries with your confirmations.. check the fundamental analysis too
Gold Next Move According To My Analysis (READ DESCRIPTION).Hellow Traders, I'm here with new idea.
The Previous Major Highs and Lows
price (3125) Major Low
Price (3449) Major High
Price (3253) Major Low
Price (3432) Major High
The market rejects four times at the price (3436) according to D1 TF. when the market touches the area (3436) then falling again and again so it couldn't break.
Now the price respects the demand zone M30, It will give you few pips, after a little pump gold will drop if price respects the bearish engulfing H1 at 3420-3432. Now the trend is bullish it will change if price breaks the Trendline and 3253 area then our target will be 3129.
If price breaks the area 3432 then we will change our gear into buy because when the price breaks the supply zone it will be {BOS} and RBS.
STAY TUNE FOR UPDATE
KINDLY SHARE YOUR IDEAS HERE AND LEAVE POSSITIVE COMMENTS, THANKS EVERYBODY.

BUY XAUUSD 24.7.2025Counter-trend trade order: SELL at H4~H1~M15
Type of entry: Limit order
Reason:
- If the price breakout at 3,391 confirming the uptrend.
Note:
- Management of money carefully at the price of last top (3,390)
Set up entry:
- Entry sell at 3,383
- SL at 3,379
- TP1: 3,390
- TP2: 3,400
Trading Method: Price action (No indicator, only trend and candles)

Simple Swing Trading Strategy with Smart Money Concept Explained
I will share with you the essential basics of swing trading forex gold with Smart Money Concepts.
You will learn how to do swing trading with the best SMC strategy.
I will teach you to c ombine order blocks, liquidity zones and imbalances to spot accurate entries and confirmation signals.
If you just started learning swing trading Forex with Smart Money Concepts, I strictly recommend trading with the trend only.
The cases and examples that we will discuss will be strictly trend-following ones.
Swing Trading with SMC in Uptrend
For swing buying any forex pair, we will look for the market that is trading in a bullish trend.
To confirm that the market is rising, you will need to execute structure mapping and find a forex pair that updates Higher Highs HH and Higher Lows HL.
Above is the example how I confirmed that GBPUSD is bullish with structure mapping. You can see that the pair consistently updates the highs.
Once you identified a bullish pair, your next step will be to find the zone from where the next swing move will follow.
According to the rules, the market remains in uptrend till the price is staying above or on the level of the last Higher Low HL.
Here is such a zone on GBPUSD.
It is based on the last Higher Low and current price levels.
We will assume that buying orders will concentrate within that area and from that a bullish rally will follow.
The problem is that this area is extremely wide, and we can not just buy randomly within.
Our next step will be to find liquidity zones within.
To buy, we need demand areas.
I found 4 price action based historic demand zones on GBPUSD.
We will need to wait for the test of one of these zones and then wait for an order block - a place where smart money are placing their buy orders.
The problem is that we don't know in which of these areas the order block is, so we will need to wait for tests of these zones and a consequent imbalance to confirm it.
To confirm a bullish imbalance for swing trading Forex, I recommend analyzing a 4H time frame after a test of a demand zone.
According to Smart Money Concepts, a bullish imbalance can be any sign of strength of the buyers : bullish breakout of a vertical/horizontal resistance, change of character, high momentum bullish candle, bullish price action pattern, etc.
An order block on GBPUSD was confirmed with a breakout of a resistance line of a falling channel on a 4H time frame.
That was the signal that Smart Money are buying, and that is your signal to open a swing long trade.
You place a buy position then with a stop loss below the order block and a target - at least a current high.
Swing Trading with SMC in Downtrend
For swing selling any forex pair, you will need to find a market that is trading in a bearish trend.
I suggest applying structure mapping to identify such a pair.
It simply should update Lower Lows LL and Lower Highs consistently.
USDCAD is trading in a bearish trend.
Structure mapping helps to easily confirm that.
Then, we will need to identify the zone from where the next bearish wave will start.
According to Smart Money Concepts structure mapping rules, the market remains bearish till the price is staying below or on the level of the last Lower High LH.
That's such a zone on USDCAD.
It is based on current prices and the last Lower High.
We will assume that selling orders will be distributed along the entire lenth of our zone.
Of course, we can not sell randomly within that zone because it is relatively extended.
Our next task will be to find liquidity supply zones within.
I found 2 price action based supply zones within our underlined area.
Before we sell, we will need to find an order block.
A place from where smart money are selling big.
To spot that, I suggest waiting for a test of one of our supply zones and wait for a bearish imbalance on a 4H time frame.
According to SMC, a bearish imbalance can be a bearish high momentum candle, a bearish CHoCH, a bearish price action pattern, a bearish breakout of a horizontal/vertical support , etc.
You can see that a lower supply zone was tested on USDCAD.
Our bearish order block confirmation is a bearish Change of Character, a formation of a high momentum bearish candle and a breakout of a rising trend line.
After that we can open a swing sell position and expect a bearish movement at least to a current low.
Stop loss should lie strictly above the order block.
TP should be at least a c urrent low.
That is how a trade should be executed on USDCAD pair.
Remember that there is no guarantee that the order block will be within a liquidity zone. You should learn to track the signs of smart money and their operations.
A proper combination of a trend analysis, liquidity zones and order block is the essential basis of a profitable swing trading Forex.
Mastering that, practice recognizing the imbalances and confirmations for spotting the best swing trading entries.
❤️Please, support my work with like, thank you!❤️
I am part of Trade Nation's Influencer program and receive a monthly fee for using their TradingView charts in my analysis.
XAUUSD I Potential Pullback and More GrowthWelcome back! Let me know your thoughts in the comments!
** XAUUSD Analysis - Listen to video!
We recommend that you keep this on your watchlist and enter when the entry criteria of your strategy is met.
Please support this idea with a LIKE and COMMENT if you find it useful and Click "Follow" on our profile if you'd like these trade ideas delivered straight to your email in the future.
Thanks for your continued support!

XAU/USD – Elliott Wave Update | Wave (2) in Progress)OANDA:XAUUSD
🔍 Wave Structure Overview
We’re currently in a
Prior impulse (likely 1-2-3-4-5) completed, forming (Circle) wave ①
Current correction unfolding as (A)-(B)-(C) in yellow
↳ Presently in wave (A) or transitioning into (B)
↳ Within (B), structure is forming as A-B-C
↳ Currently tracking 5-wave move from 4 to 5
📐 Fibonacci & Key Levels
Watching 61.8% retracement as a critical support zone ✅
This level also marks a high-probability TP area for short positions
Strong confluence:
🔹 Fibonacci retracement
🔹 Extension alignment (e.g. yellow fib extension to ~4403)
🔹 Trendline reaction expected
🧠 Trade Setup (Scenario-Based)
🔸 Scenario A – Early Entry:
Enter small long near 61.8% Fib zone
SL: Below last swing low
TP: To be refined once C-wave completes
🔸 Scenario B – Confirmation Entry:
Wait for break above red trendline
Add position
SL below Fib zone low
TP around Fibonacci extension / structure resistance (~4403)
⚠️ Key Considerations
Many positions will close in this zone → increase in selling pressure
Possible reversal zone → watch for confirmation (impulse or ABC)
Once wave (C) completes, we’ll likely see entry into a larger bearish move
📎 Conclusion
This is a high-probability reversal zone, supported by Elliott structure and Fib levels. I’m planning to scale in based on price action and confirmation.
📈 Stay flexible, manage risk, and watch the structure evolve.

GOLD LOCAL LONG|
✅GOLD went down from
The resistance just as I predicted
But a strong support level is ahead at 3380$
Thus I am expecting a rebound
And a move up towards the target of 3400$
LONG🚀
✅Like and subscribe to never miss a new idea!✅
Disclosure: I am part of Trade Nation's Influencer program and receive a monthly fee for using their TradingView charts in my analysis.

$XAUUSD: Macro InterconnectionsResearch Notes
Linking historic surface area and coordinates of consistent geometric expressions to document and learn more about the "texture" of self-organizing processes. The topology assumes that current price is a result of all history together that took to make the price end up where it is.
The fastest shortcut to figure out fractal hierarchy of waves and general direction is through Fractal wave marker .
Since angle of highs cycle is broken and price stayed above it for long time. That means it would be better to strip the chart starting from the lower levels, in order to get better coordinates for structural basis.
FWM helps to spot that distinctive part of broken waves that enables visual orientation in the rhythm. They manifest in its closest formative across cycles.
The angle that links the pattern through the time can have deterministic property, therefore we can use that direction for fibonacci channels to fill the gaps.
The fact that on log scale the bits from bullish phase of cycles contracted on price scale, I'd orientate with thin fibonacci channels (that is based on angle of lows of macro-cycle applied to previous ATH.
There are some other interconnection that are being tested.
