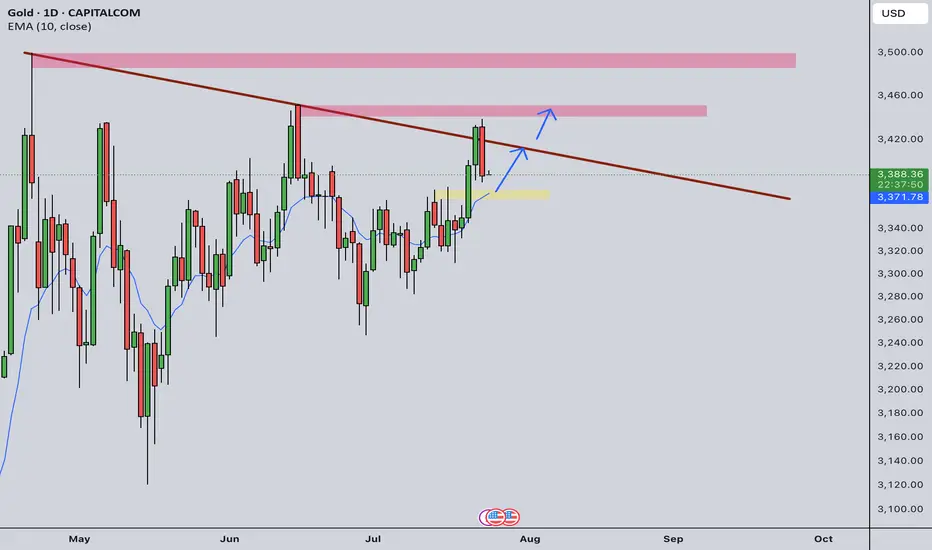
XAUUSD buy when touched the black trendlinethis is a high possible scenario which means the Gold will still be on a bullish cycle
GOLDCFD trade ideas

Continued price increase - gold increased to 3450⭐️GOLDEN INFORMATION:
Gold prices climbed for a second straight session on Tuesday, gaining over 0.9% as sliding US Treasury yields continued to weigh on the US Dollar. Investors remained cautious amid lingering uncertainty over upcoming US trade agreements. At the time of writing, XAU/USD is trading at $3,427, having rebounded from an intraday low of $3,383.
Yields on US government bonds have now declined for five consecutive days, pressuring the Greenback—reflected in the softer US Dollar Index (DXY). Heightened speculation that the US and European Union (EU) may fail to secure a trade agreement before the looming August 1 deadline has intensified demand for safe-haven assets. As a result, gold surged to a five-week high of $3,433.
⭐️Personal comments NOVA:
Gold price continues to increase, FOMO from the market is good and positive. Heading towards 3450
⭐️SET UP GOLD PRICE:
🔥SELL GOLD zone: 3449- 3451 SL 3456
TP1: $3435
TP2: $3422
TP3: $3405
🔥BUY GOLD zone: $3380-$3378 SL $3373
TP1: $3390
TP2: $3400
TP3: $3415
⭐️Technical analysis:
Based on technical indicators EMA 34, EMA89 and support resistance areas to set up a reasonable BUY order.
⭐️NOTE:
Note: Nova wishes traders to manage their capital well
- take the number of lots that match your capital
- Takeprofit equal to 4-6% of capital account
- Stoplose equal to 2-3% of capital account

xauusdxauusd sell 3432 Gold is in an ascending channel. I think it could pull back from these areas. We need to see how the next 4-hour candle will close.

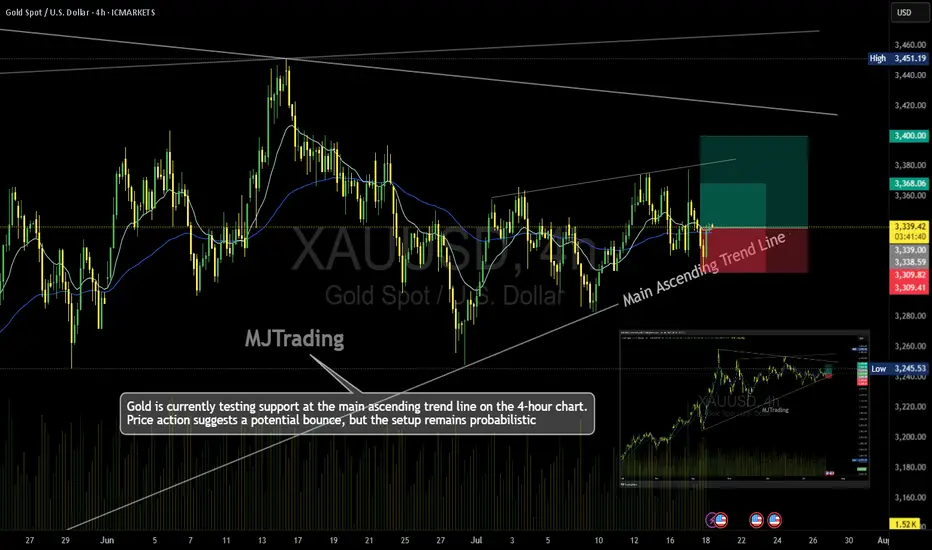
Gold (XAU/USD) – 4H Time Frame Trade Idea📈MJTrading:
Gold is currently testing support at the main ascending trend line on the 4-hour chart. Price action suggests a potential bounce, but the setup remains probabilistic—ideal for traders who operate on higher time frames and manage risk with discipline.
🔹 Trade Setup
Entry: 3340
Stop Loss: 3309
Take Profit 1: 3368
Take Profit 2: 3400
🔍 Technical Context
Price is respecting the long-standing trend line, hinting at bullish continuation.
Risk-reward ratio is favorable, especially for swing traders.
A break below the trend line invalidates the setup—hence the tight SL.
⚠️ Note: While the trend supports upside potential, failure to hold the trend line could trigger deeper retracement. Trade the probabilities, not the certainties.
In case it's not shown properly on your monitor because of different resolutions:
Psychology Always Maters:
#MJTrading #Gold #XAUUSD #Trend #Trendline #Forex #Chart #ChartAnalysis #Buy #Long
GOLD - SHORT TO $2,880 (UPDATE)Gold sellers have now pushed down to where price opened on Monday, turning the weekly candle bearish. A huge move down, compared to where price was at on Tuesday high!
R.I.P to those who bought the top. But this is what happens when you trade without a strategy or guidance⚰️

Current Gold Short tradeI'm currently trading gold short from 3430. I have taken partials and my SL are at BE.
Here we have 2 scenarios at Support.
Heavy volume selloff means there’s fuel for more downside.
If price consolidates here and keeps making lower highs, or retests 3,376 from below and rejects, that’s a short re-entry/continuation signal.
Odds:
Much higher at the moment. The last impulse was violent, and buyers have not stepped up yet.
If 3,372 breaks—look to short the retest (classic SR flip) for a move to 3,348 and below.
If you see a slow grind sideways (chop), walk away and wait for the breakout from this zone.
3,376–3,372 Do not long unless reversal candle forms High risk to knife-catch
<3,372 Look for shorts on retest Downside opens up fast
3,389+ Bullish confirmation only Only chase if true reversal

From 3,430 USD GOLD falls below 3,400 USD on optimistic newsOANDA:XAUUSD has suffered a sharp sell-off after rising sharply earlier in the week. Media reports said the United States and the European Union were getting closer to reaching a tariff deal, and the news weighed on safe-haven demand.
OANDA:XAUUSD fell below $3,400 an ounce on Wednesday, down more than 1.2%, following news that the United States and the European Union were close to signing a deal similar to the one Washington and Tokyo signed on Tuesday. It is now trading below that key base point.
The European Union and the United States are moving toward a trade deal that could see more EU goods hit with a 15 percent U.S. import tariff, two diplomats said. Earlier, U.S. President Donald Trump reached a trade deal with Japan that would cut auto tariffs to 15 percent.
Optimism about an imminent U.S.-EU trade deal overshadowed a decline in the U.S. dollar. The U.S. dollar index (DXY), which measures the greenback against a basket of six currencies, fell 0.05 percent on the day to 97.160.
U.S. Treasury yields rose, with the 10-year Treasury yield rising to 4.396%. U.S. real yields, calculated by subtracting inflation expectations from nominal yields, rose nearly 4 basis points to 1.994%.
Gold tends to gain in value during times of uncertainty and low-interest-rate environments because gold itself does not generate interest, and in low-interest-rate environments, the opportunity cost of holding gold is relatively low.
U.S., EU near trade deal
The Financial Times reported on Wednesday that the European Union and the United States are close to reaching a trade deal that would impose a 15% tariff on imports from Europe, similar to the one reached between US President Donald Trump and Japan this week.
The Financial Times reported that Brussels is likely to agree to so-called “reciprocal tariffs” to avoid tariffs that Trump has threatened to impose on EU goods of up to 30% from August 1.
“The agreement reached with Japan is clearly extortionate in terms. Most member states are swallowing their anger and are likely to accept the deal,” an EU diplomat said.
The two sides will exempt some products, including aircraft, spirits and medical equipment, from tariffs.
The agreement between the US and Japan has also left Brussels reluctant to accept higher reciprocal tariffs to avoid a damaging trade war, according to the Financial Times.
Technical Outlook Analysis OANDA:XAUUSD
On the daily chart, after gold reached its target at $3,430, it failed to break above this important resistance level and fell slightly. The decline brought gold back to test the support confluence area, which is the location of the 0.236% Fibonacci retracement with the lower edge of the price channel. And with the current position, gold still technically has enough conditions for a possible increase in price.
Specifically, gold is still in/above the supports from the short-term price channel, the long-term rising price channel and the support from the EMA21, as long as gold is still trading above the EMA21, it still has a bullish outlook in the short term. On the other hand, the short-term target is still at 3,430 USD, while once the 3,430 USD level is broken, it will provide the possibility of further upside with the next target at around 3,450 USD in the short term, more than the all-time high.
RSI remains above 50, far from the 80 – 100 area (overbought area). Showing that there is still a lot of room for upside ahead.
During the day, the technical outlook for gold prices continues to favor upside and notable positions will be listed as follows.
Support: 3,371 – 3,350 USD
Resistance: 3,400 – 3,430 – 3,450 USD
SELL XAUUSD PRICE 3421 - 3419⚡️
↠↠ Stop Loss 3425
→Take Profit 1 3413
↨
→Take Profit 2 3407
BUY XAUUSD PRICE 3354 - 3356⚡️
↠↠ Stop Loss 3350
→Take Profit 1 3362
↨
→Take Profit 2 3368
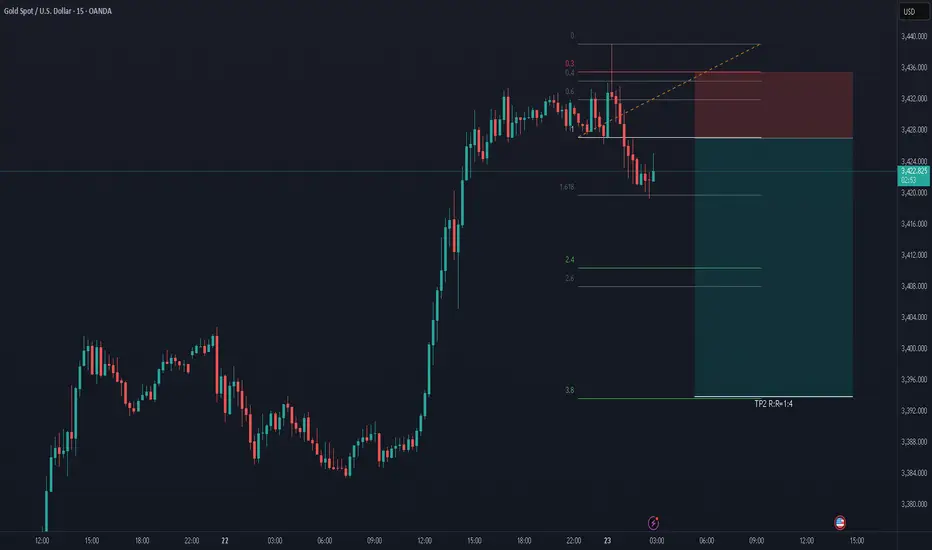
Perfect Long Opportunity on Gold? Fibonacci & Price Action AlignThis is a 15-minute chart of Gold (XAU/USD) from TradingView (via Capital.com) with Fibonacci retracement levels and a long trade setup.
Chart Summary:
Timeframe: 15-minute
Instrument: Gold (XAU/USD)
Current Price: $3,390.01
Trade Type: Long (Buy) position
Technical Setup:
Fibonacci Retracement Levels:
0.382 at $3,390.44
0.5 at $3,388.69
0.618 at $3,386.95
0.786 at $3,384.46
Entry Area: Around 0.5 to 0.618 levels (~$3,388–$3,386)
Stop-Loss: Below 1.0 level (~$3,381.30)
Target: Just below the 0 Fibonacci level (~$3,396.09)
This setup suggests a potential retracement-based bounce after a significant drop. The trader is betting on a reversal from the Fibonacci support zone with a tight stop below $3,381 and aiming for a recovery up to $3,396.

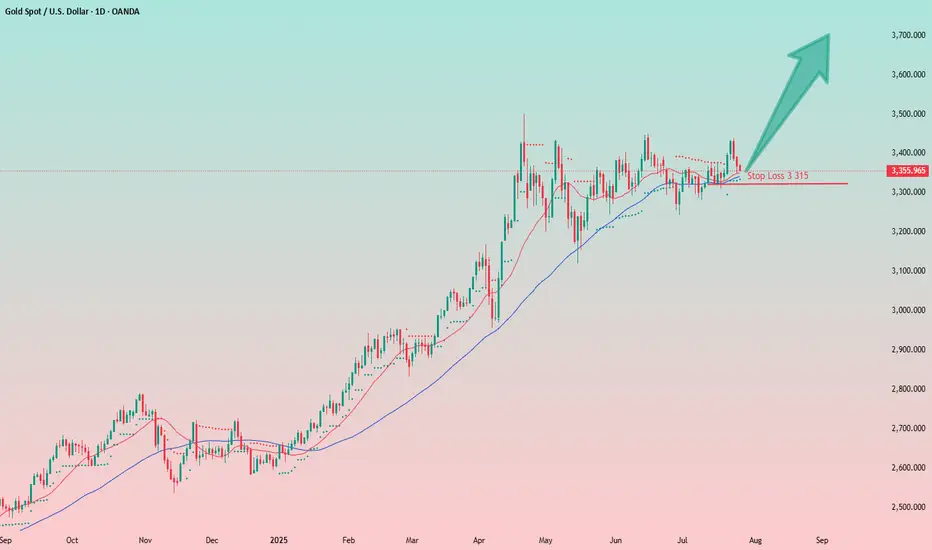
Gold Trade Against the Odds: When Emotion Meets StrategyThis may not be the best decision right now — I understand that — but it's one of those " I'm exhausted and just want to buy " moments.
The setup isn’t fully formed yet, but I have a strong feeling we’re going higher. I like the chart structure: low volatility, a spike to 3430 followed by a pullback to the moving averages without breaking key levels. I also like the tight stop at 1.2%.
I’m buying gold at the current level, around 3355.
📝Trading Plan
Entry: I’m buying gold at the current level, around 3355
Stop Loss: Stop at 3315
Target: 3425, 3500, and beyond.
XAU/USD Elliott Wave Setup : Triangle Ends, Impulse BeginsThe 8-hour XAU/USD chart presents an Elliott Wave structure, currently in the final stages of Wave 4 within a larger impulsive cycle. The complex correction in Wave 4 has unfolded as a WXYXZ (triple-three pattern), forming a contracting triangle (ABCDE) — a classic consolidation phase that typically precedes a sharp impulsive breakout.
Wave E has recently completed near the lower boundary of the triangle, supported by the ascending trendline drawn from the April low. This suggests the correction is mature and Wave 5 is ready to ignite.
Target 1 (T1) : 3434.845
Target 2 (T2) : 3500.535
Stop Loss (SL) : 3309.729
The triangle (Wave 4) breakout structure suggests bullish continuation.
Multiple internal WXY corrective waves have completed, signaling exhaustion.
Volume and candle structure support the possibility of impulsive buying in Wave 5.

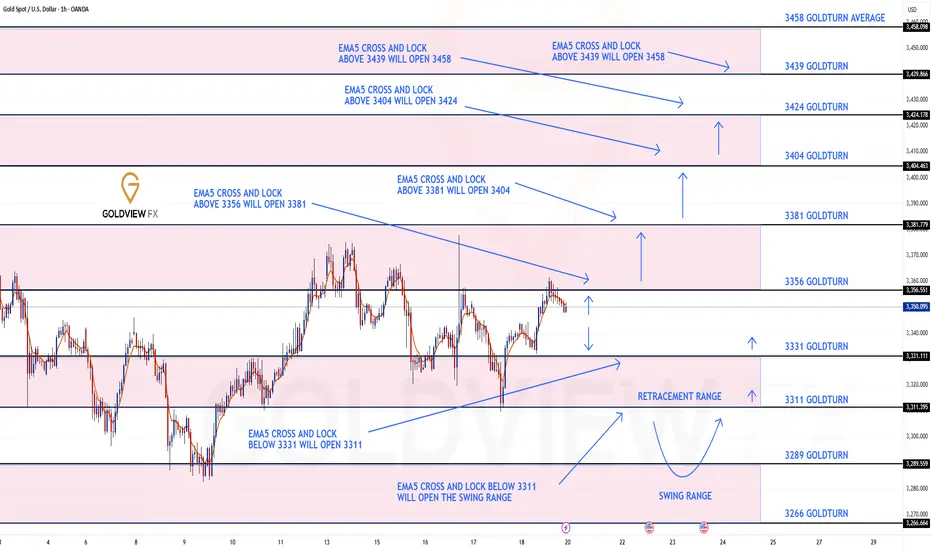
GOLD 1H CHART ROUTE MAP UPDATE & TRADING PLAN FOR THE WEEKHey Everyone,
Please see our updated 1h chart levels and targets for the coming week.
We are seeing price play between two weighted levels with a gap above at 3356 and a gap below at 3331. We will need to see ema5 cross and lock on either weighted level to determine the next range.
We will see levels tested side by side until one of the weighted levels break and lock to confirm direction for the next range.
We will keep the above in mind when taking buys from dips. Our updated levels and weighted levels will allow us to track the movement down and then catch bounces up.
We will continue to buy dips using our support levels taking 20 to 40 pips. As stated before each of our level structures give 20 to 40 pip bounces, which is enough for a nice entry and exit. If you back test the levels we shared every week for the past 24 months, you can see how effectively they were used to trade with or against short/mid term swings and trends.
The swing range give bigger bounces then our weighted levels that's the difference between weighted levels and swing ranges.
BULLISH TARGET
3356
EMA5 CROSS AND LOCK ABOVE 3356 WILL OPEN THE FOLLOWING BULLISH TARGETS
3381
EMA5 CROSS AND LOCK ABOVE 3381 WILL OPEN THE FOLLOWING BULLISH TARGET
3404
EMA5 CROSS AND LOCK ABOVE 3404 WILL OPEN THE FOLLOWING BULLISH TARGET
3424
EMA5 CROSS AND LOCK ABOVE 3424 WILL OPEN THE FOLLOWING BULLISH TARGET
3458
BEARISH TARGETS
3331
EMA5 CROSS AND LOCK BELOW 3331 WILL OPEN THE FOLLOWING BEARISH TARGET
3311
EMA5 CROSS AND LOCK BELOW 3311 WILL OPEN THE SWING RANGE
3289
3266
As always, we will keep you all updated with regular updates throughout the week and how we manage the active ideas and setups. Thank you all for your likes, comments and follows, we really appreciate it!
Mr Gold
GoldViewFX
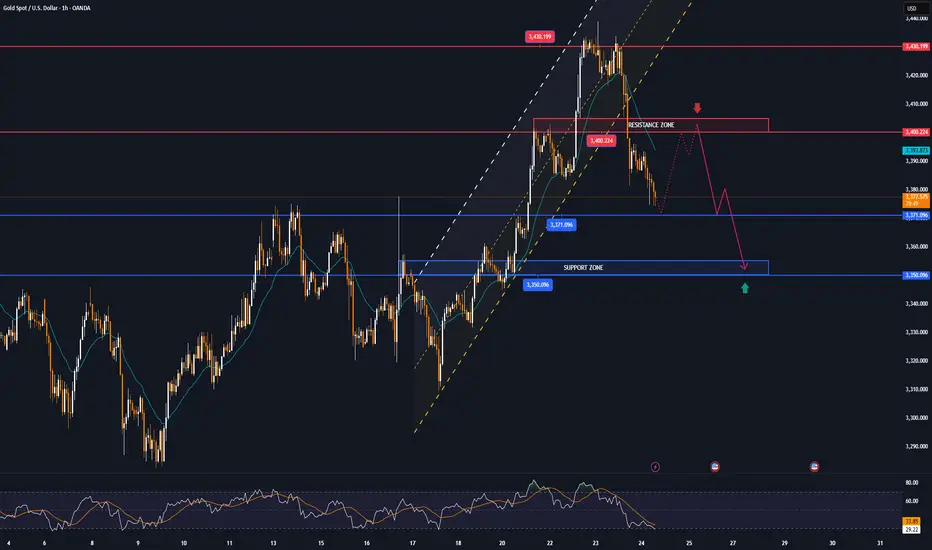
Gold (XAU/USD): Supply Zone Rejection & Bearish Breakdown Chart Breakdown:
Supply zone rejection: Gold revisited the “supply zone” (light green/grey area) and failed to break above — a classic signal of seller dominance.
Uptrend invalidated: A sharp rise (steep black trendline) ended with a peak marked by the green arrow, followed by a decisive breakdown.
Ichimoku Cloud test: Prices slipped through the Ichimoku components, reinforcing the shift to bearish sentiment.
Potential targets: The red/green risk‑reward box highlights a short position, targeting ~3,347 then ~3,318 levels (blue labels) as initial support zones.
Strong supply base: The extensive grey zone below marks a "stronger supply zone" — this could cap any modest bounce and keep the downtrend intact.
🔍 Interpretation:
Bias: Bearish — sellers have taken control after a failed breakout.
Strategy: Short on rallies toward the mid‑green/red box (~3,373–3,380), targeting ~3,347 first and then ~3,319. Watch for support at the strong supply region (~3,292) for potential reversal or consolidation.
Risk management: Keep stop above the red zone—above recent highs (~3,380+) to limit risk.
🚀 In a nutshell: After failing to break supply and losing its short‑term uptrend, gold appears poised for a pullback. The next key levels to watch are ~3,347 and ~3,319—where buyers might step back in, or the downtrend continues toward the deeper supply base.

Daily live trade with XAUUSD in 15m/30m/1h 20250723Daily live trade with XAUUSD in 15m/30m/1h 20250723
XAU / USD 4 Hour ChartHello traders. Happy Friday. Taking a look at the 4 hour chart, I have marked my current area of interest for potential scalp buy / sell trade set ups for gold today. We are curretnly retesting / revisiting the area where gold originally broke out from. Let's see if we move back up to take out any short positions in profit, or do we keep pushing down and break past the bottom of the channel. Trade the trend and never try to force or rush a trade. Shout out to Big G. Let's see how things play out over the next hour or so. If I take a trade, I will post a chart or update this one. Otherwise, have a great weekend. Be well and trade the trend.

Gold Intraday Trading Plan 7/24/2025Yesterday in lower TF, gold was testing the resistance line for a couple of times but failed to maintain it. It quickly dropped back into the line and closed the day under 3400. Daily, it still looks bullish but in lower TF, it is still bearish.
Therefore, I will be cautious in placing buying orders today. As long as 3373 still holds, I am still bullish in gold. I will look for set up around this level and my 1st target will be around 3415. Final target for today is 3450.
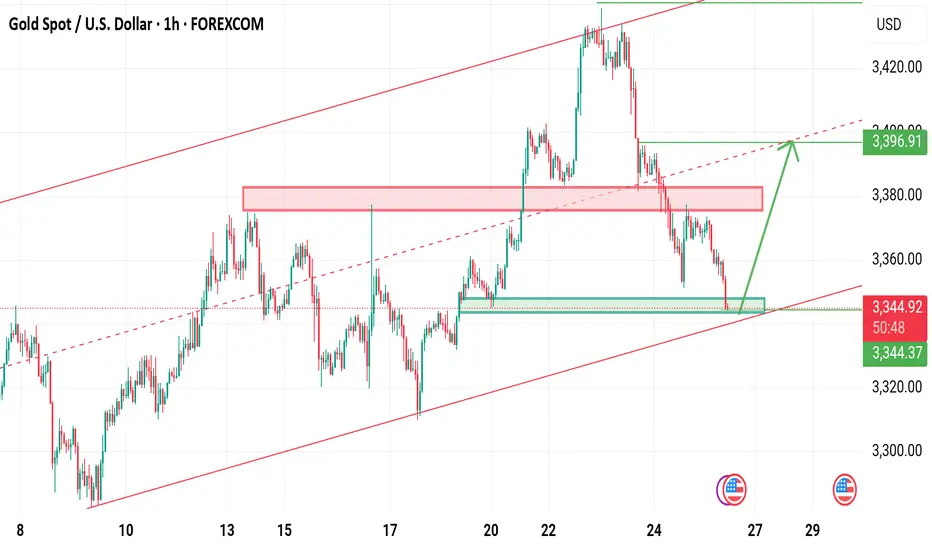
XAUUSD Last hope for buyers Gold is currently still holding rising channel last hope for buyers the bottom trendine .
Below 3335 buyers will be liquidate
What's possible scanarios we have?
▪️I'm gonna take buy trade from 3340-3338 area by following our rising Trend along with structural liquidity sweeps strategy, my target will be 3357 then 3368 in extension.
▪️if H4 candle closing below 3335 this Parallel moves will be invalid and don't look for buy till confirmation
Gold Bullish Momentum still strongGeneral trend and momentum is still to the upside. We now have a nice pullback and an opportunity to buy low again. Price is currently reacting to an H1 TF demand zone. If this zone breaks, look for entries in H4 demand and continue to ride the bulls to All Time Highs.

Gold selling pressure decreased at the end of the week⭐️GOLDEN INFORMATION:
Gold price (XAU/USD) remains under modest pressure during Friday’s Asian session, unable to build on the previous rebound from the mid-$3,300s. Renewed strength in the US Dollar, which extends its recovery from a multi-week low, acts as a headwind for the non-yielding metal. Additionally, fresh optimism surrounding the US-Japan trade agreement has dampened safe-haven demand, keeping gold on the defensive for the third consecutive day.
That said, lingering uncertainty over the Federal Reserve’s rate-cut trajectory, along with concerns about its independence amid growing political pressure, could limit the USD's upside. Meanwhile, rising geopolitical tensions—this time along the Thailand-Cambodia border—may lend some support to bullion. Investors now await US Durable Goods Orders data, which could influence the greenback’s direction and provide short-term cues for the XAU/USD pair going into the weekend.
⭐️Personal comments NOVA:
Gold prices are consolidating and starting to fall below 3400 to stabilize. The momentum for an early rate cut is waning.
⭐️SET UP GOLD PRICE:
🔥SELL GOLD zone: 3399- 3401 SL 3406
TP1: $3390
TP2: $3380
TP3: $3370
🔥BUY GOLD zone: $3310-$3312 SL $3305
TP1: $3325
TP2: $3333
TP3: $3345
⭐️Technical analysis:
Based on technical indicators EMA 34, EMA89 and support resistance areas to set up a reasonable SELL order.
⭐️NOTE:
Note: Nova wishes traders to manage their capital well
- take the number of lots that match your capital
- Takeprofit equal to 4-6% of capital account
- Stoplose equal to 2-3% of capital account

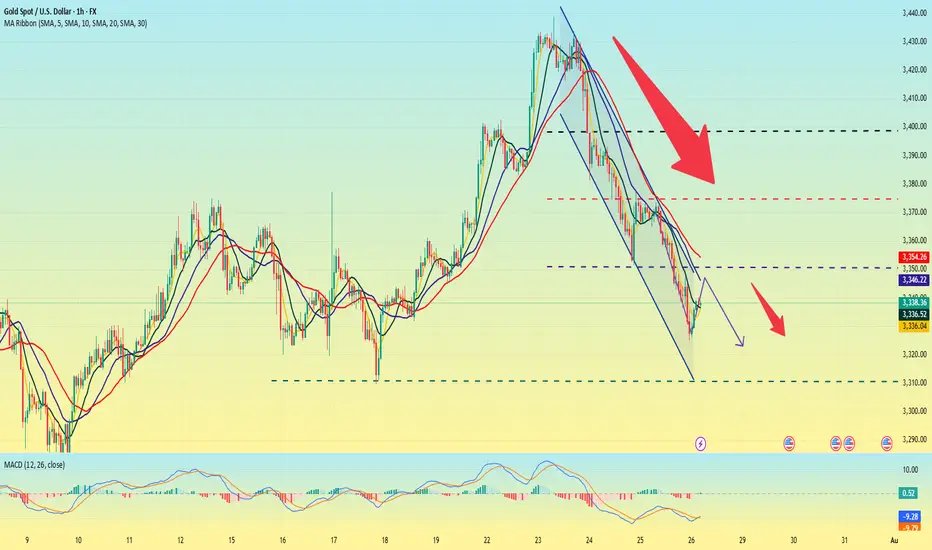
Gold is going down. It may continue next week.On the last trading day of this week, the bears attacked strongly and continued to refresh the recent lows, reaching the lowest point near 3325 before stopping.
From Monday's 3345 to 3440, it closed near 3337. This week, it also walked out of the large range roller coaster pattern, and all the strengths in the previous period did not exist. Under the continuous downward trend, the bulls were also vulnerable, and there was not even a strong rebound, which indirectly explained the strength of the bears in the short term.
As for the current trend, the bears are likely to continue to be strong, and before there is a symbolic upward breakthrough, we still need to maintain the idea of shorts to operate. The current upper pressure is maintained near 3350, which is also the bottom position touched for the first time in the previous period. It is possible that it will be transformed into a top-bottom conversion pattern; and the strong support level below is near 3310.
When the Asian market opens next Monday, we need to pay close attention to whether there is a gap problem on both the bulls and bears. After three consecutive negative daily lines, all the moving average systems have been broken, and it is also likely to form a resonance pressure pattern. On Monday, gold will first touch around 3350 and continue to short. The profit range will be around 3330-3320, and the stop loss will be 3360. If the European session is stronger, you can adjust the point before the US session.
Summary of gold market this week and analysis of next week's mar
Gold closed with an inverted hammer candlestick with a relatively long upper lead this week. Technically, the market is still bearish next week, and the pressure from above is still relatively large. After reaching the highest point of 3438.7 this week, it started a unilateral decline mode, which caught the bulls off guard perfectly. This week, I also emphasized that the 3400 line is not a high point. Gold rose strongly at the beginning of this week, and the market had high expectations for bulls. In the second half of the week, gold fell unilaterally, hitting the bulls hard. This week, it closed at 3336.7, which is another distance from 3400. Next week, we will continue to give the operation ideas of rebound shorting according to the technical analysis. Following the trend is the way to invest. If your current operations are not ideal, I hope I can help you avoid detours in your investment. You are welcome to communicate with me!
From the 4-hour analysis chart, we focus on the short-term suppression of 3370-75 on the top, and focus on the suppression of 3397-3400 on the top. After all, gold fell and broke through here this week, and then fell southward. We focus on the support of 3312-18 on the bottom. On Friday midnight, we gave a long position at 3318-25. Gold rebounded at 3324.9 at midnight. In operation, gold will still be treated as rebound short next week. I will remind you of the specific operation strategy during the trading session, so please pay attention to it in time.
Gold operation strategy:
Short gold rebounds at 3370-75, stop loss at 3387, target 3327-3330, and continue to hold if it breaks;

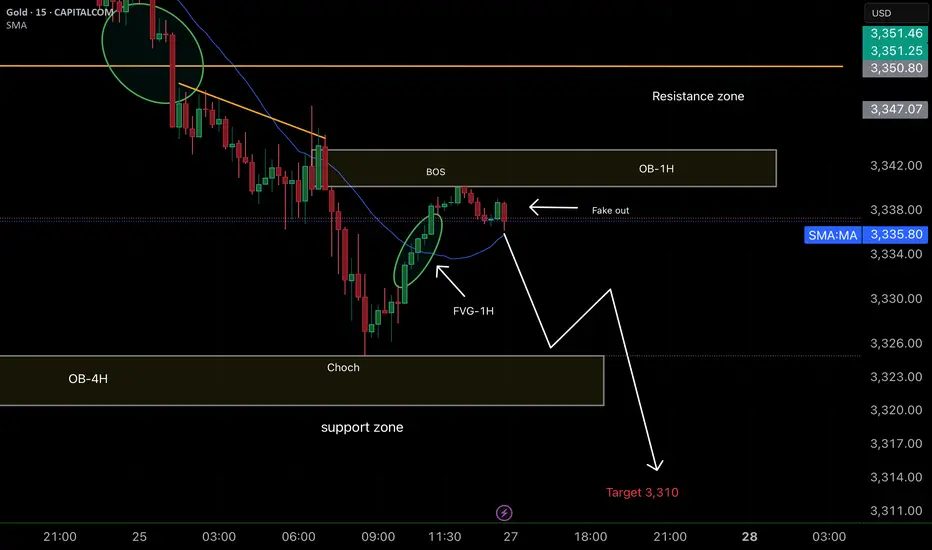
XAUUSD Path Going As per Previous Ideas Analysis Discussed.XAUUSD Path Going As per Previous Ideas Analysis Discussed in the images above for further information or Previous Analysis refer previous Ideas.

Smart Money concepts (SMC) Positive points of the analysis:
1. Clarity in the market structure (CHoCH + BOS):
It is clear that the market made a CHoCH and then confirmed it with a Break of Structure (BOS), which validates the downward trend change.
2. Well-identified fake out:
The "fake out" just after the BOS and within the 1H-OB is typical institutional behavior. This bullish wick is a trap to induce liquidity before the fall. Excellent reading.
3. Confluence zone (1H-OB + 1H-FVG):
The price rises to mitigate the 1H-FVG within the 1H-OB, providing a very good entry opportunity.
Furthermore, this occurs within the resistance zone, which gives it even more weight.
4. Support zone and target at 3310:
The TP is very well projected at 3310, just below the current support zone. If it breaks that zone, it is highly likely that it will reach the target.
XAUUSD Bullish ScenarioAccording to the data in the chart, the price has proven its bullishness by breaking important levels. Overall analysis can be buying at $3340 towards the target of $3450. On the other hand, if the price breaks $3340 with strength, the bullish scenario can fail.
