Gold. Could this be the final "shape" of triangle? 26/July/25XAUUSD. back to previous ideas that we possible having a contracting /symmetrical triangle pattern on gold chart..Probarly a "big surprise" on 31 July FED/FOMC meeting?
GOLDCFD trade ideas

Wait for 3330 to buy the bottom and reduce unnecessary operation#XAUUSD
We have made good profits from short selling yesterday. Currently, gold has fallen to 3350📎. The 4HMACD death cross has increased in volume and is expected to continue to decline. Consider going long near 3330📈. I don’t think it is prudent to bottom out at 3340. Move forward steadily on Friday and reduce unnecessary operations⚖️.
🚀 BUY 3335-3330
🚀 TP 3345-3362

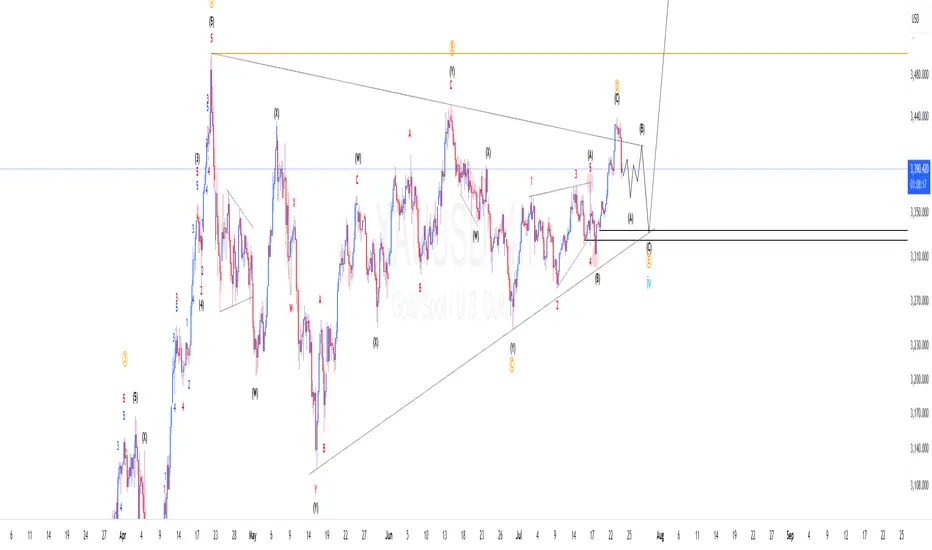
XAUUSD Elliotwaves updateWe are yet to complete wave 4. So far the structures supports the triangle correction and price completed wave "d" and started final wave "e". If we are correct we should expect price make another 3 waves down to complete wave 4 and then resume the bullish momentum. To take advantage of the overall trend one should find areas where price has high probability of finding support to take the trade.
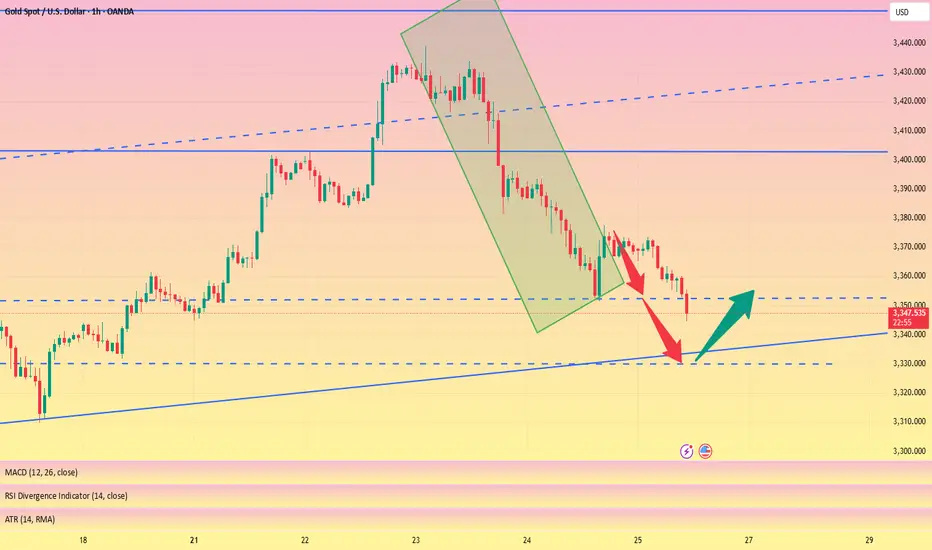
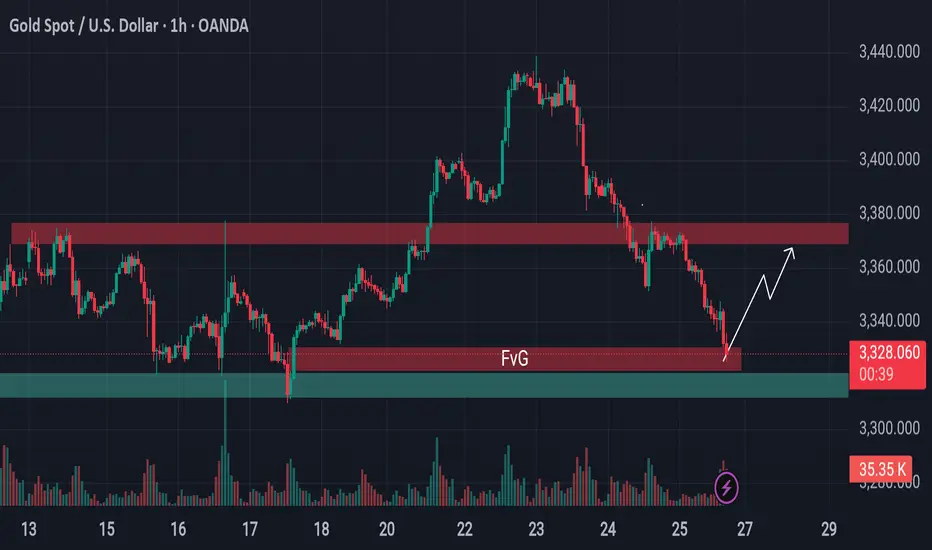
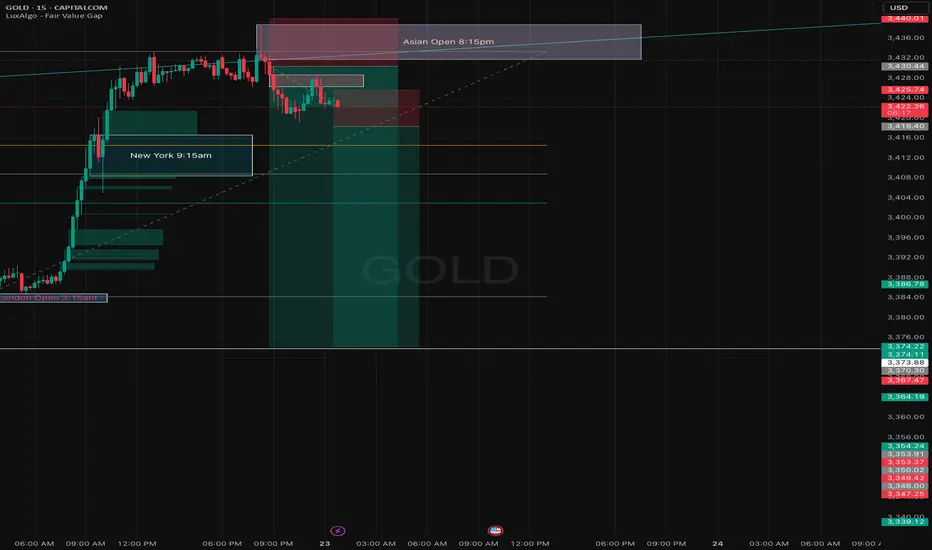
From Breakdown to Breakout? Gold Eyes Support Based Reversal!Gold is approaching a critical support area.
Previously, the price was holding above a key support level, but that zone has now been breached and is likely to act as resistance going forward. However, just beneath the current price, there's a well-established support level still intact—reinforced further by the presence of a bullish Fair Value Gap (FVG).
This setup hints at a possible reversal or a short-term surge from this zone. If market conditions align, gold may stage a pump from here. Keep this level on your radar—it could turn into a decisive point for price direction.
🛡 Always conduct your own analysis before taking any trades. DYOR.
7/25: Key Levels to Watch Closely for Next Week's TradingGood evening, everyone!
Due to health reasons, I had to take a short break from updates — thank you all for your understanding and support.
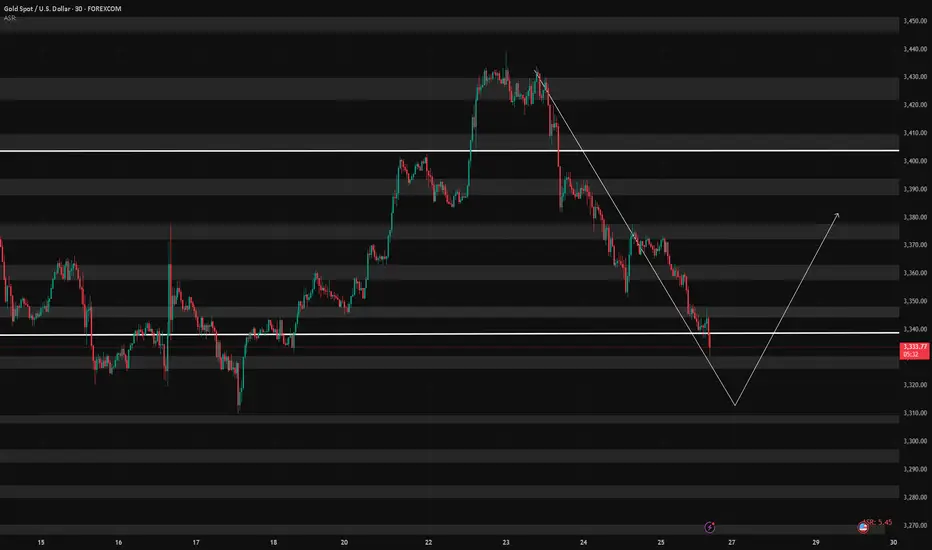
This week, gold rallied to the 3440 level, forming a double-top pattern, and has since entered a phase of consolidation with a downward bias, currently retracing back to the key 3337-332 support area.
While a short-term rebound is possible from the 30-minute chart perspective, the weekly structure is not favorable to the bulls. On the daily chart, price has once again reached the MA60 support, and is currently forming three consecutive bearish candles, which suggests that bearish momentum may continue.
Unless there is significant bullish news next week, the market may remain under pressure. Key levels to monitor:
Upside resistance zones: 3343, 3352, 3358, 3366, 3372, 3378, and 3386–3392
Downside support zones: 3337, 3332, 3323, 3312
If the weekly chart breaks down, watch for: 3300 psychological level and 3260 (weekly MA20)
Additionally, during this week's decline, a price gap has been left between 3395–3398. If the market starts to rebound on the 2-hour chart, there is a chance this gap will be filled. However, this area also serves as strong resistance, and any approach toward it could result in heavy selling pressure. Caution is advised in the event of a sharp rally.
I'm still recovering and unable to monitor the markets for extended periods. Once my health improves, I’ll resume regular updates. In the meantime, feel free to leave any questions, and I’ll do my best to respond. Thanks again for your continued support, and I wish everyone success and strong profits in the market!
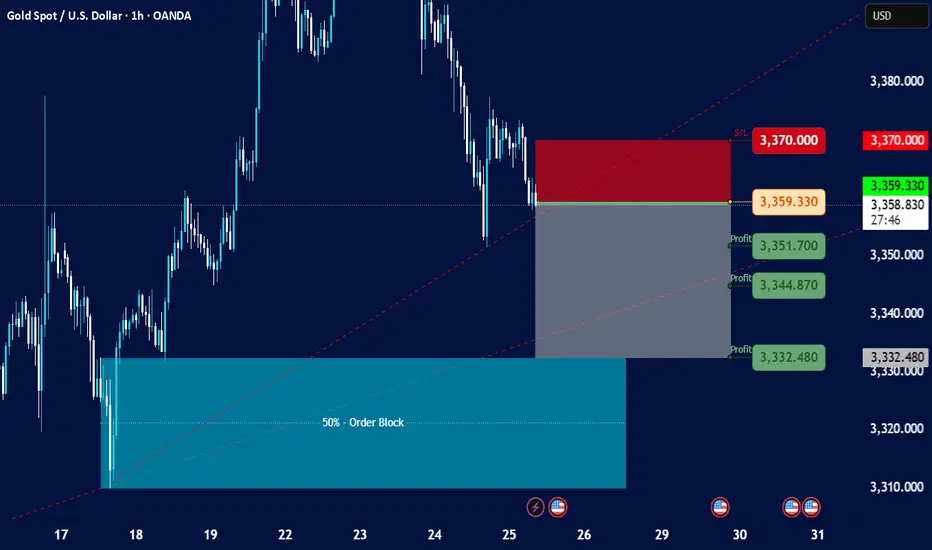
Gold Spot / U.S. Dollar - 1h on TradingView, dated July 25, 202Current Price and Trend:
The current price is shown as 3,359.330, and the last traded price is 3,359.005.
The chart indicates a downtrend in recent sessions, with the price having fallen significantly from higher levels around 3,380.000 to 3,390.000 down to the current levels.
There's a dashed red line (possibly a trendline or resistance) indicating a downward slope.
Key Zones and Levels Identified:
Resistance/Stop Loss Zone (Red Rectangle):
This zone is marked from approximately 3,365.000 up to 3,370.000.
A "S/L" (Stop Loss) level is explicitly marked at 3,370.000. This suggests that a short position (selling) is being considered, with a stop loss placed above this resistance.
Entry Point (Grey Line):
An entry point for a trade is indicated by a grey horizontal line at 3,359.330. This is very close to the current price, suggesting a potential entry for a short trade.
Profit Target Zones (Grey Rectangle with Green Labels):
Three "Profit" levels are identified below the entry point:
3,351.700
3,344.870
3,332.480
These levels suggest potential targets for taking profit on a short position. The grey shaded rectangle represents the area where these profit targets lie, extending downwards from the entry point.
50% - Order Block (Teal Rectangle):
At the bottom left of the chart, there's a large teal-colored rectangle labeled "50% - Order Block."
This typically represents an area where significant institutional buying interest (or an accumulation of orders) is expected, potentially acting as strong support. The price has previously bounced off this area.
Possible Trading Strategy Implied:
The setup suggests a potential short-selling strategy for Gold Spot / USD, likely based on a continuation of the downtrend or a retest of previous resistance levels.
Entry: Around 3,359.330 (current price level).
Stop Loss: At or above 3,370.000, to limit potential losses if the price moves against the short position.
Take Profit: Phased profit-taking at 3,351.700, 3,344.870, and 3,332.480.
Target Support: The ultimate target appears to be within the "50% - Order Block" zone, suggesting the expectation of the price reaching or testing this strong support area.
Considerations and Further Analysis Needed:
Confirmation: The chart doesn't show any specific indicators (e.g., RSI, MACD) that might confirm the downtrend or potential entry.
Volume: Volume analysis would be beneficial to assess the strength of price movements.
News/Fundamentals: Any upcoming economic data or geopolitical events could significantly impact gold prices.
Risk-Reward Ratio: A calculation of the risk-reward for each profit target would be useful to determine the attractiveness of the trade.
Market Structure: A deeper analysis of the market structure (higher highs/lows, lower highs/lows) could provide more context.
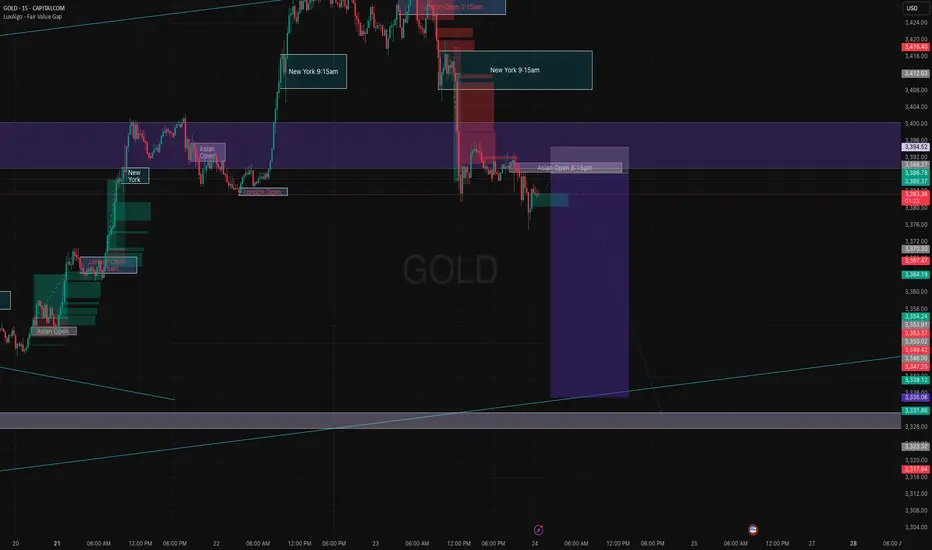
XAUUSD analysis - 1H FVG and OB setupsOn the 1H timeframe, price is reacting as it approaches the HTF high zone (3430-3450) and is currently pulling back.
The 1H FVG zones at:
🔹 3400
🔹 3368
and the 1H OB around 3350 are key areas we are watching for potential long entries.
📌 Plan:
We will wait for price to pull back into one of these 1H FVG/OB zones and look for entry confirmations on the 5M or 3M timeframe to go long.
🎯 Targets: 3430 – 3440 – 3450
❌ No sell setup for now unless a clear structure break happens.

Buy level GoldStrong buy expected from our marked level strong buy trend line and fresh bullish engulfing level
Wait LTF confirmation then buy

CONFLUENCE We might see GOLD using this confluence to go up. Gold is currently trending upwards, therefore we might see it continuing with that trend


Gold on the magic level, pullback?Gold reached a key level i was waiting for more than a week. The area from 3325 till 3350 is the real support zone that could lead the price to pullback. In H1 and M15 timeframe i can see a reversal pattern, that let me join this trade with a small risk (due to the RR ratio). I will increase my size if NY will give us a better scalp opportunity

"Gold at a Crossroads: 4H Close Below $3358 Could Trigger Major Technical Analysis
Key Levels:
Resistance Zones:
$3,451.42 – Major resistance.
~$3,410 – Mid-range resistance zone.
Support Zones:
$3,358 – Key support zone (critical level).
$3,330.50 – Secondary support.
$3,283.22 and $3,253.35 – Deeper support levels.
Current Price Action:
Price is currently trading at $3,366.47, pulling back after hitting a local top.
The yellow zone marks a decision area: Price may either bounce up or break down.
Two Scenarios Outlined:
🔼 Bullish Scenario: If price holds above $3,358 and breaks above the yellow zone, it may aim for $3,410 or even $3,451.
🔽 Bearish Scenario: A 4H candle close below $3,358 could signal continuation down toward $3,330, $3,283, and possibly $3,253.

XAU/USD: Golden Breakout to $3400?XAU/USD: Golden Opportunity Ahead XAU/USD is testing a key support at $3345, with a bullish setup forming on the 1-hour chart. Entry at $3345 offers a high-probability trade, targeting $3400 where the next resistance aligns. Set a stop loss at $3320 to manage risk below the recent support. A break above $3350 with strong volume could confirm the move. Watch for US dollar weakness as a catalyst. Trade smart!
#XAUUSD #GoldTrading #ForexSignals #TechnicalAnalysis #MarketAnalysis #DayTrading

Gold Bullish idea so far . 23.7.2025we got the last bullish zone at 3375- 3326 ( marked as BC )
price must respect that zone to go for the next target at around 3500 .
This is ONLY the Bullish Idea .
price must Break 3454 to activate new ATH sequence targeting 3850 zone .

gold bearishgold has not respected any support ony to H4 3351.
will it make its way up from here. only candle stick reaction to tell us.
however the safest trade for today to end the week is shorts.

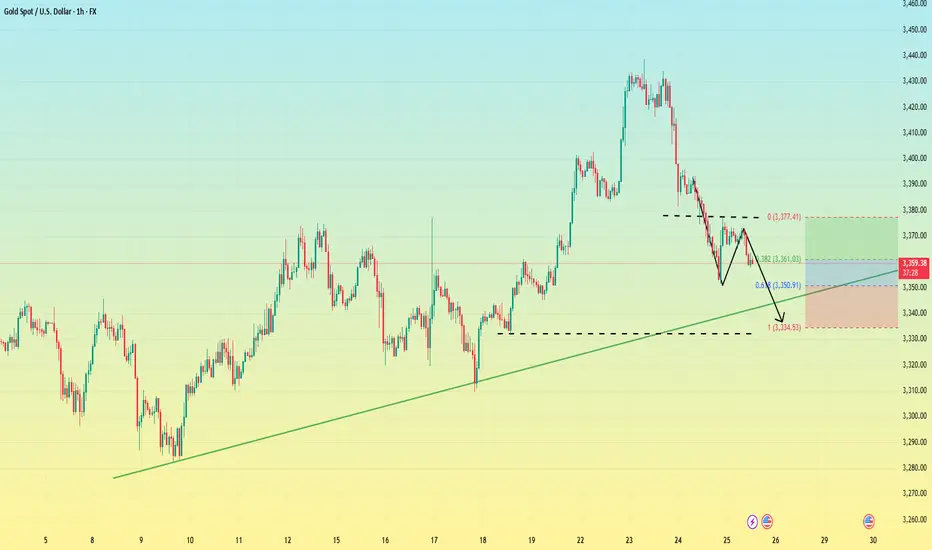
SMC Strengths of the Analysis
• ✔️ Clear bearish structure (ChoCH + BOS + fake out)
• ✔️ Mitigation target (1H FVG not yet closed)
• ✔️ SL well protected outside the manipulation zone
• ✔️ Logical entry right where the imbalance begins

Gold is weak. Beware of lows.On Thursday, the dollar index ended a four-day losing streak thanks to the progress of the fund between the United States and its trading partners.
As signs of easing global trade tensions curbed demand for safe-haven assets, gold fell for the second consecutive trading day, and yesterday it hit the 3350 bottom support level.
From the 4-hour chart
although it rebounded to the 3370-3380 range after hitting 3350. But it can be found that the current rebound is actually weak, and it is still maintained at 3360-70 for rectification. At present, the bottom of the 4-hour bottom is absolutely supported at 3340-3335. The rebound high is around 3375. As of now, gold has not rebounded above 3375, and gold is actually in a weak position.
Secondly, from the hourly chart, the weakness is even more obvious. The high point on Thursday was around 3395. Today's current high point is around 3375. It can be seen that if the bottom falls below the 618 position 3350 again, it will directly touch around 3335. It coincides with the target position of 3340-3335 in the previous 4-hour chart.
Therefore, it is not possible to buy the bottom and go long today. Be alert to the possibility of further touching 3340-3335.
XAUUSD correction in progress Next target 3460-3470XAUUSD was trading in a up trend and currently consolidating, At the fib 0.5 and support channel support trendline both overlap at 3410-3415 area from where the price may resume again up the target can be 3460. let us see.

Gold technical outlook – Signs of exhaustion at channel topOANDA:XAUUSD is climbing within a well-defined ascending channel, and price is now brushing up against the upper boundary, a dynamic resistance zone that has historically triggered pullbacks. If price gets rejected here, we may see a healthy correction toward the key support at 3,350, offering a potential reload point for bulls.
Should buyers step in and defend this level, the bullish structure remains intact, setting the stage for a renewed push higher. On the other hand, a clean break below 3,350 could open the door for a deeper retracement toward the lower edge of the channel, where more significant demand may lie.
All eyes should be on price action and volume in this regio, watch for reversal patterns like bullish pin bars or engulfing candles to confirm entries. As always, risk management comes first. Don't trade assumptions, trade confirmations.
What’s your take on this setup? Drop your thoughts below and let’s discuss!

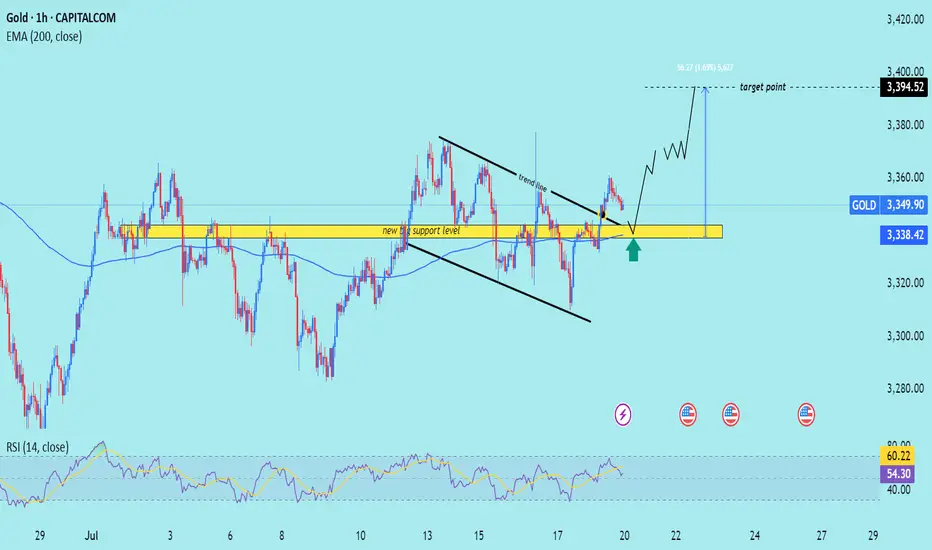
XAU/USD) Bullish trend analysis Read The captionSMC Trading point update
Technical analysis of XAU/USD (Gold) on the 1-hour timeframe. Here’s a breakdown
---
Technical Analysis Summary
Descending Channel Breakout
Price action previously formed a descending wedge/channel, shown by the two black trendlines.
A bullish breakout occurred above the trendline, signaling a shift in momentum from bearish to bullish.
Key Support Zone
The yellow highlighted zone (around $3,338–$3,340) is marked as the “new key support level”.
Price is expected to retest this area (confluence with 200 EMA), which aligns with standard bullish breakout behavior.
The green arrow indicates potential bounce confirmation.
Bullish Projection
After the retest, price is projected to climb steadily toward the target point at $3,394.52.
The setup anticipates around 56.27 points upside, or roughly +1.69% gain from the support zone.
---
Target
$3,394.52 – defined using the previous range breakout height and horizontal resistance.
---
Trade Idea
Entry: On bullish confirmation near $3,338 support zone.
Stop Loss: Just below the yellow zone (e.g., under $3,330).
Take Profit: Near $3,394.
Mr SMC Trading point
---
Conclusion
This is a classic breakout-retest-play, supported by trendline structure, a key horizontal support zone, and RSI strength. As long as price respects the highlighted support, the bullish outlook remains valid.
Please support boost 🚀 this analysis)