Gold Takes Flight, But Will Support Hold? Watch This Zone!Gold has broken its key resistance level in the New York session and, at the same time, has taken support from the trend line, which is pushing it upward. Currently, however, gold has also broken through another minor support level, and we can now observe that it is pulling back and moving downward.
It is advisable to remain patient at this stage. Wait for the market to come down to the zone where the previous resistance has now turned into support. If the price reacts positively at that level and shows signs of holding, we could potentially see a good buying opportunity from there.
As always, please conduct your own research (DYOR) before making any trading decisions. This is not financial advice.
GOLDCFD trade ideas

Gold : Sell Continuation Gold: Top Formed at Major Supply Zone 🔻 | 4H Reversal Setup
Looking for continuation after bearish BOS. Targeting clean liquidity below. SL above structure. R:R ~3:1

Very Strong Short!Hello all. as you see market needs a new lower low. a little above we have an Strong level that in throw the market down. be happy and Trade it if your method confirm. (wink)

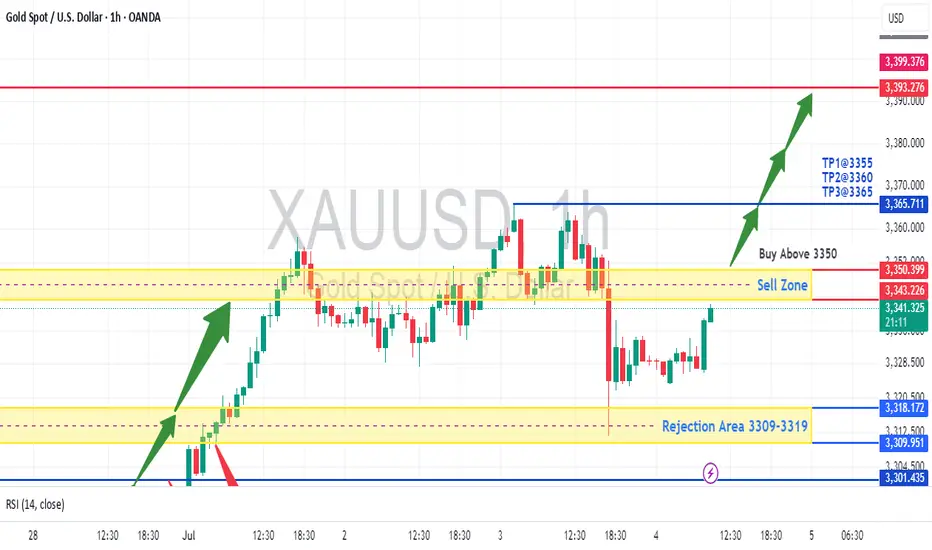
XAUUSD - Retesting 3400 before DeclineThe chart shows a potential buy setup for gold (XAUUSD) with the following key points:
Price Action: Gold is trading at 3,341.465, above the suggested "Buy Above 3350" level, indicating a bullish bias.
Support/Resistance: The rejection area at 3309-3319 held as support, and price has moved higher, confirming buyer interest.
Take Profit Levels: TP1 (3355), TP2 (3360), and TP3 (3365) provide clear upside targets.
RSI Confirmation: The RSI (14) at 54.21 shows moderate bullish momentum without being overbought.
Volume & Close: The slight increase in price (+0.09%) with supportive volume suggests accumulation.
Trade Idea: Enter long above 3350 with stops below 3309, targeting TP1-TP3. The rejection zone and RSI support further upside.
Disclaimer: This is not financial advice. Please consult with a financial advisor before making any investment decisions. We are not responsible for your loss because we are not SEBI registered and this analysis based on technical aspects and only for educational practice. Do your own research.
Gold XAUUSD Sell in trendline completion stageGold XAUUSD Sell in trendline completion stage - short term trade. now in 4th touch. bounce back to test previous level testing and return back to support again and it will break to test the sellers.

Gold Buy OfferIn 4H time frame there is a good Demand area in 3309.5-3351 price.
Ofcourse it is a thick one and S/L would be too far. So I prefer to enter the Buy position in the middle it .( some price around 3330 if drops )

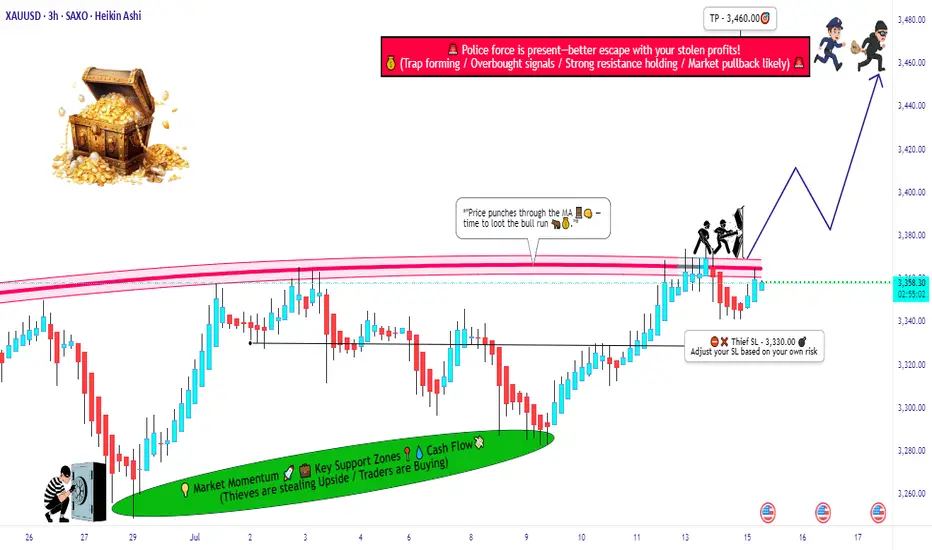
GOLD (XAU/USD) MA Breakout – High-Probability Long Setup!💰🚨 GOLD HEIST ALERT! XAU/USD MASTER PLAN (Thief Trading Style) 🎯
🔥 Steal Pips Like a Pro – High-Probability Gold Breakout Strategy! 🔥
🎯 Thief Trading’s GOLD Heist Strategy (Swing/Day Trade) �💸
👋 Hey there, Market Pirates & Profit Snatchers! 🌍✨
Based on our 🔥Thief Trading Style🔥 analysis, we’re plotting a major heist on XAU/USD (GOLD). The plan? Buy the breakout, escape before the cops (resistance) arrive! 🚔💨
📈 ENTRY ZONE: The Heist Begins!
🚀 "Wait for the MA Breakout (3400) – Then Strike!"
Bullish Confirmation: Enter on a 15M/30M pullback after MA breakout.
Thief’s Trick: Use Buy Stop above MA or Buy Limit near swing lows for best risk-reward.
DCA/Layering Strategy: Deploy multiple limit orders to maximize gains.
🔔 Set an ALERT! Don’t miss the breakout – thieves move fast! ⏳
🛑 STOP LOSS: Protect Your Loot!
📍 Thief’s SL Placement: 3330.00 (4H Swing Low) – Adjust based on your risk & lot size.
⚠️ WARNING: If using Buy Stop, DO NOT set SL until after breakout – unless you love unnecessary losses! 🔥
🎯 TARGET: Escape with the Gold!
🏴☠️ Take Profit Zone: 3460.00 (or Exit Early if Bears Show Up!)
Scalpers: Only trade LONG side – use trailing SL to lock in profits.
Swing Traders: Ride the wave but watch for resistance traps!
📰 MARKET CONTEXT: Why This Heist?
Neutral Trend (But Bullish Potential! 🐂)
Key Factors: Geopolitics, COT Data, Macro Trends, Sentiment Shift
🚨 News Alert: Avoid new trades during high-impact news – trailing SL saves profits!
💥 BOOST THIS HEIST! (Like & Share for More Pips!)
💖 Hit the 👍 Boost Button to strengthen our Thief Trading Crew!
🚀 More Heist Plans Coming Soon – Stay Tuned!
⚠️ DISCLAIMER (Stay Safe, Thieves!)
This is NOT financial advice. Do your own analysis & manage risk.
Markets change fast! Adapt or get caught.
🎯 Happy Trading, Pirates! Let’s Steal Some Gold! 🏴☠️💛
Gold analysis WednesdayHello guys today I update the gold price action analysis, some parts of my journey and plan, and how we must prepare for every scenario that would come. Thankyou for watching

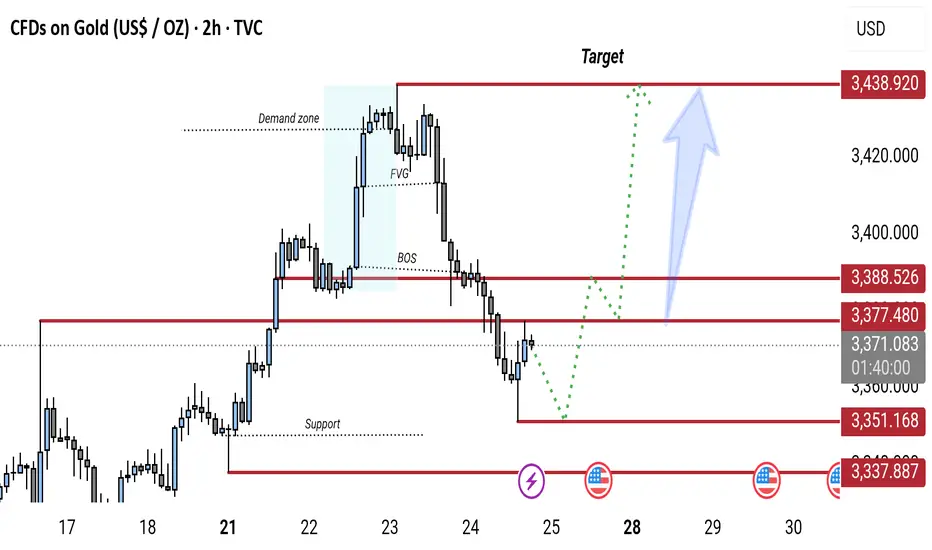
Gold 2H Chart: Bullish Reversal Expected from Key Support ZoneGold (XAU/USD) 2H chart shows a bearish break of structure (BOS) followed by a pullback toward a key support zone (around 3,337–3,351). A potential bullish reversal is expected from this zone, targeting the 3,438 resistance level. The chart highlights a demand zone, FVG (Fair Value Gap), and possible retracement before continuation to the upside.
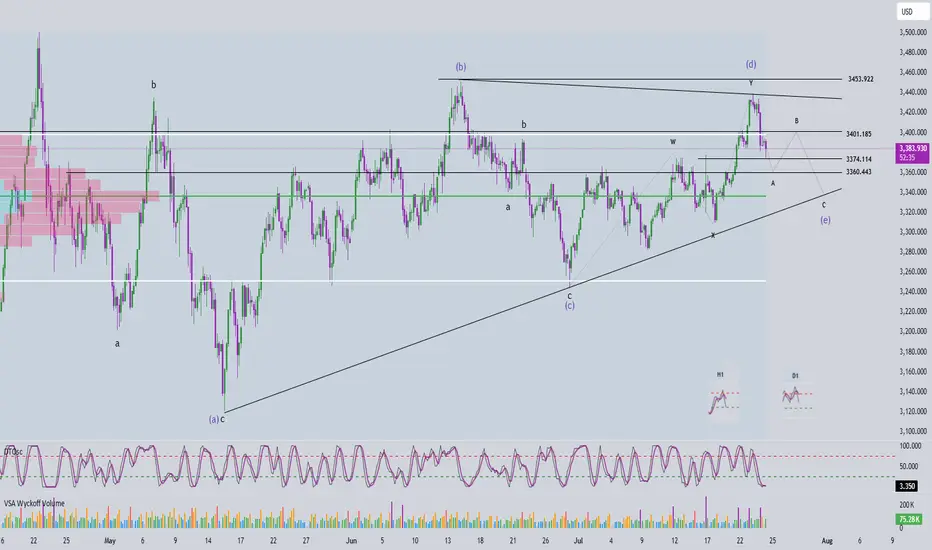
Elliott Wave Analysis – XAUUSD July 24, 2025📊
________________________________________
🔍 Momentum Analysis:
• D1 Timeframe: Momentum is currently in a downtrend, indicating that the dominant trend in the short term (at least until early next week) is likely to remain bearish or sideways.
• H4 Timeframe: Momentum has entered the oversold zone and is showing signs of a potential bullish reversal. This suggests that a corrective upward move may occur today.
• H1 Timeframe: Momentum is still declining and is expected to need around two more H1 candles before entering the oversold zone, implying that one more leg down may occur before a recovery begins.
________________________________________
🌀 Elliott Wave Structure Update:
Yesterday’s expectation of a breakout above the resistance zone at 3453 to confirm the start of a new bullish trend did not materialize. Instead, price dropped to the 3374 region, opening up two primary scenarios:
✅ Scenario 1: The correction is still unfolding
• Wave (d) in blue appears to be complete.
• The current leg is likely wave (e), the final leg in a contracting triangle correction.
• In this case, the lower boundary of the triangle and overlapping support zones will serve as key levels to watch for the completion of wave (e).
✅ Scenario 2: Wave 1 of a new bullish trend has completed
• The current decline is wave 2 in a new bullish impulsive sequence.
• The objective here is to identify the bottom of wave 2 to prepare for a potential buy entry into wave 3, which is expected to be stronger and longer than wave 1.
📌 Key difference between the two scenarios:
• Scenario 1 → Wave (e) completes, followed by wave 1 of wave 5.
• Scenario 2 → Wave 2 completes, followed by a powerful wave 3 of wave 5.
________________________________________
🧩 Current Wave Structure:
• A five-wave bearish structure is currently unfolding on the chart.
• According to Elliott Wave Theory, corrective patterns do not typically form five-wave structures.
• Therefore, this is likely wave A in a zigzag (5-3-5) formation.
• Possible targets for wave 5 within wave A:
o Target 1: 3374 – current reaction zone.
o Target 2: 3360 – next significant support level.
________________________________________
📌 Combining Wave Structure with Momentum:
The D1 momentum is firmly bearish, reinforcing the view that the market is undergoing a larger ABC correction.
On the H4 timeframe, momentum is oversold and showing early signs of reversal, aligning with the potential formation of wave B — typically a weak, sideways upward move. The likely resistance zone for the end of wave B lies between 3401 and 3410.
Meanwhile, H1 momentum is still falling and not yet in the oversold zone, suggesting there may be one more move down to complete wave 5. The ideal target for this final leg is around 3360.
Summary:
• D1 bearish → confirms ongoing major correction.
• H4 oversold → supports a potential weak wave B.
• H1 still declining → wave 5 may complete around 3360 before a recovery begins.
________________________________________
💼 Suggested Trading Plan:
For traders with limited experience or those not yet confident in reading live market signals, a Buy Limit strategy at clear support levels is recommended:
• Buy Zone: 3362 – 3360
• Stop Loss: 3352
• Take Profit:
o TP1: 3384
o TP2: 3400
🎯 For experienced traders, it is advised to observe price action at the target support zones and look for real-time reversal signals to optimize entry timing.
XAU/USD) Bullish trend analysis Read The captionSMC Trading point update
Technical analysis of Gold (XAU/USD) on the 1-hour timeframe. Here's a breakdown of the key trading
---
Technical Overview
Price: $3,428.71 (currently near the upper consolidation)
EMA 200: Around $3,367.38 (well below price, indicating strong uptrend)
Target Point: $3,468.52
Indicators:
RSI (14): 60.19–62.55 → shows moderate bullish momentum, not yet overbought.
---
Key Technical Elements
1. Bullish Breakout Structure:
Price has broken out of a previous range, and is forming a bullish flag or rectangle, which typically leads to continuation higher.
Measured move projection from previous leg (approx. $51.57 gain) targets the $3,468.52 level.
2. Strong Support Zones:
Two yellow zones highlighted:
Upper support level (around $3,415): acting as immediate structure support.
Lower key support (around $3,380): crucial structure level from where the trend initiated.
3. Trend Line Support:
A clearly marked ascending trend line supporting higher lows—indicating bulls are in control.
Expect price to stay above this trend line to maintain bullish bias.
4. Volume & RSI Confirmation:
RSI remains in a bullish zone but isn’t overbought → leaves room for upside.
Volume remains steady, confirming healthy consolidation.
Mr SMC Trading point
---
Conclusion & Trade Idea
Bias: Bullish
Entry Zone: On breakout or retest of minor support ($3,415–$3,420)
Stop Loss: Below trendline or below $3,415
Target: $3,468.52
Confirmation: Hold above trendline + RSI staying above 50
This is a classic bullish continuation setup supported by structure, RSI, and trend momentum. Traders could look for buying opportunities on minor dips or trendline retests.
---
Please support boost 🚀 this analysis)

XAUUSD Traders - Turn Chaos into Pips with This StrategyHello Traders,
Struggling to trade XAUUSD due to its high volatility? Taking small profits but suffering big losses?
We’ve got your back.
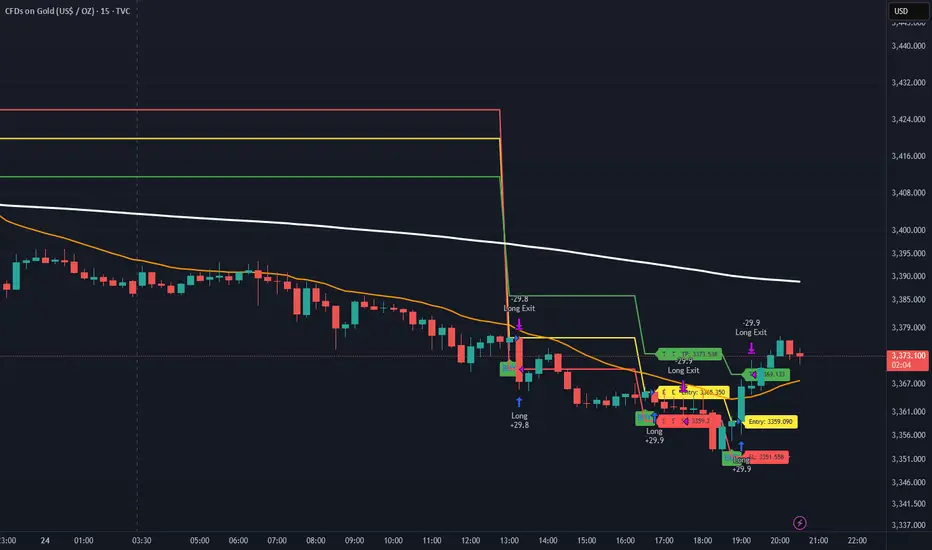
Introducing Gold Sniper — a high-probability strategy specially crafted for XAUUSD traders. With a 65%+ win rate and a consistent 1:1.33 risk-reward ratio, it’s designed to help you catch sharp moves with confidence.
🚨 Live Performance Highlights:
Today’s Trades:
Signal 1
🟢 Buy @ 3365.350
🔴 SL @ 3359.209
🟢 TP @ 3373.538
❌ Result: SL Hit → 61 Pips Loss
Signal 2
🟢 Buy @ 3359.090
🔴 SL @ 3351.558
🟢 TP @ 3369.133
✅ Result: TP Hit → 75 Pips Profit
📊 Net Profit Today: +13 Pips
📅 Yesterday’s Profit: +150 Pips
✅ Gold Sniper helps you:
• Avoid fake breakouts
• Catch real momentum
• Stick to disciplined entries and exits
🎯 Want to boost your trading accuracy?
📩 DM us now to get access and start using Gold Sniper directly on your TradingView chart.
If you find this valuable, like the idea and show your support. Let’s grow together!
Happy Trading,
InvestPro India
Gold failed to break through three times, short-term bearish?
💡Message Strategy
Gold's decline today means the second consecutive day of decline as investors turn their attention to more positive trade developments since yesterday.
However, gold still received buying support earlier this week and briefly broke through $3,400. This round of gains tested key resistance levels on the gold daily chart, but ultimately the bears held their ground.
This is the third time in nearly three months that gold has tried to break through the $3,430 to $3,435 resistance area, but all failed.
📊Technical aspects
Gold’s latest decline this week has brought the price back into a range-bound trading state between key hourly moving averages. This means that the short-term trend has become more neutral.
This shows that the upward momentum has clearly weakened and buyers need to regain short-term dominance before they can hope to challenge the key resistance area mentioned earlier again.
Currently, the 200 hourly moving average near $3,365 provides support to the downside. If the price can hold this level, it will indicate that buyers are still holding on and waiting for the next upside opportunity.
Combined with the current 1H chart trend analysis, there is still a great chance of a bullish pullback in gold in the short term.
💰Strategy Package
Long Position:3360-3365,SL:3340,Target: 3380-3400
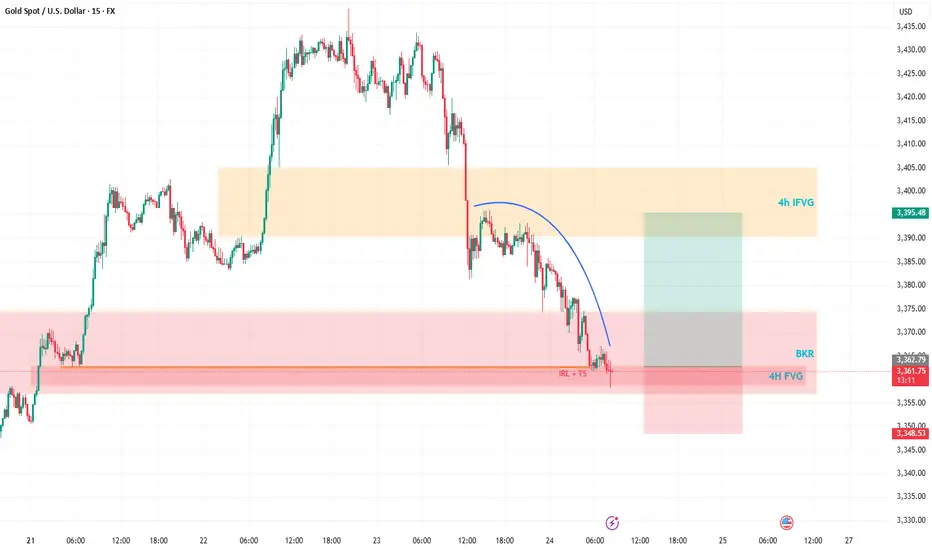
Gold’s Wild Ride: A Trader’s Take on What’s NextHey Fellow Traders! 👋
Gold’s been an absolute beast this week, smashing through both buyers and sellers like it’s playing a high-stakes game of market whack-a-mole! 😅 After Wednesday’s wild moves and today’s follow-up, Gold’s keeping us all guessing.
Right now, I’m not locking in a long-term bias—Gold’s too unpredictable for that. But here’s the exciting part: I’m eyeing a short-term long opportunity. Why? The price just dipped into a 4H Fair Value Gap (FVG) and tagged a Breaker, setting up a potential bounce. 📈
My plan? I’m expecting Gold to sweep up the highlighted liquidity and charge toward the 4H Inversion Fair Value Gap (IFVG). Once it hits that zone, I’ll be glued to the charts, watching for its reaction to decide the next move. 🧐
As always, trade smart! Set your stops, size your positions wisely, and don’t let Gold’s volatility catch you off guard. Protect your capital first—always! 💡
What’s your take on Gold right now? Are you jumping on this setup or waiting for more confirmation? Drop your thoughts in the comments below, give this post a like, and follow for more updates! 👇 Let’s keep the trading convo going! 🔥
XAUUSD Analysis todayHello traders, this is a complete multiple timeframe analysis of this pair. We see could find significant trading opportunities as per analysis upon price action confirmation we may take this trade. Smash the like button if you find value in this analysis and drop a comment if you have any questions or let me know which pair to cover in my next analysis.

Can Gold Regain Its Recent Highs or Does a Shakeout Loom?Gold has seen its price volatility increase across the first three trading days of this week. The initial move was a 3% spike higher from opening levels at 3339 on Monday, to a one month high of 3439 early on Wednesday morning, as traders sought out Gold as a safe haven hedge against renewed political attacks on the independence of the Federal Reserve and more specifically its Chairman, Jerome Powell.
Then on Wednesday, the outlook for Gold changed again, almost instantaneously, and prices reversed their course, dropping 1.7% to touch a low of 3381 after President Trump announced a trade deal with Japan, which agreed tariffs of 15% on Japanese imports into the US, a number better than many traders and investors had anticipated. Taken alongside a Bloomberg report released on Wednesday afternoon suggesting a similar agreement could be reached with the EU using the Japan deal as a blueprint, and suddenly the need for Gold as a safe haven hedge didn’t seem quite so necessary.
However, while Gold has traded as low as 3374 this morning, prices remain around 1% higher on the week (around 3380 at time of writing 0700 BST), supported on dips by an on-going theme of dollar weakness, which has continued as risk sentiment has shifted to a more positive stance. The challenge for traders is to determine whether this will remain the case into the weekend.
Looking forward, President Trump still needs to agree any trade deal negotiated with the EU, which could be a stumbling block keeping Gold volatility elevated, as could updates on the strength of the US economy when the Preliminary PMI Surveys for July are released later today at 1445 BST. Any print below 50 = economic contraction, while any print above 50 = economic expansion, and the direction of service activity in the US economy may be what draws the most headlines, especially if it moves back to the downside.
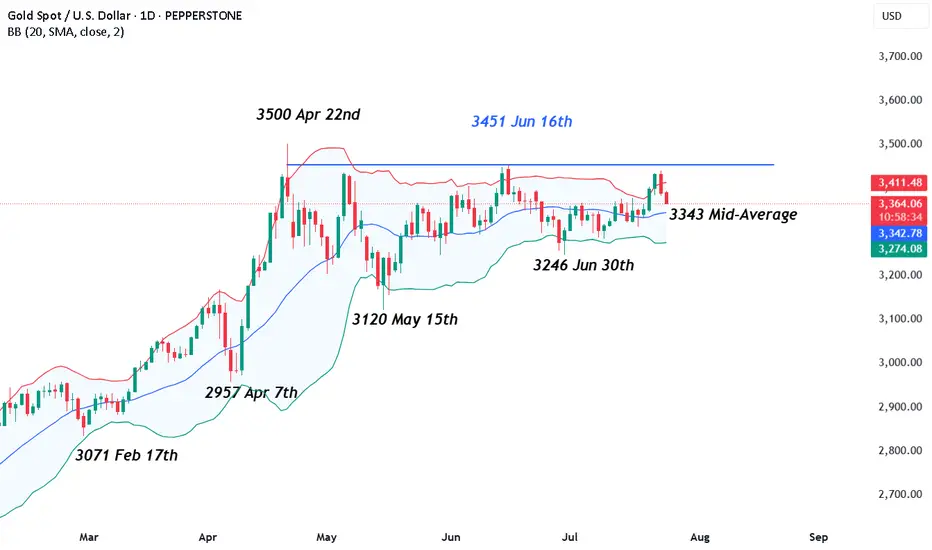
The failure of Gold ahead of the June high at 3451 may also be potentially important from a technical perspective and this is discussed further below.
Technical Update: 3451 June Highs In Focus
Having previously encountered selling pressure leading to price weakness after being capped at the June 16th high of 3451, this level remains a potential resistance focus for traders. These themes may also have been strengthened after Wednesday’s failure below this level (the session high was 3439), which has prompted the latest downside price activity, as the chart below shows.
This activity may see traders question the sustainability of the recent price strength, even looking for fresh price declines. With this in mind, let’s consider what support or resistance levels could be monitored to help establish the direction of the next possible price move.
Possible Support Levels:
The first support level if price declines are seen over the balance of the week may be marked by 3343, which is equal to the Bollinger mid-average.
Closing breaks under the 3343 support, while not a guarantee of a more extended phase of price weakness, might then open potential for a move towards 3246, the June 30th session low.
Possible Resistance Levels:
As we have suggested, it’s possible the 3451 June 16th session high represents the first resistance focus for traders, if attempts at price strength are again seen.
However, closing breaks above 3451 may be required to suggest the potential of a more extended phase of price strength to challenge the 3500 April 22nd all-time high and possibly further if this is broken on a closing basis.
Pepperstone doesn’t represent that the material provided here is accurate, current or complete, and therefore shouldn’t be relied upon as such. The information, whether from a third party or not, isn’t to be considered as a recommendation; or an offer to buy or sell; or the solicitation of an offer to buy or sell any security, financial product or instrument; or to participate in any particular trading strategy. It does not take into account readers’ financial situation or investment objectives. We advise any readers of this content to seek their own advice. Without the approval of Pepperstone, reproduction or redistribution of this information isn’t permitted.
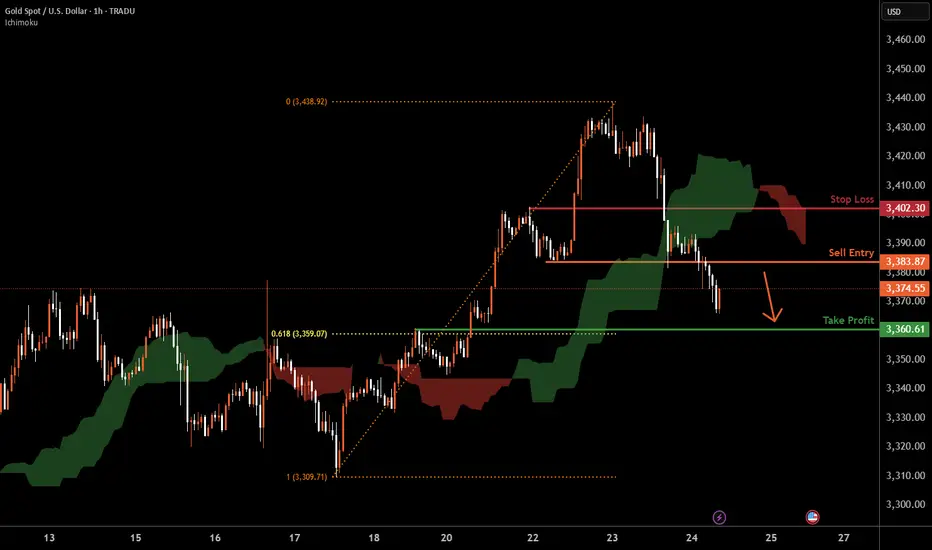
XAUUSD H1 I Bearish Reversal Based on the H1chart, the price is approaching our sell entry level at 3383.87, a pullback resistance.
Our take profit is set at 3360.61, a pullback support that aligns with the 61.8% Fib retracement.
The stop loss is set at 3402.30, a pullback resistance.
High Risk Investment Warning
Trading Forex/CFDs on margin carries a high level of risk and may not be suitable for all investors. Leverage can work against you.
Stratos Markets Limited (tradu.com ):
CFDs are complex instruments and come with a high risk of losing money rapidly due to leverage. 63% of retail investor accounts lose money when trading CFDs with this provider. You should consider whether you understand how CFDs work and whether you can afford to take the high risk of losing your money.
Stratos Europe Ltd (tradu.com ):
CFDs are complex instruments and come with a high risk of losing money rapidly due to leverage. 63% of retail investor accounts lose money when trading CFDs with this provider. You should consider whether you understand how CFDs work and whether you can afford to take the high risk of losing your money.
Stratos Global LLC (tradu.com ):
Losses can exceed deposits.
Please be advised that the information presented on TradingView is provided to Tradu (‘Company’, ‘we’) by a third-party provider (‘TFA Global Pte Ltd’). Please be reminded that you are solely responsible for the trading decisions on your account. There is a very high degree of risk involved in trading. Any information and/or content is intended entirely for research, educational and informational purposes only and does not constitute investment or consultation advice or investment strategy. The information is not tailored to the investment needs of any specific person and therefore does not involve a consideration of any of the investment objectives, financial situation or needs of any viewer that may receive it. Kindly also note that past performance is not a reliable indicator of future results. Actual results may differ materially from those anticipated in forward-looking or past performance statements. We assume no liability as to the accuracy or completeness of any of the information and/or content provided herein and the Company cannot be held responsible for any omission, mistake nor for any loss or damage including without limitation to any loss of profit which may arise from reliance on any information supplied by TFA Global Pte Ltd.
The speaker(s) is neither an employee, agent nor representative of Tradu and is therefore acting independently. The opinions given are their own, constitute general market commentary, and do not constitute the opinion or advice of Tradu or any form of personal or investment advice. Tradu neither endorses nor guarantees offerings of third-party speakers, nor is Tradu responsible for the content, veracity or opinions of third-party speakers, presenters or participants.
SellRejection Level
Daily Volume
Market Structure Shift
London Session
Trend Line Break
Untapped Order Point

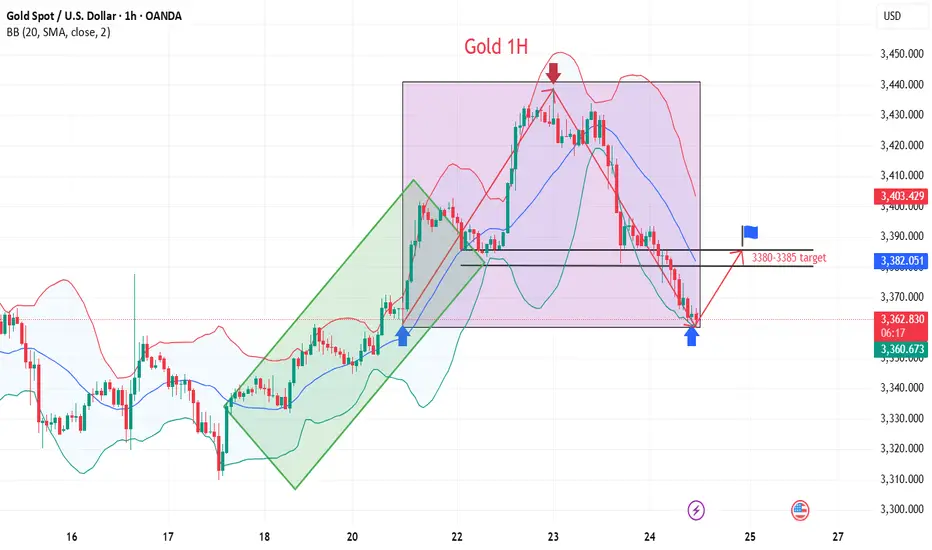
Gold Pulls Back to Support Zone📊 Market Overview:
• Gold price fell sharply to $3,385/oz, after previously testing the $3,430 zone.
• Short-term profit-taking and anticipation of upcoming U.S. economic data (PMI, durable goods orders) caused a mild USD rebound, pressuring gold lower.
• Overall sentiment remains cautious as the Fed has yet to clearly signal a rate cut path.
📉 Technical Analysis:
• Key Resistance: $3,430 – $3,445
• Nearest Support: $3,382 – $3,368
• EMA 09: Price just broke below the 9 EMA, suggesting a potential deeper correction unless it rebounds quickly.
• Candlestick/Volume/Momentum: Bearish engulfing candle with rising volume – indicates strong selling pressure and momentum currently favoring the bears.
📌 Outlook:
Gold is undergoing a short-term correction, currently testing the strong technical support zone at $3,382 – $3,385. If this zone holds, we may see a rebound toward $3,410 – $3,420. If it fails, gold could slide further toward $3,368 – $3,350.
💡 Suggested Trade Strategies:
🔻 SELL XAU/USD at: 3,395 – 3,400
🎯 TP: 3,375
❌ SL: 3,405

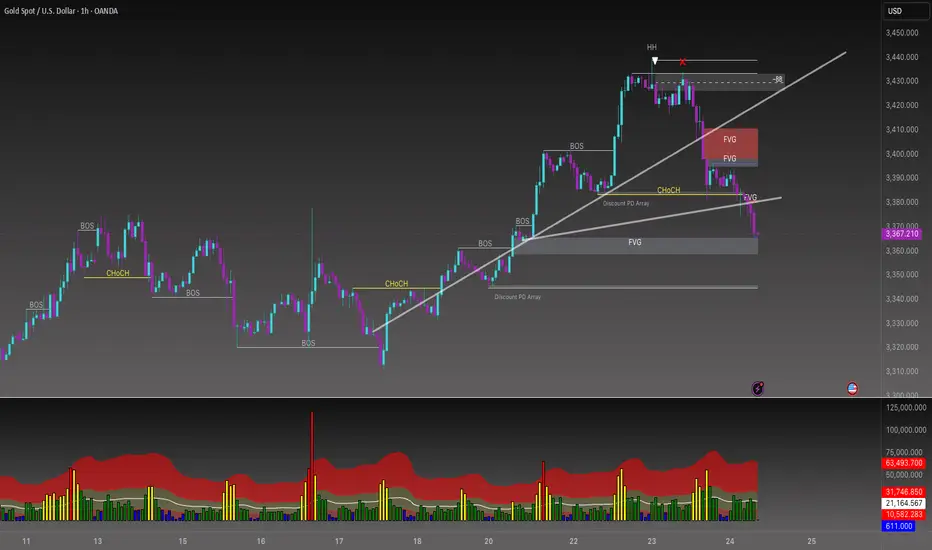
Gold vs US Dollar (XAUUSD) Technical AnalysisIf OANDA:XAUUSD gives us a strong bearish close below 3,365, I’m expecting momentum to kick in fast. With New York opening up, a swift move to 3,345 is on the table a level we’ve already marked in the Discount PD Array.
But if price holds steady around 3,365 and shows signs of rejection, I’m watching for a sharp bounce. A solid rejection with a spike could send gold back up to fill the imbalance and tag 3,388.
Gold Exhibiting Weak Bearish Momentum – Is a Rebound Imminent?Gold Exhibiting Weak Bearish Momentum – Is a Rebound Imminent?
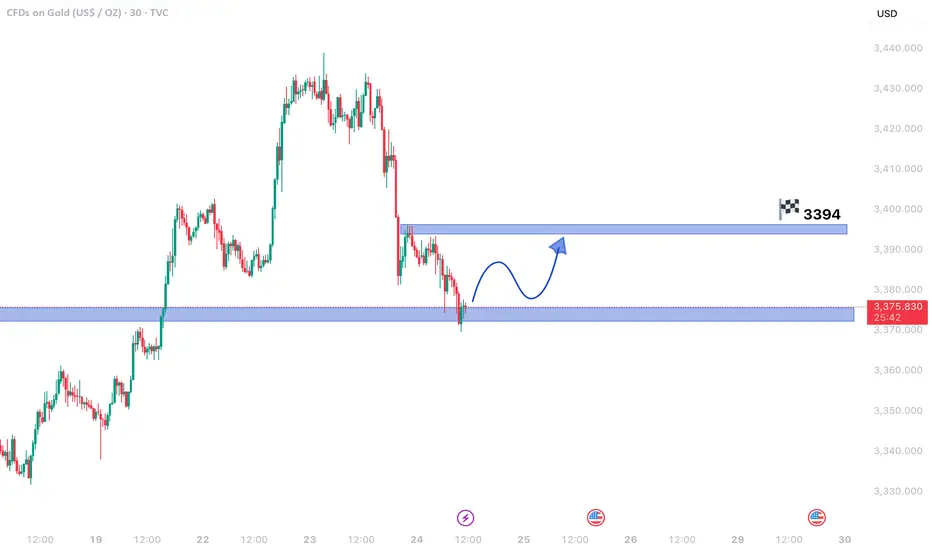
The 30-minute chart reveals gold prices in a mild downtrend, but the sluggish decline hints at weakening bearish pressure. This could set the stage for a temporary price recovery before any further downward movement.
Critical Insights:
- Fading Bearish Strength: The downtrend persists, but its slowing pace suggests seller exhaustion.
- Key Support Zone: With prices hovering near a major support area, a bullish reversal becomes plausible.
- Upside Potential: A resurgence in buying momentum may propel gold toward 3,394.60, a significant resistance level.
Market Dynamics:
1. Possible Short-Term Reversal: Shallow bearish trends near support often precede upward corrections.
2. Bullish Opportunity: A breakout past nearby resistance could fuel a rally toward 3,394.60, creating a swing trade setup.
3. Downside Risk: If support fails, the bearish trend may extend, though weak selling pressure limits immediate declines.
Strategic Approach:
- Entry Consideration: Long positions near current support levels could capitalize on a rebound.
- Risk Management: A drop below support would negate the bullish outlook, warranting a stop loss.
- Confirmation Signals: Bullish candlestick formations or increasing volume would strengthen reversal prospects.
Concluding Thoughts:
Gold’s tepid bearish momentum near a crucial support level raises the likelihood of a short-term bounce. Traders should watch for confirmation—if the recovery gains traction, 3,394.60 may come into play. Conversely, a support breakdown could renew downward pressure.
Gold Trade SetupI will risk!!!
It seems we are near at the end of correction wave...
The first target R/R is 2 and the second is 4...

Losing over and over again? Losing over and over again? The problem isn’t your strategy – it’s your mind.
Let’s be honest:
Are you repeating the same old mistakes… even though you know they’re wrong?
You know you shouldn’t enter a trade without confirmation – but you still do.
You know you should stick to your stop-loss – but you move it.
You know your mindset is unstable today – but you still open the chart and… click.
So stop blaming the market.
You’re not losing because the market is cruel.
You’re losing because you can’t control yourself.
💣 The most dangerous psychological trap: Knowing it's wrong – but doing it anyway
It’s not because you lack knowledge.
It’s not because your system doesn’t work.
It’s because your emotions are running the show.
Ask yourself:
Have you ever traded just to escape boredom, helplessness, or emotional emptiness?
Have you ever used the chart to hide from real-life pressure?
Have you ever placed a trade just to relieve stress?
If your answer is yes... then the problem isn’t technical.
It’s psychological – and deeper still, it’s emotional.
👹 The 3 emotional demons controlling your trading – and you don’t even realise it
1. FOMO – You fear being left behind more than you desire to win
You see price running → you see others making money → you feel the pressure.
You think: “I can’t miss this move!”
→ You jump in impulsively, without analysis.
FOMO reflects a lack of trust in yourself.
You don’t believe more opportunities will come.
You’re not trading with clarity – you’re reacting from fear.
2. Revenge Trading – You can’t accept the feeling of being “wrong”
Every loss feels like humiliation.
You can’t handle being “mistaken.”
So you fight the market back – like someone who’s lost all reason.
But the market doesn’t care if you’re hurt.
You’re projecting your frustration onto a system that has no emotion.
→ In that moment, you’re no longer a trader – you’re a gambler trying to ease emotional pain.
3. Overtrading – You measure your worth by how many trades you win
You only feel valuable when you’re making money.
You hate “doing nothing” – it makes you feel useless.
So you keep trading – endlessly, irrationally.
Overtrading reflects a deep fear of stillness and lack of control.
You seek validation… from your trading account.
🔍 Painful truth: You’re not losing because of the market – you’re losing because of unrealistic expectations
You expect to always be right.
You expect to get rich quickly.
You expect to prove something – to others and to yourself.
You pressure yourself to perform – and when results don’t come, your psychology collapses.
You’re not trading to beat the market.
You’re trading to fix something inside yourself.
✅ The solution? It’s not more knowledge – it’s emotional honesty
Stop trading the moment you feel out of control – whether you're winning or losing.
Keep an emotional journal daily – even on days you don’t trade. Be raw. Be real. No excuses.
Ask the right questions:
Am I trading to make money – or to soothe an emotional void?
Am I entering because of a setup – or because I’m afraid of missing out?
Do inner work outside of trading: meditate, exercise, heal emotionally, take breaks, talk to someone who gets it.
💬 Final thought:
Losing isn’t scary – what’s scary is never facing the real reason behind your losses.
Stop searching for the next shiny indicator.
Stop chasing strategies with a “90% win rate.”
You just need a decent system – and a strong mind to execute it.
True success comes when you no longer use trading to prove yourself –
but treat it like a calm, patient profession.
#TradingPsychology #EmotionalDiscipline #FOMOTrading #RevengeTrading #Overtrading
#MindsetMatters #TraderGrowth #SelfAwareness #TradingUK #ForexEducation #InnerGameOfTrading #ConsistencyIsKey #MentalEdge
