NFLX Institutional Momentum Anchored in Multi-Decade ChannelNetflix (NFLX) has maintained a structurally intact long-term bullish momentum, consistently trading within a well-defined ascending channel dating back to the early 2000s. Price action has respected dynamic support and resistance levels within the channel, establishing a sequence of higher highs and higher lows that validate the primary uptrend.
Following a breakout from a major resistance zone around 2023, the stock exhibited accelerated bullish momentum, aligning with internal demand structures and confirming institutional accumulation. Price is currently advancing toward the upper boundary of the long-term channel, with the projected target around 4,935, coinciding with channel confluence and historical extension levels.
As long as the price action maintains structural integrity above the key anchored support near 1,154, the prevailing trend remains decisively bullish. A clean break and close above the upper bound of the channel may trigger an extended rally, while any rejection at this level would likely result in a cyclical mean reversion toward mid-channel equilibrium.
NFLX trade ideas

Nflx.. It's almost timeAscending broadening wedge pattern showing here..
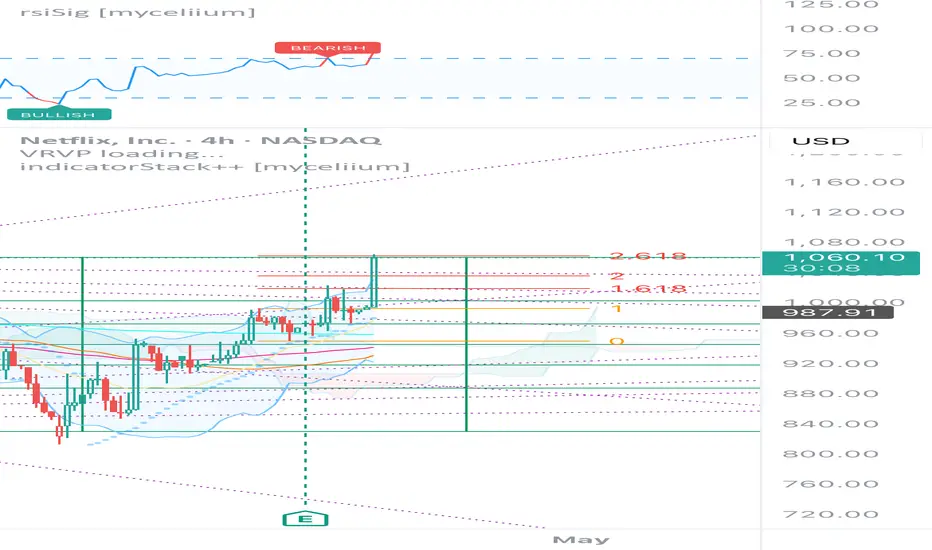
Monthly RSI is over 80 which means NFLX stands a higher chance of tagging 700 before 1300..
Daily RSI and Money Flow is absurd
Weekly candle is outside Bollingerband
It's just red flag after red flag for this stock
I don't think this clears 1150 and I think the next stop is 900 before a dead cat bounce
Monthly chart
Bulls see a break out above yellow trendline but I see a fake out..
Price is extended way above monthly bbands and like I said before, the monthly RSI is approaching 90, that is not a combination for a sustainable breakout...
I think a 50% discount is coming for this stock in the next year

Netflix (NFLX) Hits New Highs Post-Tariff WarNetflix (NFLX) has surged to a new all-time high, overcoming market jitters sparked by President Trump’s tariff announcements. The stock hit a low of $821.10 on April 7, 2025, during tariff-related volatility but has since rallied in a five-wave impulse pattern, as outlined by Elliott Wave theory—a method used to forecast price trends.
From the April 7 low, Wave (1) peaked at $922.42, followed by a pullback in Wave (2) to $848.53. Netflix then entered Wave (3), which is still unfolding. Within Wave (3), the first sub-wave, Wave 1, reached $951.43, and a corrective Wave 2 ended at $894. Wave 3 of (3) is now in progress, showing a smaller impulsive structure. Within this Wave 3, the first smaller sub-wave, Wave ((i)), hit $992.94, and the pullback in Wave ((ii)) concluded at $949.16.
Wave ((iii)) of 3 is nearing completion, after which a brief dip in Wave ((iv)) should occur. Afterwards, Netflix should rise again in Wave ((v)) to finish Wave 3 of (3). As long as the $848.53 support holds, pullbacks should attract buyers in 3, 7, or 11 swings, paving the way for further upside. Expect additional highs as the bullish trend continues.

Netflix Wave Analysis – 29 April 2025
- Netflix broke key resistance level 1063.40
- Likely to rise to resistance level 1150.00
Netflix recently broke the key resistance level 1063.40 (former multi-month high from February, which stopped the B-wave of the previous ABC correction (B)).
The price just broke the resistance trendline of the weekly up channel from October – which should accelerate the active impulse waves 3 and (5).
Given the clear daily uptrend, Netflix can be expected to rise toward the next resistance level 1150.00, target price for the completion of the active impulse wave 3.

Understanding the Recent Rise and Preparing for a Potential Dip.In our previous analysis, we highlighted the initial stock decline of Netflix driven by concerns surrounding potential tariffs and anticipated a deeper correction.
However, investor greed ("The Greed Butterfly") took flight, pushing the stock upwards.
While this surge might seem positive, it's important to understand the market dynamics at play. This rapid ascent, fueled by speculative buying and the fear of missing out (FOMO), is likely unsustainable. Like a butterfly that has exhausted its energy, the stock needs a significant period of consolidation and rest.
This suggests that a deeper correction than initially anticipated is still possible. The "Greed Butterfly" needs to land and allow fundamentals to catch up.
SEYED.

$NFLX Tradespoon - Long Entry $1057.40Tradespoon model generated long signal for Netflix NASDAQ:NFLX . Predicted range: $1057.40–$1130.81. Trend: +2.57%. NASDAQ:NFLX

Trading Analysis for Netflix**Current Price:** $1096.87
**Direction:** **LONG**
**LONG Targets:**
- **T1 = $1150.00**
- **T2 = $1200.00**
**Stop Levels:**
- **S1 = $1070.00**
- **S2 = $1050.00**
---
**Wisdom of Professional Traders:**
This analysis synthesizes insights from thousands of professional traders and market experts, leveraging collective intelligence to identify high-probability trade setups. The wisdom of crowds principle suggests that aggregated market perspectives from experienced professionals often outperform individual forecasts, reducing cognitive biases and highlighting consensus opportunities in Netflix.
**Key Insights:**
Netflix has consistently demonstrated resilience in the streaming sector, maintaining dominance despite fierce competition from rivals such as Disney+, Amazon Prime Video, and emerging platforms. Subscriber growth trends following expansions into new global markets remain pivotal in driving long-term revenue, while strategic investments in original content bolster Netflix's brand strength. Additionally, innovations in ad-supported subscription models may unlock untapped revenue streams, augmenting the company's profitability.
The macroeconomic backdrop, characterized by rising interest rates, inflationary pressures, and potential consumer sentiment shifts, has not deterred Netflix's progress. Instead, the company is proving its adaptability by exploring various monetization strategies and maintaining a healthy level of cash flow, allowing Netflix to weather broader market volatility effectively.
**Recent Performance:**
Netflix shares have experienced a strong rally in recent weeks, highlighting renewed investor confidence. From a medium-term standpoint, the stock notably bounced off critical support levels near the $1,000 mark, confirming positive momentum. This upward trajectory reflects favorable market sentiment, driven by robust earnings reports and strong subscriber retention metrics. While occasional consolidation phases emerged, the overall trend leaned bullish as Netflix delivers a mix of growth and strategic foresight.
**Expert Analysis:**
Technical indicators, including the Relative Strength Index (RSI) and Moving Average Convergence Divergence (MACD), suggest bullish momentum for Netflix. RSI readings hover within comfortable ranges, indicating an upward trajectory without being overbought. The stock is trading above key moving averages, reinforcing positive sentiment. Experts also highlight Netflix's pricing power and ability to retain subscribers amid price hikes, which underscore long-term growth prospects.
Fundamentally, Netflix's revenue diversification strategies, coupled with promising shifts in content economics, provide a solid case for maintaining upward momentum. Analysts anticipate sustained global subscriber growth, particularly in emerging markets, where demand for digital streaming continues to grow.
**News Impact:**
Recent announcements regarding Netflix's advances in franchising popular hits, alongside its increasing push into gaming, further strengthen the company's portfolio diversification. Earnings reports have consistently showcased revenue growth, driven by both increased average revenue per user (ARPU) and sustained subscriber retention. Moreover, the company’s enhanced focus on efficiency and scalable operations has positioned Netflix as a leader not just in content delivery but also in maintaining profitability despite sector-wide economic pressures.
Notably, recent partnerships and potential licensing deals with Hollywood studios underscore Netflix’s commitment to staying ahead in the content game, potentially catalyzing further stock appreciation. Meanwhile, cautiously positive macroeconomic developments contribute additional support for Netflix's outlook.
---
**Trading Recommendation:**
Given the overall bullish sentiment, strong technical performance, robust subscriber growth, and favorable news catalysts, traders could consider a **LONG** position. Netflix remains a dominant force in the streaming landscape, with solid fundamentals and improving technical indicators. Careful positioning with stops below $1050.00 ensures risk management, while targets towards $1150.00 and $1200.00 capitalize on near-term upside potential. This setup suggests an opportunity to benefit from continued Netflix growth while safeguarding against unforeseen volatility.

high 900 correction Has been running without pause with catalyst, fundamental, and has set TA. OB could stretch a little more, but likely a run to the downside from here.

Short NFLXBearish divergences on momentum oscillators signaling impeding correction. Anticipating move down to the $672 level within a few weeks. Shorting here with stop loss at $1100.

NETFLIX The 3rd Major Bull Wave has begun.Netflix (NFLX) is about to complete its 3rd straight green 1W candle since the April 07 2025 Low. That was not just any Low but a technical Higher Low at the bottom of the 3-year Channel Up.
At the same time, it almost touched the 1W MA50 (blue trend-line), which was lasted tested (and held) on October 16 2023. The bottom was also formed on a 1D RSI Bullish Divergence similar to the April 2022 major market bottom.
Those two Lows macro bottoms initiated similar rallies of +196% and +210% respectively. As a result, we expect Netflix to reach at least $2200 around this time next year.
-------------------------------------------------------------------------------
** Please LIKE 👍, FOLLOW ✅, SHARE 🙌 and COMMENT ✍ if you enjoy this idea! Also share your ideas and charts in the comments section below! This is best way to keep it relevant, support us, keep the content here free and allow the idea to reach as many people as possible. **
-------------------------------------------------------------------------------
💸💸💸💸💸💸
👇 👇 👇 👇 👇 👇

Dow Theory Using dow theory you can see Higher high and lower low trend in a bullish market of a share.

NFLX: Potential Double TopNFLX may be double Topping at this point after breaking slightly past it to previous high. The significant run up does not seem to be tied to the companies earnings report, which was a few days ago but it is possible that this is a delayed reaction to what were decent earnings. That said, there’s likely going to be a retrace after this strong of a move. It’s a high risk short but no risk no reward.

NFLX - Last man standing NASDAQ:NFLX has been one of the only, if not the only, big tech names holding relatively well during this bear market but even the best names can't go forever against the trend.
We seem to have reached the breaking point for this one as a double top short setup is currently unfolding.
I'd like to see a drop below $977 to increase my conviction and look to add to my short position.
Stops are clear at $1003 and/or $1018 depending on your position sizing and risk appetite.
I'm willing to keep this position open for at least a few days if it starts to go lower aggressively from here.
------------------------------------------------------------------------------------------------------
On a more general note, as I said on my previous post, we're still in a bear market and nothing points towards a change of trend for now. With Gold still being the only real safe haven
So, don't try to be a hero and go against the trend with any long positions! Especially not on borrowed money (leverage) !!!
It's difficult and very risky to try and catch bottoms and for now especially it's not happening if all the talking heads on CNBC and co. are calling it.
CAPITALCOM:GOLD continues to be the only safe haven, and contrary to again the talking heads, it seems to me that it can still go higher, thus stocks will continue even lower !

NFLX - Short OpportunityHad good earnings but general market condition mean its very difficult for it to standout.
Looks like it is not able to fend off QQQ sell off this morning.
Stops are at the highs of today. Looks for a move back to MAs.

NETFLIX: Good results and BULLISH technical outlook!!If there is any NASDAQ company that is weathering the strong downturn, one of them is NETFLIX. Last Thursday, it presented BETTER-THAN-EXPECTED results for both Q1 2025 and the guidance for the next quarter.
As anticipated by the Company, this quarter is the first in which it does not publish subscriber data. It only states that growth has been "slightly" higher than estimated. This leads to focusing attention on revenue and margin growth, which show a truly positive evolution.
The EBIT margin is expanding (to 31.7% vs. 28.1% in Q1 2024) thanks to price increases in various geographies and the good performance of advertising plans. All of this, in turn, favors the acceleration of free cash flow generation (+26% y/y, up to $2,789M).
For the full year, it reaffirms guidance and maintains its estimate of reaching revenues of $43.5B/$44.5B (+12%/+14% y/y) with an EBIT margin of 29% (vs. 28% previously). In short, good figures that lead us to reiterate our positive view on the stock.
--> And its technical aspect?
If we observe the chart, its trend is clearly BULLISH, and after a price pullback, finding support on its dynamic support and RESPECTING IT!!, it has regained BULLISH STRENGTH, which, supported by the presented results, EVERYTHING POINTS TO NEW HIGHS.
---------------------------------------------------------------------------
Strategy to follow:
ENTRY: We will open 2 long positions when the price exceeds 1000.
POSITION 1 (TP1): We close the first position in the 1060 zone (+5%)
--> Stop Loss at 947 (-5%).
POSITION 2 (TP2): We open a Trailing Stop type position.
--> Initial dynamic Stop Loss at (-5%) (coinciding with the 947 of position 1).
--> We modify the dynamic Stop Loss to (-1%) when the price reaches TP1 (1060).
---------------------------------------------------------------------------
CLARIFICATIONS OF THE SET UP
*** How to know which 2 long positions to open? Let's take an example: If we want to invest 2,000 euros in the stock, what we do is divide that amount by 2, and instead of opening 1 position of 2,000, we will open 2 positions of 1,000 each.
*** What is Trailing Stop? A Trailing Stop allows a trade to continue to gain value when the market price moves in a favorable direction, but automatically closes the trade if the market price suddenly moves in an unfavorable direction by a certain distance. That certain distance is the dynamic Stop Loss.
--> Example: If the dynamic Stop Loss is at -1%, it means that if the price makes a downward movement of -1%, the position will be closed. If the price rises, the Stop Loss also rises to maintain that -1% on the gains, therefore, the risk becomes lower and lower until the position becomes profitable. In this way, very solid and stable trends in the price can be exploited, maximizing profits.

Netflix (NFLX) with Trendfollowing BreakOut after EarningsNetflix is in an intact upward trend and experienced a clear trend push towards an all-time high after the latest earnings. The previous correction appears to be over: Higher highs and a clear trend reversal out of the correction were already evident in after-hours trading.
The downward trend channel has been exited and the last correction highs have been overcome - a strong technical signal.
If this development is confirmed in regular trading, a return to the all-time high can be expected. Consolidation or minor setbacks are conceivable before the overall trend continues to new highs.

Netflix is abouve breakout level of 959.24Netflix is above breakout level of 959.24 and is is near to break trendline too. May be it will cross 1000 and 1200 levels.
Note: This is not a buy sell call. Trade at your own will, Use stop loss too.

$NFLX - Earnings Top of the Implied move Hit
TA +options never ceases to amaze me.
This was the implied move for Netflix on Friday
And check out the after-hours price action.
It hit the top of the implied move and pulled back a little.
Top of the implied move was 1022 - after hours high? 1024.
So beautiful!!

CLEAR BUYLet’s break down the chart for Netflix (NFLX) on this 4-hour timeframe and analyze the setup for trading in the coming week, starting April 21, 2025. The chart provides a mix of technical indicators, price action, and annotations that can guide our trading strategy. However, please note that trading involves risk, and this analysis is for educational purposes only—you should always do your own research and consider your risk tolerance.
Chart Analysis
1. Price Levels and Trend
• Current Price: NFLX is trading at $1,007 as of April 20, 2025, up 11 points (+1.19%) on the 4-hour chart.
• Recent Highs and Lows: The chart shows a high of $1,067 and a low of $813 within the displayed timeframe (early 2025). The price has been volatile, with a sharp drop followed by a recovery.
• Moving Averages: The chart appears to use moving averages (likely the 20-period and 50-period, based on typical TradingView setups). The price is currently interacting with these averages, suggesting a potential consolidation or breakout zone.
2. Key Levels and Annotations
• Resistance (Break/Retest): There’s a resistance zone around $1,007–$1,067, marked as “Break” and “Retest.” The price recently broke through this level and is now retesting it, which could act as support if the retest holds.
• Support: A key support zone is around $938–$948, labeled “Fortune AI.” This level was tested multiple times and held as support during the recovery.
• Lower Support: Another support level exists around $850, marked as a “Break” zone where the price previously found a bottom.
3. Trade Signals
• Short Signal: A “SHORT” signal is marked around $962, which aligns with the recent pullback from the $1,067 high. This suggests a bearish move was anticipated, but the price has since moved higher.
• Long Signal: A “LONG” signal is marked around $850, which was the bottom of the sharp drop. This signal paid off as the price rallied to $1,007.
• Current Bias: The chart shows a “Bull” bias on the 1-hour, 4-hour, and daily timeframes, indicating a broader uptrend despite the recent volatility.
4. Indicators
• RSI (Relative Strength Index): The RSI is overbought (“Ove”), which suggests that NFLX might be due for a pullback or consolidation. Overbought conditions often precede a correction, but in strong trends, prices can remain overbought for extended periods.
• MACD: The MACD is showing a “Down” signal, indicating bearish momentum in the short term. This could mean a potential pullback before the next leg up.
• ADX (Average Directional Index): The ADX trend is “Down,” suggesting that the trend strength is weakening, which aligns with the idea of consolidation or a pullback.
• Aroon: The Aroon indicator shows a “Down” trend, further supporting a potential short-term bearish move or consolidation.
• Volatility: Volatility is marked as “Green C,” which might indicate increasing volatility, potentially leading to larger price swings.
• Red Candles: The presence of “Red Can” (red candles) suggests bearish price action in the recent candles, which aligns with the MACD and Aroon signals.
5. Timeframe Context
• The chart is on a 4-hour timeframe, and the session volatility is marked as “Green,” meaning the current session is active with potential for movement.
• The broader trend (daily timeframe) is bullish, which suggests that any pullbacks might be buying opportunities within the larger uptrend.
Trading Strategy for the Coming Week
Given the analysis, here are two potential setups for trading NFLX this week:
Scenario 1: Bullish Continuation (Buy on Pullback)
• Rationale: The broader trend is bullish (1-hour, 4-hour, daily), and the price is retesting a key breakout level around $1,007. If this level holds as support, it could be a good opportunity for a long position.
• Entry: Look for a pullback to the $1,007–$1,000 range. Confirm the entry with a bullish candlestick pattern (e.g., a hammer or engulfing pattern) or a bounce off the moving averages.
• Target: The next resistance is around $1,067 (recent high). If momentum continues, NFLX could push toward $1,100, a psychological level.
• Stop Loss: Place a stop below the $1,000 support, around $995, to account for minor wicks. If the price breaks below $1,000, the bullish setup is invalidated.
• Risk/Reward: Targeting $1,067 from $1,007 gives a 60-point gain, with a 12-point risk, yielding a risk/reward ratio of about 5:1.
Scenario 2: Bearish Pullback (Short Opportunity)
• Rationale: The RSI is overbought, and the MACD, Aroon, and ADX suggest short-term bearish momentum. The price may pull back to test lower support levels before resuming the uptrend.
• Entry: Enter a short position if the price fails to hold $1,007 and breaks below with a bearish confirmation (e.g., a strong red candle or break of the moving averages).
• Target: The first target is the $948–$938 support zone (“Fortune AI”). If momentum continues, the price could drop to $850.
• Stop Loss: Place a stop above $1,020 to account for a potential retest of higher levels. This keeps the risk tight.
• Risk/Reward: Targeting $948 from $1,007 gives a 59-point gain, with a 13-point risk, yielding a risk/reward ratio of about 4.5:1.
Key Levels to Watch
• Upside: $1,067 (resistance), $1,100 (psychological level).
• Downside: $1,000 (immediate support), $948–$938 (key support), $850 (lower support).
Risk Management
• Position Sizing: Risk no more than 1–2% of your account on any single trade. For example, if your account is $10,000, your maximum risk per trade should be $100–$200.
• Volatility: The chart indicates increasing volatility (“Green C”). Be prepared for larger price swings and adjust your position size accordingly.
• News Catalysts: Netflix’s stock can be influenced by earnings, subscriber growth, or market sentiment. Since I don’t have access to recent news, you might want to check for upcoming events (e.g., earnings reports) that could impact the stock.
Final Thoughts
The bullish trend on multiple timeframes suggests that buying on dips might be the higher-probability trade, but the overbought RSI and bearish short-term indicators (MACD, Aroon) indicate a potential pullback first. I recommend watching the $1,007 level closely on Monday, April 21, 2025. If it holds as support, a long position could be favorable. If it breaks, consider a short toward $948–$938.
If you’d like me to search for recent news or analyst updates on Netflix to refine this strategy, let me know! Trading is inherently uncertain, so always trade with a plan and manage your risk carefully.

NFLX Wave Analysis – 18 April 2025
- NFLX broke weekly down channel
- Likely to rise to resistance level 1000.00
NFLX recently broke the resistance trendline of the weekly down channel from February, which enclosed the previous primary ABC correction 4, as can be seen below.
The breakout of this down channel accelerated the active impulse wave 1, which belongs to the primary upward impulse wave 5 from the start of April.
Given the clear daily uptrend, NFLX can be expected to rise to the next round resistance level 1000.00, top of the previous wave (B).

Breaking: Netflix ($NFLX) Surges 3% Amidst Topping Q1 Earnings The shares of Netflix (NASDAQ: NASDAQ:NFLX ) is surging 3.5% in Friday's premarket session amidst Q1 earnings beat.
Netflix (NASDAQ: NASDAQ:NFLX ) reported first-quarter earnings that topped analysts’ expectations, sending shares higher in extended trading Thursday, extending the gains to Friday's premarket session.
The streaming giant's revenue grew over 12% YoY to $10.54 billion, above the analyst consensus from Visible Alpha. Net income of $2.89 billion, or $6.61 per share, rose from $2.33 billion, or $5.28 per share, a year earlier, beating Wall Street’s expectations. The period marked the first quarter Netflix did not report subscriber numbers.
Netflix's Gains Come as Subscription Prices Rise
The better-than-expected results came in part due to higher subscription and ad revenues, the company said, along with the timing of expenses.
Netflix had raised prices for its plans in January, hiking its ad-supported plan to $7.99 from $6.99 per month, the standard ad-free plan to $17.99 from $15.49 a month, and its premium plan to $24.99 from $22.99 a month.
Netflix maintained its fiscal 2025 revenue projection of $43.5 billion to $44.5 billion. Analysts on average had expected $44.27 billion. The company's second-quarter revenue forecast of $11.04 billion exceeded Wall Street's estimate of $10.91 billion.
Co-CEO Greg Peters said Netflix expects to double its advertising revenue this year, as the company rolls out its ad tech suite. The suite is live in the U.S. and Canada, with 10 other markets expected in the months to come.
Technical Outlook
As of the time of writing, NASDAQ:NFLX shares are up 3.29% in Friday's premarket session. NASDAQ:NFLX chart pattern has formed a perfect resistant and support point carved out since the 11th of November, 2024. Should NASDAQ:NFLX break the $1064 resistant point, a break out might be imminent for the entertainment giant.
Conversely, failure to break above that point could resort to a cool off to the $800 support point. NASDAQ:NFLX RSI is primed for a breakout as it is not oversold nor overbought but well positioned for a bullish move.

Netflix Pops as Earnings Top Estimates. Are Tariffs a Threat?Netflix NASDAQ:NFLX dropped its first-quarter earnings Thursday after market close and the headlines practically wrote themselves: a record net income, an earnings beat, and a 3% implied jump for the stock at the opening bell. All in a market where the Nasdaq is crying in the corner.
But as always in markets, the big question isn’t “What happened?”—it’s “What could mess this up?”
Ready, set, action: steep tariffs, Donald Trump, and the looming threat of a recession-fueled advertising freeze.
Let’s break down the earnings binge before we channel surf over to the risk segment. Spoiler: Netflix is on a roll—but geopolitical static might still mess with the signal.
🎬 Netflix Hits Record Numbers
The earnings season is picking up the pace. Netflix’s Q1 revenue hit $10.5 billion, up 13% from last year, with net income jumping to a record $2.9 billion. That’s a cool $600 million more than the same quarter last year—and a massive flex with earnings per share at $6.61. Wall Street was only expecting $5.71 a pop.
More importantly, the company raised its full-year revenue forecast to the range of $43.5 billion and $44.5 billion.
💿 How Many New Subs?
In case you're hunting for sub numbers moving forward—don’t bother. Netflix said last quarter they’re done reporting them quarterly. They’d rather focus on what “really matters”: revenue, operating margin, and ad growth.
In Q4 2024, the final quarter with a subscriber growth update, the company pulled off its biggest user-count gain ever: 19 million new accounts , bringing the global total to over 300 million. Not a bad way to drop the mic and ghost the group chat.
🍿 The Ads Are Working. So Are the Price Hikes.
In a move that would usually send churn metrics on a downhill slope, Netflix in January bumped its top-tier plan to $24.99/month in the US. Either that speaks volumes about content quality, or we’ve all collectively accepted that we’ll pay any price to avoid commercials.
That said, ads are quietly becoming Netflix’s next big profit lever. After a rocky launch in late 2022, the ad-supported tier is now gaining serious traction. According to estimates, 43% of new US sign-ups in February 2025 opted for the ad-tier plan, up from 40% in January. Netflix expects to nearly double ad revenue this year.
📺 Is Netflix Recession-Proof?
With interest rates high relative to four years ago, consumer wallets stretched, and geopolitical tension ratcheting up, Netflix Co-CEO Greg Peters had to address the elephant in the earnings room: what happens if people stop spending?
Streaming should survive the storm. As he put it, “Entertainment has historically been pretty resilient in tougher economic times.”
Executives also noted that during downturns, people tend to seek value. Netflix, with its endless scroll, becomes the budget-friendly indulgence of choice. It’s hard to argue with that when you’re five episodes deep into a true-crime docuseries at 3 a.m.
👀 But Then There’s That Nagging Tariff Thing...
While Netflix has so far been insulated from the direct hit of Trump’s revived trade war—most of its costs are content, not commodities—it’s not immune to broader market impact. Tariffs could rattle advertisers, especially if they trigger inflation spikes, slowdowns, or investor anxiety.
Ad budgets are notoriously skittish in volatile times, and if there’s one thing advertisers hate more than bad CPMs, it’s uncertainty. Already, there's chatter that major brands are planning to trim digital spending heading into the second half of the year.
Translation: if tariffs lead to an economic wobble, Netflix’s ad revenue (and by extension, its bullish earnings story) could face a tougher climb.
📢 Leadership Shuffle: No Drama, Just Strategy
In other corporate news, Reed Hastings, the co-founder who brought us DVD mailers, quietly transitioned from executive chair to non-executive chair. It’s more ceremonial than sensational, but it marks a passing of the torch to the current co-CEOs, who clearly have things under control—if this earnings report is any indication.
❤️ Wall Street Loves It—for Now
Netflix NASDAQ:NFLX shares are up 10% year to date, which looks especially shiny next to the Nasdaq’s NASDAQ:IXIC 16% drop. While tech has wobbled under tariff pressure and chip-stock drama ,
Netflix is moving in the opposite direction—proof that profitability, pricing power, and content diversity are still pulling in fresh capital inflows.
But don’t get too comfortable. If tariff fears escalate or ad momentum stalls, Netflix may need to prove all over again that it’s more than just a pandemic darling turned pricing juggernaut.
🎥 Final Frame: Chill Now, but Keep One Eye on Macro
Netflix’s Q1 numbers were promising — but that was just before Trump’s sweeping tariffs rattled global markets.
Added levies, recession risk, and shifting ad budgets could all become plot twists in Netflix’s otherwise upbeat storyline. For now, though, it’s lights, camera, rally.
Your turn: Are you still bullish on Netflix, or are Trump’s tariffs and economic drama changing your channel? Let us know what’s on your watchlist.
