Netflix, Inc. (NFLX): Streaming Innovation at Its BestNetflix, Inc. (NFLX) is a global leader in streaming entertainment, offering a massive library of TV shows, movies, and original content to millions of subscribers worldwide. Known for hit series like Stranger Things and The Crown, Netflix combines great storytelling with cutting-edge technology to deliver seamless viewing experiences. The company’s success is driven by its ability to create high-quality, exclusive content and its focus on expanding into international markets.
Recently, the NFLX stock chart showed a confirmation bar with rising volume, pushing the price into the momentum zone. This signals strong investor interest and potential for continued upward movement.
NFLX trade ideas
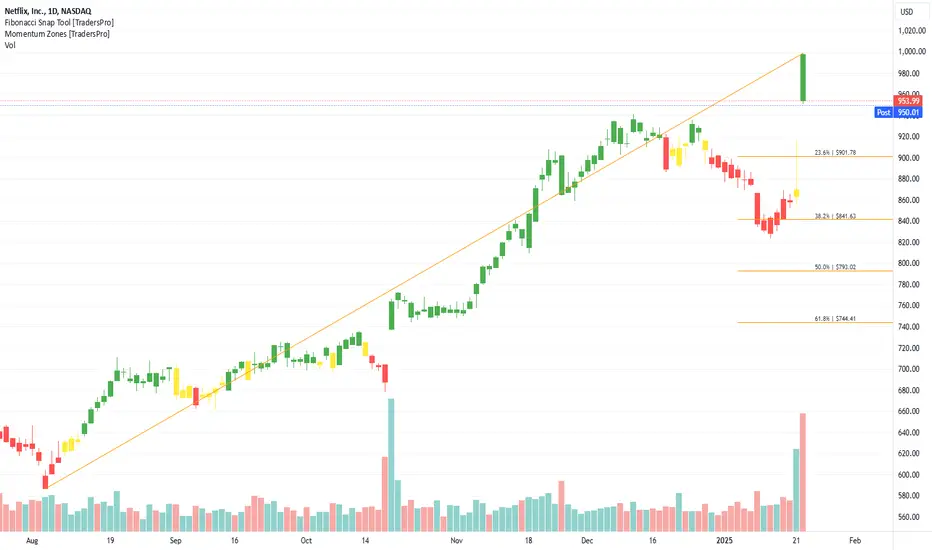
NFLX rocketNFLX will rocket to 1100 after a brief pullback. Previous all time high will be the first place to look for a long trade.
Trade idea:
long = 942
stop = 930
profit = 1100
Options data:
1/31 expiry
Put Volume Total 29,405
Call Volume Total 56,545
Put/Call Volume Ratio 0.52
Put Open Interest Total 16,822
Call Open Interest Total 17,012
Put/Call Open Interest Ratio 0.99
2/21 expiry
Put Volume Total 17,470
Call Volume Total 23,490
Put/Call Volume Ratio 0.74
Put Open Interest Total 34,267
Call Open Interest Total 39,581
Put/Call Open Interest Ratio 0.87
3/21 expiry
Put Volume Total 13,693
Call Volume Total 15,324
Put/Call Volume Ratio 0.89
Put Open Interest Total 33,647
Call Open Interest Total 34,210
Put/Call Open Interest Ratio 0.98

Netflix Can Show a Good ShowHello friends, today i am sharing one trading idea with you all in which i want to share my long view on Netflix with you all so as you all can see that the price is consolidating near a very old resistance and a few weeks back also it has tried to break it, so this time my expectation is that this resistance will be broken and the reasons behind this which i can see are as follows such as repeated attempts to break the resistance, bullish RSI on monthly, daily and weekly charts, good volumes and good sentiments of overall markets. So after the breakout i am looking at the rising trendline resistance as my target for this trade which will be around 950 and for this I would definitely like to see a weekly close above the resistance. You all can follow this idea on your desired timeframe mates.
Some fundamental and suscriptions related data-:
Looking at the last year, Netflix shows a quite strong growth in Revenue. The Revenue has grown by 13.00% in the last year. Measured over the past years, Netflix shows a quite strong growth in Revenue and the Revenue has been growing by 16.38% on average per year.
Netflix has seen many improvements in the last year, including:
Subscriber growth
Netflix added 17 million subscribers in the first half of 2024, bringing its total to about 278 million global subscribers.
Profitability
Netflix's profit margin and operating margin have improved in recent years, and are among the best in the industry.
New subscription tiers
Netflix added lower-priced, advertising-supported subscription packages, which diversified revenue streams and attracted new users.
Crackdown on unpaid account sharing
Netflix cracked down on unpaid account sharing, which helped drive subscriber growth.
Personalized content
Netflix uses its knowledge of what its users like to watch to create customized recommendations.
Simplified navigation
Netflix is testing a new navigation menu that moves from the left side of the screen to the top, and includes a "My Netflix" tab with content curated for the user.
That's all friends hope you like my work and will bosst this publication too, Thanks for reading.

Netflix - Crushed earnings, but now what?!NASDAQ:NFLX
When do we sell? Where are we going?
Netflix crushed recent earnings and have a ton of momentum behind them. I believe this is where we are going...
🎯$1033🎯1107
Not financial advice

Netflix (NFLX): Explosive growth, but caution aheadNetflix ( NASDAQ:NFLX ) is set to open 14% higher after adding a record-breaking 18.9 million subscribers in Q4—nearly double Wall Street’s expectations and well above the early 2020 peak of 15.8 million. These incredible numbers have sparked a strong market reaction, and the enthusiasm is well-justified.
Following this update, we’ve re-evaluated the chart. While we anticipate the potential for more upside, it’s unlikely that NASDAQ:NFLX will continue climbing without a significant correction at some point. The trendline since May 2022 has proven its importance, serving as resistance nine times before being flipped into support and holding firm on a key retest.
Currently, Netflix is approaching the significant psychological level of $1,000. If this level is reclaimed, a further push toward $1,070 and even $1,300 could materialize. However, we’re exercising caution as major levels and target zones have already been achieved. There is a chance—albeit slim—that today’s earnings gap could mark the top of wave ((v)) and wave 3.
For now, we’re waiting for further developments and will decide our next steps as the stock’s trajectory becomes clearer. Stay tuned for updates.

NETFLIX New Bullish Leg to $1140 has started.Netflix (NFLX) has been trading within a long-term Channel Up since the October 18 2023 Low. Every time that the price broke below and later recovered the 1D MA50 (blue trend-line), it was the most efficient buy signal of the pattern.
This is what took place yesterday, we had the first recovery above the 1D MA50 since the break below it on Jan 10. Along with the inevitable Bullish Cross below the 0.0 level on the 1D MACD (which again has been the best buy signal all these years), we expect the new technical Bullish Leg of the Channel Up to start.
So far we've had 5 core Bullish Legs and as you can see the tend to rise by roughly the same amount two at a time. The first two have been roughly +40%, then the next two +25% and the one before +38.71%. It is fair to assume that the one that has just started will be of around +38.71% too. As a result, we can place our Target a little lower for less risk and aim at $1100.
-------------------------------------------------------------------------------
** Please LIKE 👍, FOLLOW ✅, SHARE 🙌 and COMMENT ✍ if you enjoy this idea! Also share your ideas and charts in the comments section below! This is best way to keep it relevant, support us, keep the content here free and allow the idea to reach as many people as possible. **
-------------------------------------------------------------------------------
💸💸💸💸💸💸
👇 👇 👇 👇 👇 👇

Netflix Stock Up 14% Premarket Following Record-Breaking QuarterNetflix Inc. ( NASDAQ:NFLX ) is making headlines with a significant 14% surge in premarket trading, fueled by the company’s record-breaking fourth-quarter performance. This milestone, driven by live sports programming and the return of its flagship series, *Squid Game*, marks a pivotal moment for the streaming giant. Here’s an in-depth look at the technical and fundamental aspects behind this remarkable rally.
Record Subscriber Growth
Netflix added an unprecedented 18.9 million subscribers in Q4 2024, bringing its global subscriber base to over 300 million. This growth, more than double Wall Street’s expectations, surpasses the company’s previous record of 15 million new subscribers in Q1 2020. Notably, this quarter marked the final time Netflix will report subscriber numbers, signaling a shift toward emphasizing financial metrics such as revenue and profit.
Revenue and Profit Surge
Netflix reported a 16% year-over-year increase in revenue, reaching $10.2 billion for the quarter—its most substantial growth since 2021. For 2025, the company projects revenue of up to $44.5 billion, a 14% increase, with an operating margin of 29%. These robust financials underscore the company’s ability to sustain growth amidst a competitive streaming landscape.
Key Drivers of Growth
1. Live Programming: Netflix’s venture into live sports, including its first major National Football League games and the Jake Paul vs. Mike Tyson boxing match, has proven to be a game-changer. These events attracted record sign-ups, highlighting the potential of live programming to drive subscriber growth.
2. Content Strategy: The return of Squid Game and the success of the hit movie Carry-On further bolstered subscriber numbers. Netflix’s diverse programming mix ensures broad audience appeal, while no single title dominated subscriber additions.
3. Password Sharing Crackdown: The company’s crackdown on password sharing contributed to its best-ever year for subscriber growth, with 41 million new customers added in 2024.
4. Advertising Revenue: While still in its early stages, Netflix’s advertising business is gaining traction. A majority of new subscribers in markets with ad-supported tiers opted for this model, signaling growing acceptance of ad-supported streaming.
Price Increases
Netflix is boosting prices across several markets, including the U.S., Canada, Portugal, and Argentina. The most popular U.S. plan now costs $17.99 per month, a $2.50 increase. These price hikes are expected to contribute significantly to revenue growth in 2025.
Market Reaction
Netflix shares closed at $869.68 in New York on Tuesday and are set to open with a 14% gain in premarket trading. If sustained, this would mark the stock’s most significant gain since October 2023.
Technical Analysis
As of premarket trading, NASDAQ:NFLX is up 14.70%, reflecting bullish sentiment driven by the record-breaking quarterly performance. The Relative Strength Index (RSI) was at 48.99 before this surge, indicating the stock was neither overbought nor oversold.
Bullish Gap-Up Pattern
The premarket rally sets the stage for a potential gap-up pattern at market open. This technical phenomenon occurs when a stock’s opening price is significantly higher than its previous closing price. Historically, gap-ups are strong bullish indicators, often followed by brief pullbacks as traders digest the news.
Resistance and Support Levels
- Resistance: The stock is eyeing its one-month high as the next resistance level. A breakout above this point could trigger further bullish momentum.
- Support: Immediate support lies at the $776 level. A breakdown below this level could lead to a retest of lower support zones, but this scenario appears less likely given the current bullish momentum.
Market Outlook
With the broader stock market expected to rally following Donald Trump’s inauguration earlier this week, NASDAQ:NFLX is poised to capitalize on favorable market conditions. The combination of strong fundamentals and bullish technical indicators suggests a continued upward trajectory in the near term.
Conclusion
Netflix’s record-breaking quarter underscores its resilience and adaptability in an evolving streaming landscape. The company’s strategic focus on live programming, diverse content offerings, and advertising is paying off, driving subscriber growth and revenue to new heights. From a technical perspective, the stock’s premarket surge and bullish patterns point to a strong start for 2025.
As Netflix pivots toward prioritizing financial metrics over subscriber numbers, investors have much to look forward to in terms of sustained growth and profitability. With NASDAQ:NFLX setting the stage for a historic year, the streaming giant remains a compelling investment opportunity for traders and long-term investors alike.

NFLX .. Netflix lines and Gann analysisJust put some things together and show each breakdown in 30 min and 1 day increments...make sure to play with the log function on the bottom right in the scale...can change entry and exit points substantially...
The last is my signature Cyqo-Cpyder-Nest
all 30 min...
all 1 day...
The final project....a mess.. or a Nest:

$NFLX 8% Expected Move for EarningsNASDAQ:NFLX 8% Expected Move for Earnings
Alright... earnings tonight and the expected move is 8%... let's get this earnings season started 🙌🏼

NflxAs you can see the weekly resistance (Yellow) from 2023 has turned into support..
Breaks 820 and price heads back to monthly support (White) around 700..
Bounces on earnings and we retest 880-900...
700 will come though, either Q1 or Q2...
When ever this wedge breaks you'll be able to get NFLX for 400-500 bucks

NETFLIX : Everybody want to go long!!. Do we enter long??Netflix has an impeccable technical aspect to date. NO ONE looking at the chart could have any doubts that its fundamentals are good and that it is IMPOSSIBLE not to invest in this stock. The problem comes when we are in a hurry and especially if we leverage ourselves. RUSHES are not good and LEVERAGE must be managed correctly.
--> What is basic in a leveraged operation?
Enter after a PULLBACK. If we do not enter after a pullback, our entry, although it could be good, would run the risk of accumulating MANY LOSSES or of SKIPPING THE STOP LOSS. That is why it is basic in a leveraged operation to enter after a pullback.
--> Has Netflix made a pullback?
That's right!! The pullback it has made is almost 50% Fibonacci and therefore, we are now ready to enter long. BUT, is it a good time to enter long? It depends on the strategy one has. In IVO we DO NOT ENTER with a pullback, we enter after a pullback + a bullish signal + another confirmation signal.
--> Has the chart given us any bullish warning?
Yes. On Friday at 3:30 pm the chart gave us bullish MOMENTUM ( Bull ) in H4 timeframe.
What are we missing? That the FORCE also turns bullish ( Bull ). An AGGRESSIVE investor profile WOULD ALREADY ENTER LONG, but if our RISK profile is LESS AGGRESSIVE, we have to wait for the FORCE to indicate bullish ( Bull ).
--> When will the FORCE turn bullish?
With a candle close in H4 timeframe above 884. At that point the FORCE will turn bullish and the highs will be attacked in hours-days.
--> Any problems along the way?
Yes. Tomorrow Tuesday 21st the results will be published and if they are unfavorable, the price could continue to fall, but if the results are as expected or better than expected, the price will easily exceed 884.
------------------------------------------------
Strategy to follow:
ENTRY: We will open 2 long positions if the H4 candle closes above 884.
POSITION 1 (TP1): We close the first position in the 935 area (+5.7%)
--> Stop Loss at 853 (-3.5%).
POSITION 2 (TP2): We open a Trailing Stop type position.
--> Initial dynamic Stop Loss at (-3.5%) (coinciding with 853 of position 1).
--> We modify the dynamic Stop Loss to (-1%) when the price reaches TP1 (935).
-------------------------------------------
SET UP EXPLANATIONS
*** How do you know which 2 long positions to open? Let's take an example: If we want to invest 2,000 euros in the stock, what we do is divide that amount by 2, and instead of opening 1 position of 2,000, we will open 2 positions of 1,000 each.
*** What is a Trailing Stop? A Trailing Stop allows a trade to continue gaining value when the market price moves in a favorable direction, but automatically closes the trade if the market price suddenly moves in an unfavorable direction by a certain distance. That certain distance is the dynamic Stop Loss.
-->Example: IF the dynamic Stop Loss is at -1%, it means that if the price drops by -1%, the position will be closed. If the price rises, the Stop Loss also rises to maintain that -1% in the rises, therefore, the risk is increasingly lower until the position becomes profitable. In this way, very strong and stable price trends can be exploited, maximizing profits.

How To Use This 3 Step System When Trading NetflixThe challenge with trading stocks is that you
are not supposed to use high margins..
in this case you should not use more than 3X
However, there is an advantage that you can use to
take advantage of this stock NASDAQ:NFLX .
You can see that if you look at the chart
There is a coming earnings report.
This is a strategy I learned from Tim Sykes
its called earnings winners..
Now it doesn't always work but when it does
you will see a gain..a gap
if the gap doesn't happen
then you can still hold it as an investment
but Ideally, a gap should happen.
I am guessing it's based on the market reaction
to the CPI reports.
Right now the stock market is in
a recovery mode and so in
this earnings season you are going to
see gaps like no man's business
This stock NASDAQ:NFLX
is one of them gaps you are going to
see
now again it might or it might not
happen
either way you can hold as an investment
This is called the rocket booster strategy
it has 3 steps:
-The price has to be above the 50 EMA
-The price has to be above the 200 EMA
-The price has to gap up to a catalyst
In this case the catalyst is the earnings report.
In order to learn more rocket boost this content right now
Disclaimer:Trading is risky, please
learn risk management and profit-taking
strategies.

NFLX: Testing Resistance Amid Recovery🔥 LucanInvestor's Strategy:
🩸 Short: Below $857.78, targeting $840 and $820. The MACD remains bearish, suggesting downside risks persist.
🩸 Long: Above $898.23, aiming for $880 and $900. A breakout above this resistance will confirm bullish continuation.
🔥 LucanInvestor's Commands:
🩸 Resistance: $898.23 — Key level for bulls to breach for sustained upside.
🩸 Support: $857.78 — Crucial support; losing this level may lead to further selling pressure.
Netflix (NFLX) is showing signs of recovery as it trades above the 9-day EMA ($857.78). However, MACD is still negative, signaling caution. A breakout above $898.23 would confirm bullish momentum and open the path to higher levels. Failing to hold above $857.78 could trigger a retest of lower supports.
👑 "In markets, strength is measured by resilience through resistance." — LucanInvestor

Netflix (NFLX) AnalysisNetflix recently experienced a pullback, dropping to a significant demand zone around $820-$850, which has historically acted as strong support. This drop has attracted traders eager to capitalize on the current discounted price, anticipating a potential bullish rebound.
Looking at the chart:
1️⃣ Previous Earnings Reaction: The last earnings report sparked a 12% spike, showcasing Netflix’s potential for strong momentum following positive results.
2️⃣ Demand Zone Support: The stock is consolidating around this key level, indicating that buyers are stepping in to defend it.
3️⃣ Bullish Expectations: Traders are positioning themselves for the upcoming earnings report, expected on 01/21/2025 after market close, which could act as a major catalyst for upward movement.
If the earnings report meets or exceeds expectations, we could see Netflix rally toward all-time highs, with the first resistance zone around $940 and a longer-term target of $1,020.

NFLX: Bearish Momentum as Price Tests Support Levels🔥 LucanInvestor's Strategy:
🩸 Short: Below $863.09, targeting $820 and $780. The MACD is deeply bearish, and the price trading under the 9-day EMA strengthens the downside scenario.
🩸 Long: Above $880, aiming for $899 and $920. Bullish recovery requires a strong volume-driven breakout above the 9-day EMA.
🔥 LucanInvestor's Commands:
🩸 Resistance: $863.09 — The 9-day EMA level acting as immediate resistance. Breaking this is critical for upside potential.
🩸 Support: $831.57 — The nearest support; failure to hold may lead to further selling toward lower targets.
Netflix (NFLX) has entered a bearish trend, with MACD showing significant negative momentum and the price firmly below the 9-day EMA. Despite long-term strength above the 200-day EMA ($727.96), short-term pressure dominates, suggesting cautious positioning.
👑 "In the storm of uncertainty, precision becomes your greatest weapon." — LucanInvestor

NFLX reference areaHello dear investors
First we are yet into our uptrend corridor but you should keep eyes on my reference area :
As you see on my modest chart the yellow area is the the battle zone between buyers and sellers:
- if price is above it, you are safe as a buyer
- if price becomes under the zone we can say that sellers had won the battle and they will push the market down and down
good luck

NFLX: Bearish Trend and Downside Risk🔥 Potential Price Targets:
🩸 Near-term Goal: $837.69 (1-2 months)
🩸 Long-term Goal: $878.60 (3-4 months)
🔥 LucanInvstor's Strategy:
🩸 Short: Below $837.69, targeting $820 and $800. The MACD remains negative, and the price is below the 9-day EMA, indicating further downside.
🩸 Long: Above $878.60, targeting $885 and $900. A break above resistance could trigger a rally, but short-term bearish momentum suggests caution.
🔥 LucanInvstor's Commands:
🩸 Resistance: $878.60 — A key resistance level; a break above this could lead to further upside.
🩸 Support: $837.69 — A critical support level; a breakdown below this could trigger further declines.
Netflix is under bearish pressure in the short term, with negative momentum confirmed by the MACD. A breakdown below support could lead to further downside, while a breakout above resistance may lead to a potential rally.
👑 "In times of uncertainty, clarity in strategy is paramount."

NETFLIX: I want to enter!! When to enter??The question we all ask ourselves in companies with a similar graphic appearance to Netflix is:
--> I WANT TO ENTER!! WHEN TO ENTER?
We are all eager to get into Netflix. No one wants to miss out on the gains that could accumulate during 2025, but one of the factors to consider, and for that, YOU MUST BE VERY CALM, is PATIENCE.
That is to say, when the price is in a retracement phase, as is the case with Netflix, no one is a fortune teller to know when it will end. We can identify important support areas, but nobody knows with 100% certainty if they will be broken down, or conversely, if they will be the turning point for a new upward impulse.
--> What point is Netflix at now?
If we look at the H4 chart, the trend is still clearly bullish, but the price is in a retracement phase. The area it is currently in is the first important support zone; that is, IF THIS AREA HOLDS, and the price BREAKS ABOVE THE RED TREND LINE on the chart, we would get the first bullish signal (Bull), and it would be the start of a new upward impulse towards new highs. But for now, we need to wait for the price to indicate a turn upwards because if we enter now, it could lose support and continue to decline.
--> SUMMARY
PATIENCE and waiting for the chart to show us an upward turn (Bull). When this happens, I will publish an analysis with the ENTRY SETUP again.

NETFLIX: testing the 1D MA50. Buy?Netflix is marginally bearish on its 1D technical outlook (RSI = 43.757, MACD = 4.950, ADX = 42.375) as the December correction is testing now the 1D MA50. Technically this has been the trend's support since mid August 2024. The 2 year Channel Up offers useful conclusions here. Each of its past January months (2023 and 2024) saw a surge of +38% from their closest low. If this is repeated again, then the price will test the Channel's top. Aim for that +38% rise (TP = 1,200).
## If you like our free content follow our profile to get more daily ideas. ##
## Comments and likes are greatly appreciated. ##

NETFLIX bye bye monthly topping tail candle right at the resistance trend from previous highs, expect major downside

NFLX 4H TimeframeI believe Netflix still has upside potential.
Wave Analysis: We are nearing the end of the current correction (green c / blue 4), which should lead to the next upward movement (blue 5 / black 3).

NFLX IRON CONDOR Selling FEB IRON CONDOR
1015/1020
750/745
FEB IRON CONDOR
IVR = 78.1
The 1015/1020 FEB Call spread is the last in the option chain that is $5 wide.
Strikes above 1020 are all $20 wide .

NFLX Elliot Wave, Wyckoff Method with Head & Shoulders PatternIt is not always easy to time a short, but looking at this chart I will share a couple of confluences that are interesting from a technical analysis point of view.
First, there is a 5 wave completion of the Elliot Wave pattern.
Then, based on the Wyckoff method of accumulation to distribution, we can gauge areas of UTAD and LPSY takes place.
Lastly, we can form a Head & Shoulders pattern (a small one) and a neckline.
One can carefully enter the short after the break and retest of the trendline, which is the safest way.
