$NVDA: Cycle-Wired Levels🏛️ Research Notes
The fact that the angle of linear connection between 3rd degree points (fractal hierarchy) acted multiple amout of times as support and eventually resistance from which tariff drop happened establishing bottom and expanding from there.
That means if we were to justify the
Key facts today
Next report date
—
Report period
—
EPS estimate
—
Revenue estimate
—
11.8 PLN
296.88 B PLN
531.58 B PLN
23.41 B
About NVIDIA
Sector
Industry
CEO
Jen Hsun Huang
Website
Headquarters
Santa Clara
Founded
1993
FIGI
BBG01NX6K372
NVIDIA Corp engages in the design and manufacture of computer graphics processors, chipsets, and related multimedia software. It operates through the following segments: Graphics Processing Unit (GPU), Tegra Processor, and All Other. The GPU segment comprises of product brands, which aims specialized markets including GeForce for gamers; Quadro for designers; Tesla and DGX for AI data scientists and big data researchers; and GRID for cloud-based visual computing users. The Tegra Processor segment integrates an entire computer onto a single chip, and incorporates GPUs and multi-core CPUs to drive supercomputing for autonomous robots, drones, and cars, as well as for consoles and mobile gaming and entertainment devices. The All Other segment refers to the stock-based compensation expense, corporate infrastructure and support costs, acquisition-related costs, legal settlement costs, and other non-recurring charges. The company was founded by Jen Hsun Huang, Chris A. Malachowsky, and Curtis R. Priem in January 1993 and is headquartered in Santa Clara, CA.
Related stocks

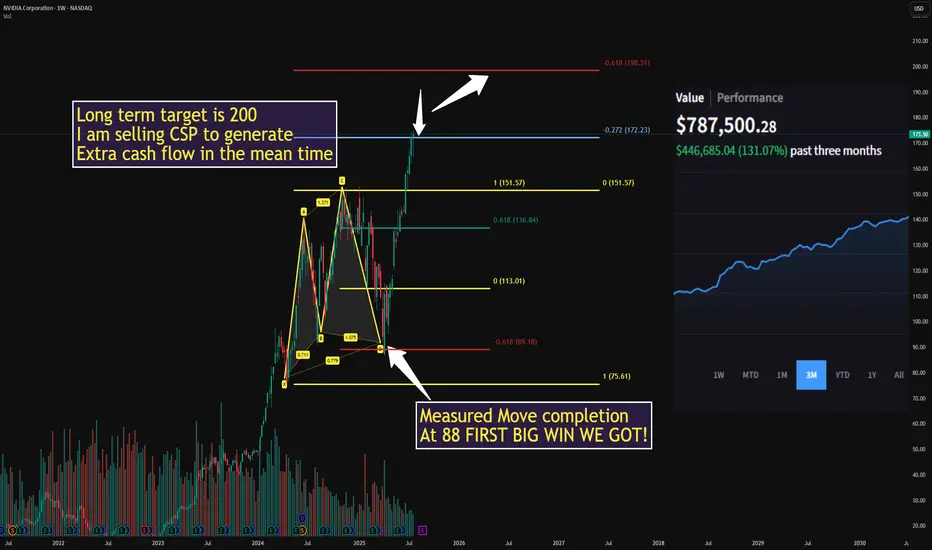
$NVDA ONCE IN A LIFETIME from 88 to 174 BOOM!WE crushed it using the 618 measured move from 88 to 174 in April
Next target is 200 and I am waiting for a decent pull back
In the mean time I will sell puts to generate cash flow, I will alert my next buy here
NO CHARGE all I ask is drop a LIKE
NVDA Bullish Weekly Trade Setup** – 2025-07-29
📈 **NVDA Bullish Weekly Trade Setup** – 2025-07-29
🚀 *"Momentum meets money flow!"*
### 🔍 Market Snapshot:
* 💥 **Call/Put Ratio**: 2.47 → Bullish sentiment confirmed
* 🧠 **RSI**: Rising on Daily & Weekly → Momentum building
* 🔕 **Low VIX**: Favors call strategies (cheap premiums)
* ⚠️ **Caution*

99% of people buying $NVDA don't understand this:🚨99% of people buying NASDAQ:NVDA don't understand this:
NASDAQ:GOOGL : “We’re boosting AI capex by $10B.”
Wall Street: “Cool, that’s like $1B or 0.06 per share for $NVDA.”
So from $170.50 at the time of news to $170.56 right?
No.
NASDAQ:NVDA trades at 98× earnings. So that $0.06? Turns in

NVDA: Last week of July Just my thoughts on NVDA.
Not advice of course.
As always, trade safe and have a great weekend!

Nvidia Just Under Major SupportNvidia seems to have been pulled down by the Dow just like Apple as both are just under major support. I'm sorry for my previous Nvidia chart that drew support near 140, I recognize where I screwed up, but this chart should be good. Fortunately actual 117 support wasn't that far below and my NVDA is

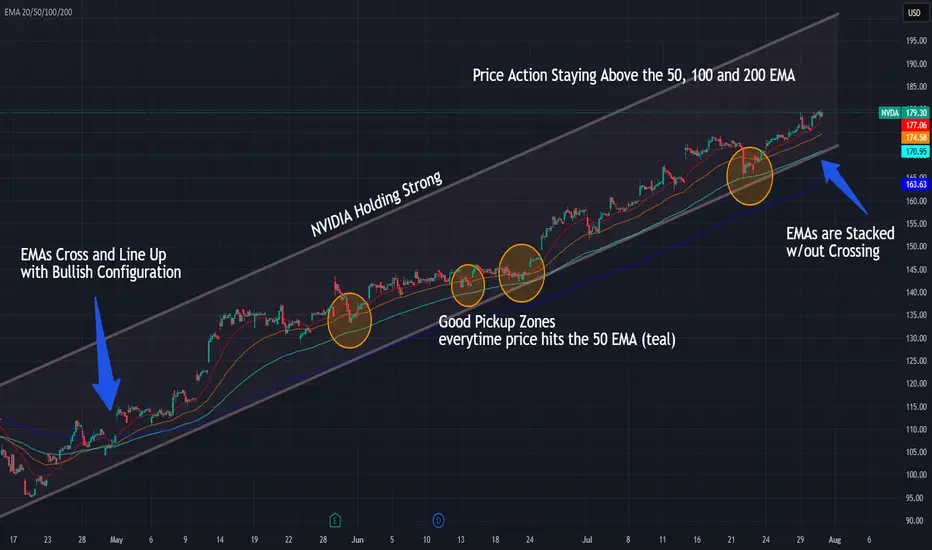
NVIDIA Riding the 50 EMA — Trend Still IntactNVDA continues to respect the rising channel while price holds above the 50, 100, and 200 EMAs — with each 50 EMA touch offering solid entries.
📌 Bullish EMA structure: 20/50/100/200 stacked clean
📌 50 EMA = key support and entry zone
⏱️ Timeframe: 1H
#nvda #stocks #ema #swingtrading #bullishtrend
Elliott Waves indicate a possible correction.We may be at a peak, and a correction within the second wave could be approaching. This is suggested by Elliott Wave theory, as well as divergence on indicators and technical analysis patterns.

NVDA-the AI TitanNVIDIA (NVDA) continues to dominate the AI semiconductor space and remains one of the strongest momentum names in the market. After reaching new highs, price action is now offering a clean multi-tiered entry opportunity for swing traders positioning for the next leg up.
Entry Points
✅ $160 – Breako

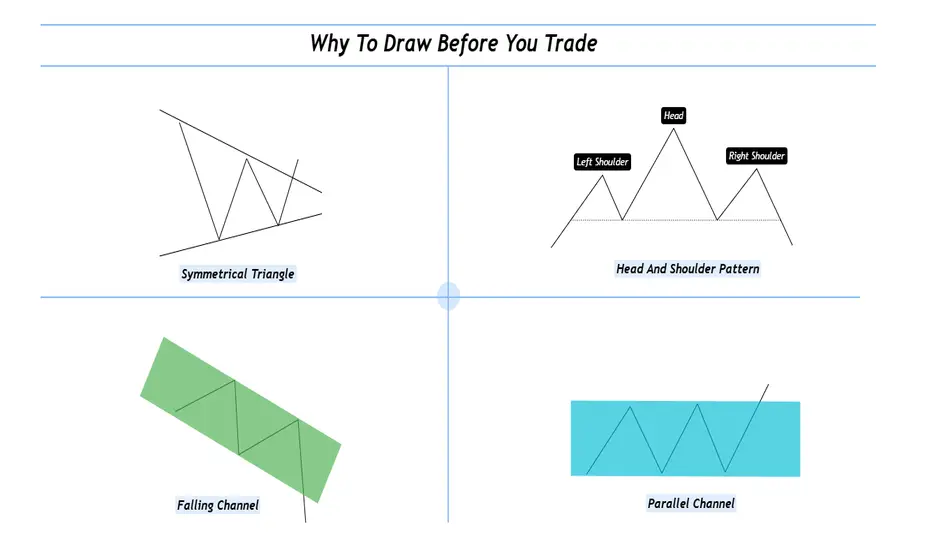
Why To Draw Before You Trade ?Hello fellow traders and respected members of the trading community, In a fast paced market dominated by automation and algorithms, we often forget the value of simply picking up a tool and drawing on our charts. Let’s revisit why this fundamental habit still holds the power to sharpen our edge and
See all ideas
Summarizing what the indicators are suggesting.
Neutral
SellBuy
Strong sellStrong buy
Strong sellSellNeutralBuyStrong buy
Neutral
SellBuy
Strong sellStrong buy
Strong sellSellNeutralBuyStrong buy
Neutral
SellBuy
Strong sellStrong buy
Strong sellSellNeutralBuyStrong buy
An aggregate view of professional's ratings.
Neutral
SellBuy
Strong sellStrong buy
Strong sellSellNeutralBuyStrong buy
Neutral
SellBuy
Strong sellStrong buy
Strong sellSellNeutralBuyStrong buy
Neutral
SellBuy
Strong sellStrong buy
Strong sellSellNeutralBuyStrong buy
Displays a symbol's price movements over previous years to identify recurring trends.
NVDA4971919
NVIDIA Corporation 3.7% 01-APR-2060Yield to maturity
6.00%
Maturity date
Apr 1, 2060
NVDA4971918
NVIDIA Corporation 3.5% 01-APR-2050Yield to maturity
5.94%
Maturity date
Apr 1, 2050
NVDA4971917
NVIDIA Corporation 3.5% 01-APR-2040Yield to maturity
5.35%
Maturity date
Apr 1, 2040
US67066GAN4
NVIDIA 21/31Yield to maturity
4.62%
Maturity date
Jun 15, 2031
US67066GAE4
NVIDIA 2026Yield to maturity
4.35%
Maturity date
Sep 16, 2026
NVDA4971916
NVIDIA Corporation 2.85% 01-APR-2030Yield to maturity
4.10%
Maturity date
Apr 1, 2030
NVDA5203204
NVIDIA Corporation 1.55% 15-JUN-2028Yield to maturity
3.96%
Maturity date
Jun 15, 2028
See all NVDA bonds
Curated watchlists where NVDA is featured.


Frequently Asked Questions
The current price of NVDA is 645.4 PLN — it has decreased by −4.71% in the past 24 hours. Watch NVIDIA stock price performance more closely on the chart.
Depending on the exchange, the stock ticker may vary. For instance, on GPW exchange NVIDIA stocks are traded under the ticker NVDA.
NVDA stock has risen by 1.16% compared to the previous week, the month change is a 15.23% rise, over the last year NVIDIA has showed a 32.80% increase.
We've gathered analysts' opinions on NVIDIA future price: according to them, NVDA price has a max estimate of 937.66 PLN and a min estimate of 375.07 PLN. Watch NVDA chart and read a more detailed NVIDIA stock forecast: see what analysts think of NVIDIA and suggest that you do with its stocks.
NVDA reached its all-time high on Jul 18, 2025 with the price of 651.1 PLN, and its all-time low was 317.3 PLN and was reached on Apr 7, 2025. View more price dynamics on NVDA chart.
See other stocks reaching their highest and lowest prices.
See other stocks reaching their highest and lowest prices.
NVDA stock is 7.51% volatile and has beta coefficient of 2.24. Track NVIDIA stock price on the chart and check out the list of the most volatile stocks — is NVIDIA there?
Today NVIDIA has the market capitalization of 15.90 T, it has increased by 5.14% over the last week.
Yes, you can track NVIDIA financials in yearly and quarterly reports right on TradingView.
NVIDIA is going to release the next earnings report on Aug 27, 2025. Keep track of upcoming events with our Earnings Calendar.
NVDA earnings for the last quarter are 3.06 PLN per share, whereas the estimation was 2.79 PLN resulting in a 9.89% surprise. The estimated earnings for the next quarter are 3.74 PLN per share. See more details about NVIDIA earnings.
NVIDIA revenue for the last quarter amounts to 166.56 B PLN, despite the estimated figure of 163.81 B PLN. In the next quarter, revenue is expected to reach 171.39 B PLN.
NVDA net income for the last quarter is 70.97 B PLN, while the quarter before that showed 89.99 B PLN of net income which accounts for −21.13% change. Track more NVIDIA financial stats to get the full picture.
Yes, NVDA dividends are paid quarterly. The last dividend per share was 0.04 PLN. As of today, Dividend Yield (TTM)% is 0.02%. Tracking NVIDIA dividends might help you take more informed decisions.
NVIDIA dividend yield was 0.03% in 2024, and payout ratio reached 1.16%. The year before the numbers were 0.03% and 1.34% correspondingly. See high-dividend stocks and find more opportunities for your portfolio.
As of Aug 3, 2025, the company has 36 K employees. See our rating of the largest employees — is NVIDIA on this list?
EBITDA measures a company's operating performance, its growth signifies an improvement in the efficiency of a company. NVIDIA EBITDA is 333.59 B PLN, and current EBITDA margin is 63.85%. See more stats in NVIDIA financial statements.
Like other stocks, NVDA shares are traded on stock exchanges, e.g. Nasdaq, Nyse, Euronext, and the easiest way to buy them is through an online stock broker. To do this, you need to open an account and follow a broker's procedures, then start trading. You can trade NVIDIA stock right from TradingView charts — choose your broker and connect to your account.
Investing in stocks requires a comprehensive research: you should carefully study all the available data, e.g. company's financials, related news, and its technical analysis. So NVIDIA technincal analysis shows the buy rating today, and its 1 week rating is buy. Since market conditions are prone to changes, it's worth looking a bit further into the future — according to the 1 month rating NVIDIA stock shows the neutral signal. See more of NVIDIA technicals for a more comprehensive analysis.
If you're still not sure, try looking for inspiration in our curated watchlists.
If you're still not sure, try looking for inspiration in our curated watchlists.