NVDA When the Dome is Pierced but the Crowd Doesn’t Cheer.NVDA pierced the dome. But the market didn’t roar—just whispered.
You’d expect prices to leap on headlines like “hyperscalers buying hundreds of thousands of H100s and B200s.” But instead, we’ve seen price hesitations… rejection wicks… and a quiet fade into the resistance box.
That’s the tell.
The “bull case” is loud—CoreWeave, Meta, and Microsoft are all investing capex in datacenter growth.
Headlines scream demand.
Analysts raise price targets.
AI buildout is the macro story.
And yet… NVDA can’t sustain above 137.
Technically, this is what I'm seeing:
A clear inverted dome pattern—price pierced through, but volume didn’t confirm.
Rejection within the gray box: 134–137 remains a trap zone.
Rising wedge structure beneath, with weakening RSI momentum.
Key levels to watch:
137.50: Failure here confirms the fakeout.
134.28: break below, and the dome reasserts control.
130.64: losing this brings 119.59 into play—fast.
Fundamentally, the risk is timing:
Much of the demand for NVDA’s next-gen chips is already pre-booked.
Margins on the newer nodes may face pressure.
The buyer base is concentrated: a few hyperscalers dictate 80% of the flow.
If AI expectations plateau—even temporarily—valuation multiple compression is severe.
And then there’s the macro:
10Y and 30Y yields are pushing higher after a soft CPI print.
Moody’s downgrade lingers in the background.
Japan’s bond market is wobbling.
The bond lords are watching—and if they whisper “not at these yields”, risk assets will reprice.
This isn’t about fear. It’s about understanding silence.
When the loudest news doesn’t move price, something else is pulling strings.
Positioning note:
I hold puts. 5 contracts. Small size, but high conviction setup.
This isn’t just about charts—it’s about recognizing when perception has outpaced inflow, and when liquidity begins to vote.
The dome was pierced.
But without volume, it’s just vapor.
And when vapor meets gravity, price falls—silently.
NVDA trade ideas


NVIDIA Breaks Out - Is a Bigger Rally Coming?NVIDIA Breaks Out - Is a Bigger Rally Coming?
NVIDIA has broken out of a bullish triangle pattern, signaling that it might be ready to climb higher. In my view, the bottom was reached at 86.00, as even market pressures from Trump couldn't push it down further.
NVIDIA seems to be waiting for more details on the US-China trade deal before making a stronger upward move.
If positive developments emerge, it could trigger a bigger bullish wave, lifting the stock even higher.
You may find more details in the chart!
Thank you and Good Luck!
❤️PS: Please support with a like or comment if you find this analysis useful for your trading day❤️

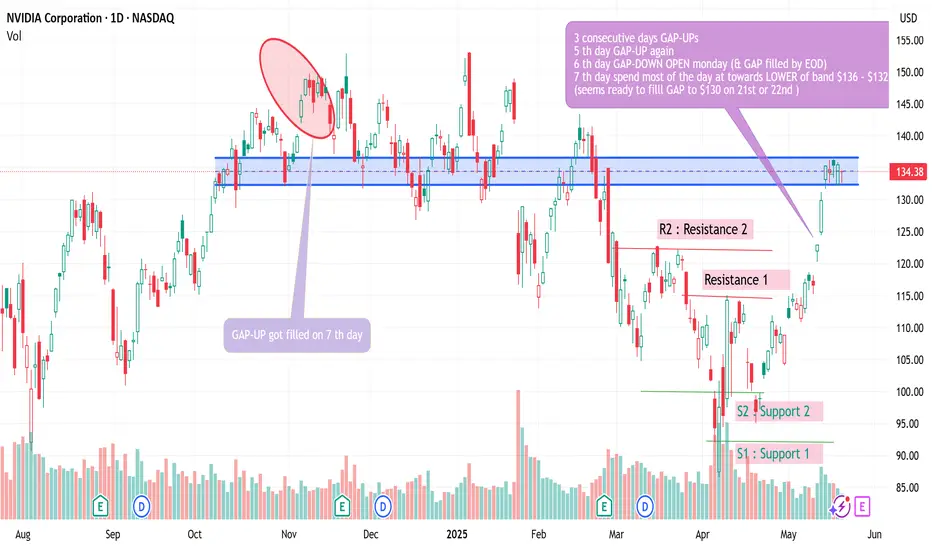
NVDA GAP-UPS on 3 consecutive daysNVDA GAP-UPS on 3 consecutive days
we had a gap up in the past, that got filled on 7 th day
NVDA GAP-UPS on 3 consecutive days
NVDA Still a Monster, But I’m Not Chasing It Just YetNVIDIA is sitting around $135.57 right now, and yeah—fundamentally, it’s crushing it. Revenue growth is off the charts (over 114% YoY) and the data center segment alone pulled in $35B+ last quarter. AI is the fuel, and NVDA is the engine.
That said… we’re getting into overheated territory.
Technically, price is way above its 50/100/200 EMAs, and the RSI is up in the 70s, so we’re clearly in overbought land. Can it push higher? Sure. But I’m not a fan of chasing candles when the chart is screaming “cooldown incoming.”
If we get any weakness or macro jitters (tariffs, earnings nerves, etc.), I’ll be watching for potential entries in the $125–98zone. If we drop into that range with strong volume reaction, I’ll start scaling in.
On the geopolitical front: yeah, the FWB:15B impact from U.S.–China restrictions isn’t nothing—but NVDA’s already moving to offset that with partnerships (like the Saudi AI deal). This isn’t a company sitting still.
📌 Bottom Line:
Long-term, I’m bullish. Short-term, I’m cautious. I’d rather miss a little upside than buy the top and get trapped in a pullback. Let the trade come to you.
Disclaimer: This isn’t financial advice—just sharing my own playbook. Always do your own research and manage risk accordingly.

NVIDIA The 1W MA100 rebound is targeting $225 at least.NVIDIA Corporation (NVDA) broke last week above its 1W MA50 (blue trend-line) for the first time in 2.5 months and all this is generated by April's bottom rebound on the 1W MA100 (green trend-line).
The 1W MA100 has been intact since January 23 2023, so this rebound technically initiates a new Bullish Leg. Since the December 2018 bottom (previous U.S. - China Trade War), the minimum rise on such a Bullish Leg has been +156.11%. As a result, NVIDIA can now target $225 at least before the end of 2025.
-------------------------------------------------------------------------------
** Please LIKE 👍, FOLLOW ✅, SHARE 🙌 and COMMENT ✍ if you enjoy this idea! Also share your ideas and charts in the comments section below! This is best way to keep it relevant, support us, keep the content here free and allow the idea to reach as many people as possible. **
-------------------------------------------------------------------------------
💸💸💸💸💸💸
👇 👇 👇 👇 👇 👇

Interesting NVDA by DXY Pitchfork analysisNot much to say... view other posts/ideas of mine to see what the whole idea of stock/DXY is used
I do a bunch of stuff on the lower chart, Stock/DXY, and translate it point to point on price chart...
here is the 4hr chart in closer view:
FOMO, FOMO, FOMO , all rushing in to buy NVDASo CEO of NVDA has given an impressive speech recently. Read here
And the forum is full of optimism and hype about the share price going to the moon. We have seen this before and it is anyone guess what happens after it reaches the resistance level at 149.28. Will it break out and continue the rally much to the excitement and bet of many investors/traders? Or would there be some form of retracement perhaps due to the downgrading of the US ratings to AA?
I will not chase the high price as it it 3/4 to the top , leaving little meat to the profits and probability of going higher remains unknown but probability of it reversing half or towards support at 91.44 is a possibility.
Thus, I will not be looking at this counter for now. However, I am invested in the VOO ETF (replicating SPX) so indirectly, I am vested in Nvidia.
Fundamentally, this company is also overvalued from looking at its balance sheet. Of course, if the earning growth could match up, the share price can still continue to rally especially it is also a popular stock amongst many retail investors.

Options Trade Idea: NVDA $135 PUT – Exp. May 23, 2025 -SwingI'm entering a NVDA $135 PUT expiring May 23, 2025, as a short-term swing trade based on my technical analysis.
Type: Put Option (ITM)
Strike Price: $135
Expiration: May 23, 2025 (this Friday)
Rationale:
I see signs of a potential downside move in NVDA: bearish RSI divergence, weakening momentum, and rejection at key resistance. I chose the in-the-money (ITM) $135 strike PUT because it has higher delta and holds value better, especially with strong theta decay favoring fast profits ahead of expiration this Friday.

Nvidia —Resistance Turns Support Support Confirmed—ATH 260-194This week closes as a full green candle. A rising window or gap was left along the way. This is a bullish development.
The full green candle comes after a rounded bottom and double-bottom long-term. Coming from a resistance level turned strong long-term support.
Keeping it simple, NVDA has been rising and the chart shows potential for additional growth. There can be retraces and corrections; Any retraces and corrections are an opportunity to buy-up, rebuy and reload.
In the case of a strong correction, always, we will end up with a higher low compared to the 7-April weekly session. This session marks the bottom of the correction.
A higher low means the bullish structure remains intact. A bullish structure means a bullish trend. A bullish trend means rising prices which will end up with a new All-Time High in late 2025.
Two new All-Time Highs possible and highly probable in 2025. 194 (mid-term) & 260 (long-term).
Thank you for reading.
Support boost and follow.
Namaste.

Possible Targets for Nvidia on Both Upside and DownsideNvidia has surged more than 55% since the early April dip and over 40% from the second dip, as expected in our earlier post. This massive rally was supported by a softening in trade policy (Bloomberg trade uncertainty index fell to 7.67 from 16.27), Nvidia's valuation being well below historical averages, and momentum sparked by Trump’s Middle East business trip.
Despite the surge, Nvidia still trades below its historical average based on forward price-to-earnings ratios. The stock has averaged a forward P/E of 32.2x over the past year, 34.2x over the last two years, and 40.2x over the past five years. Its current forward P/E stands at 28.4x. If Nvidia were to return to these averages, the implied price would be:
1-year average (32.2x): $153.04
2-year average (34.2x): $162.20
5-year average (40.2x): $190.79
However, relying on the 5-year average may not be ideal, as Nvidia’s explosive growth potential is no longer at the same trajectory it was five years ago. The 1-year average at $153.04 could be a more realistic near-term target.
Around the 1-year p/e price target, Nvidia has also a notable technical resistance. The stock has an infamous double top at $154 that has capped price advances twice before in November and January. This suggests that a short-term bet on further upside could be risky.
If Nvidia pulls back to around 120 level, however, it may offer a good buying opportunity, with upside potential toward 150 or higher, depending on the broader macroeconomic conditions at the time.
Please also check our earlier post:
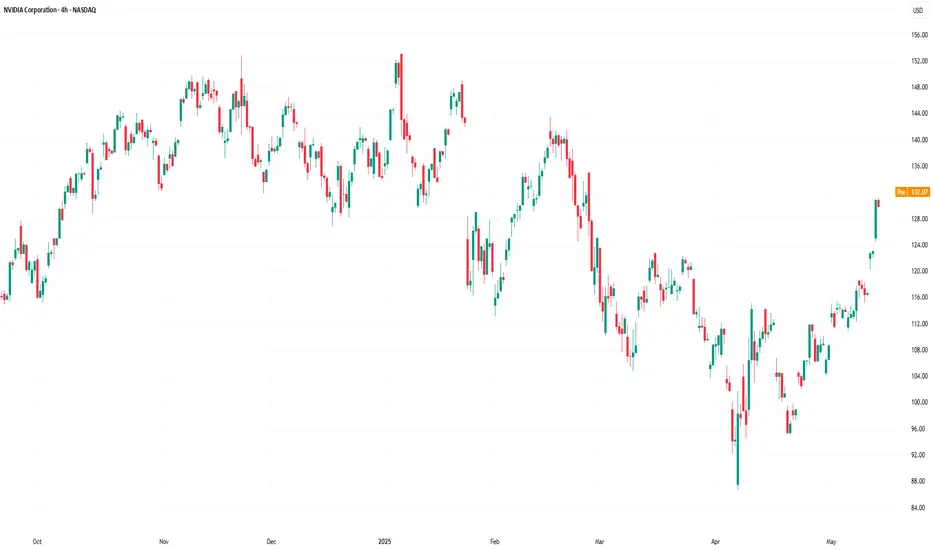
NVIDIA (NVDA) 4H Outlook – May 2025Price has recently shown multiple Breaks of Structure (BoS) to the upside, suggesting a potential shift in market sentiment. After a liquidity sweep of the prior low, price began forming higher highs and higher lows.
Currently trading around $116.62, NVDA may revisit the demand zone between $107.99–$110 (highlighted in green) before resuming bullish momentum. If that level holds, we could see a continuation towards the $129.41 target zone, aligning with prior market structure and supply.
This setup aligns with smart money concepts—monitor for confirmation at the demand zone before entering long.

$NVDA Hits Key Inflection Zone – Breakdown or Breakout?📍 We’ve arrived.
NASDAQ:NVDA has reached the key reversal zone where sellers previously took control. This is the third touch, and markets rarely leave these zones without a fight.
🔍 Technical Setup:
Price has retraced to prior breakdown level.
MACD is trying to cross bullish — momentum building.
Sellers should defend here… but the recent AI narrative and Gulf chip deals could fuel a breakout.
If sellers fail to show up, we may blow straight through this level toward new highs.

NVDIA Don't Miss Out
Overview:
NASDAQ:NVDA is showing strong bullish momentum on the 2-hour chart, trading at $132.34 as of the latest candlestick. After a recovery from the March low of $88, the price is now testing a key resistance at $132.47. A breakout above this level could signal a continuation toward higher targets, supported by positive market sentiment and technical indicators.
Key Levels to Watch:
Resistance: $135.47
Next Target: $139.50 (psychological level and prior resistance)
Support: $116.24 (recent low, key support)
Trade Setup:
Direction: Buy on breakout
Entry: $133.50 (confirmation above resistance)
Profit Target: $139.50
Stop Loss: $125.00 (below recent pullback and 50-period MA)
Risk-Reward Ratio: 2:1 (Risk: $2.50, Reward: $5.00)
Follow for the Best Free AI Signals on the market
Ash.


Nvidia Overtakes Apple as 2nd-Biggest Company. Microsoft Next?Well, well, well — if it isn’t the GPU-maker-turned-global-tech-Goliath lapping the iPhone factory on the market cap leaderboard . Again.
Nvidia NASDAQ:NVDA has officially snatched the second-largest company title from Apple NASDAQ:AAPL , bringing its market cap north of $3.3 trillion, while Apple sat there like a vintage iPod on shuffle at $3.17 trillion — playing the same valuation tune for days.
So, what’s powering this meteoric rise? It’s not just graphics cards for gamers — that’s 2015. And it’s not graphics cards for Big Tech — that’s 2024. It’s graphics cards paid for by Middle Eastern oil money.
😎 Saudi Chips: Not the Potato Kind
Here’s the scoop: Saudi Arabia and the UAE are ready to shell out billions to become AI superpowers. And who’s their go-to guy? Nvidia, of course.
CEO Jensen Huang, who was in Riyadh this week, announced that Nvidia will supply “several hundred thousand” of its most advanced processors to Humain, a state-backed Saudi firm tasked with building AI infrastructure across the desert kingdom. That includes 18,000 units of Nvidia’s cutting-edge GB300 Grace Blackwell chips — the stuff data scientists dream about.
Nvidia calls this initiative “sovereign AI” — governments building and running their own AI on national infrastructure. Think of it as building data sandcastles, except the sand is made of petrodollars and server farms.
The geopolitical context? President Trump’s Middle East tour is clearing regulatory roadblocks, scrapping AI export restrictions drawn up under Biden, and opening the region to top-shelf American tech.
And Wall Street is paying attention.
💪 Trump Dumps Diffusion Rule, Nvidia Pumps
One of the major tailwinds for Nvidia’s latest rally came in the form of a policy reversal. The Biden-era “AI Diffusion Rule,” which aimed to restrict exports of advanced chips, has now been tossed by the Trump administration.
According to the Bureau of Industry & Security, the rule would have “undermined US innovation” and strained diplomatic relations. Translation? Nvidia was about to have its international wings clipped — but now it's free to fly across the Persian Gulf with pallets of GB300s.
The rule reversal instantly boosts Nvidia’s global reach — and opens the floodgates for billions in international chip demand. Naturally, the stock responded positively, climbing 5.4% on Monday, 5.6% on Tuesday, and 4.1% on Wednesday.
🚂 Not Just a Hype Train (But Bring Snacks Anyway)
Nvidia’s rally isn’t just FOMO (but there is some froth every now and then ).
It’s backed by earnings, expansion, and actual demand. Every major AI player — from startups to sovereign nations — needs Nvidia chips. And there’s no clear rival. AMD NASDAQ:AMD is a step behind. Intel NASDAQ:INTC is still trying to remember how to make people excited again.
But at these levels, expectations are sky-high. Even a great quarter that’s not utterly perfect could trigger some profit-taking. After all, trees don’t grow to the sky — but apparently semiconductors are expected to .
👀 Eyes on Microsoft, But Timing Is Key
So what’s next? Can Nvidia dethrone Microsoft NASDAQ:MSFT , currently valued at just about $60 billion more, and become the biggest company in the world?
Easily, especially if Huang’s tech juggernaut keeps this pace and posts another monster earnings beat. Nvidia reports on May 28, and you can bet every institutional desk, Reddit thread, and our very own TradingView community will be glued to their multi-screen setups to get those numbers.
Microsoft still sits at the top with a $3.36 trillion valuation — within striking distance. All it would take is another ~1.8% pop for Nvidia and a sleepy session for Microsoft.
But be warned: Wall Street loves a Cinderella story until the glass slipper misses earnings by two cents.
🧐 Final Thoughts: Watch Out Everyone
Apple may have Siri. But Nvidia has the chips to build a thousand Siris — and a few Skynets while we're at it.
Whether it can overtake Microsoft depends on the next earnings report (or the lead-up hype).
So the question isn’t “Will Nvidia stay #2?” It’s: How long until it’s #1 — and what could possibly stop it?
And if you’ve got it on your watchlist, circle May 28 in red marker and don’t forget to pay attention to the earnings calendar .
Because that earnings print might just rewrite the leaderboard again.
Your move : Are you riding NASDAQ:NVDA to the top? Waiting for a pullback? Or nervously watching from the sidelines with popcorn and regret? Hit the comments with your play.

Litecoin is ready for a massive pump!A lot of people have no idea just how big the Litecoin pump could be. We’ve had a huge multi-year accumulation, very similar to the early days of Nvidia. I believe we will see the fruition of this accumulation very soon. This could send Litecoin soaring to a new all-time high and kick off a massive bull market.
As always, stay profitable.
– Dalin Anderson

NVDA PROJECTION
Price has approached the key resistance zone between $130–$140. If rejected, the next strong support lies in the $100–$75 accumulation zone.
Weekly resistance target remains at $200.
Watch for potential breakout or rejection from this critical level.

NVDA: Buy ideaOn NVDA as you can see on the chart we would have a hight probability to have an uptrend after the breakout with force the Resistance line by buyers.

Nvidia (NVDA) Share Price Jumps Over 5%Nvidia (NVDA) Share Price Jumps Over 5%
Nvidia (NVDA) shares surged to the $130 mark yesterday – a level not seen since late February 2025. This strong rise, marked by a wide bullish candlestick, helped Nvidia reclaim its status as a company valued at over $3 trillion.
Why Nvidia (NVDA) Shares Are Rising
The bullish sentiment has been driven by several factors, including:
→ Price increases on products: Nvidia has raised prices on its graphics cards and data centre chips. The GeForce RTX 5090 has risen by more than 10%, while the RTX 50 series is up by 5–10%.
→ News of a major contract: The company will supply chips to an AI start-up backed by Saudi Arabia. In addition, media reports suggest that the US government is considering a deal allowing the UAE to purchase up to 500,000 Nvidia chips annually until 2027.
All of this could positively impact Nvidia’s revenue, encouraging investors to buy NVDA shares.
Technical Analysis of Nvidia (NVDA) Stock Chart
Yesterday’s sharp rally suggests a breakout from the descending channel (marked in red), which had remained in place since late last year.
The breakout occurred near the $123 level, which had previously acted as resistance. It is therefore possible that if there is a pullback in the NVDA stock price, this level could act as support (“breakout retest” pattern), confirming the breakdown of the descending channel and strengthening the outlook for further growth.
This article represents the opinion of the Companies operating under the FXOpen brand only. It is not to be construed as an offer, solicitation, or recommendation with respect to products and services provided by the Companies operating under the FXOpen brand, nor is it to be considered financial advice.
NVDA Weekly Head and Shoulders There's no main price target in mind, however the company from a risk management perspective has been largely not investible for about a year. Multiple 40-60% moves from top to the bottom of the range. Now with diffusion global competition will eventually eat into Nvidia's earnings/market share.
Without a major wave of monetary inflation in the United States it's very like that the short/medium term top has been put in and AI is a narrative that is played out. AI although impressive has yet to deliver what people see has a true life changer. It will eventually happen but Nvidia will have competition when that occurs.

Trading the Impulse Rally Retracement — Price and Time Symmetry Trend is observed from an impulse run’s lowest/highest point and projected outwards in symmetrical fibonacci retracement via price/time from the first reversal candle to the end of the rally, creating crosshairs. These ‘crosshairs’ visually represent the trending ‘price distribution projection’ in price/time symmetry.
Using this concept, I draw a ‘projection trend line’ from the bottom or top of the impulse run thru the projected 78.6% price/time retracement value, to identify the price distribution structure in a linear form.
Now to introduce my STOP LOSS TRIANGLE.
This is a concept of decaying price and time as an underlying move towards our theoretical projection, where if the underlying enters our built faded cross-section, the SL is triggered to avoid sideways consolidation and decaying contract premiums.
This ‘right’ triangle that is ‘sclene’ by nature is created by taking the furthest projection in price/time symmetry (78.6%) and drawing a vertically placed straight line to the highest/lowest point in the rally previously identified. Here, I create a ‘right triangle’ by turning 90 degrees towards my final point, which is made by the nearest projection in price/time symmetry (38.2%). In its entirety, this forms the stop loss triangle.
Come follow me on X @askHVtobidIV for more!
CHEERS!

NVDA by DXY parallel channel... interesting gaps and levelsBrief thing here...but taking a NVDA price point and dividing it by the DXY to achieve a lower graph. Then taking two lows and a pinnacle high to form a parallel channel with a 50% marker.
Can see how there is little usefulness in the below chart...yet the top one is quite interesting. The circles are places of interest and some levels were gapped up without retracing and whatnot.
But what does it mean..who knows, but compare your analysis to these levels and see what may be hiding in plain sight that you could miss.
PS....here is the top to recent bottom Fib Retrace on the same points from the below graph superimposed on the NVDA chart....interesting no?
The daily chart has some interesting levels that the parallels share...so if its a little top heavy, a drop can be on any of these lower levels.
Here is the Fib Retrace but with those same circles to see correlation with parallel:
closer view of just NVDA with all goodies attached...
