NVIDIA🟢 NVIDIA
Timeframe: D
Here comes the bearish signal we were waiting for. The ending diagonal provides an ideal entry point at 165.00 to capitalize on a higher-degree correction. The risk-to-reward ratio is extremely favorable.
#NVDA
NVDA trade ideas

I am Bullish on NVIDIAI am buying NVDA from its current price.
Entry $140.06
SL: $136.82
TP: $153 and beyond

Nvidia: Nvidia is still at the top!In the daily timeframe, Nudia stock is above EMA200 and EMA50 and is moving in its upward channel. In case of valid failure of the support range, we can see the downward trend of this share. On the other hand, within the demand zone, you can make purchases for investment purposes with a suitable risk reward.
The stocks of the seven tech giants, often referred to as the Magnificent 7, have grown approximately 30 times over the past decade—more than twice the growth seen in any previous market bubble. Notably, the term “Magnificent 7” was first coined by a Bank of America analyst in early 2023. Therefore, no one could have exclusively invested in these companies a decade ago, as this categorization didn’t exist at the time.
To compare this growth with other market indices, we can look at the Nasdaq 100 in the 1990s, which grew 12 times before the dot-com bubble burst.A significant part of this recent growth is attributed to the surging stock price of NVIDIA. The company has surpassed Apple to become the world’s largest by market value. Since 2019, NVIDIA’s stock has skyrocketed by 3,776%, creating unprecedented wealth among its employees:
• 78% of employees are now millionaires.
• Half of them possess assets worth over $25 million.
However, behind these massive payouts lies a relentless work culture. Employees have reported working seven-day weeks and shifts at 2 AM. The current challenge is motivating “semi-retired” employees whose wealth has diminished their engagement levels. Despite this, NVIDIA maintains an employee turnover rate of just 2.7%, compared to the industry average of 17.7%. The company also ranked second in Glassdoor’s “Best Places to Work” for 2024.
NVIDIA CEO Jensen Huang has stated that the performance of the company’s AI chips is advancing faster than the historical rates defined by Moore’s Law. Speaking at CES in Las Vegas to an audience of 10,000, Huang told TechCrunch, “Our systems are advancing much faster than Moore’s Law.”
Moore’s Law, introduced in 1965 by Intel co-founder Gordon Moore, predicted that the number of transistors on a chip would roughly double every year, effectively doubling the chip’s performance. This prediction held true for decades, driving rapid advancements and cost reductions, but the trend has slowed in recent years. However, Huang claims that NVIDIA’s AI chips are advancing at an even faster rate. He further announced that the company’s new data center superchip is over 30 times faster than its predecessor for AI inference tasks.
Huang added, “We can design the architecture, chip, system, libraries, and algorithms simultaneously. If you do that, you can move faster than Moore’s Law.”
He also revealed that MediaTek, a Taiwan-based semiconductor company and one of the largest producers of chipsets for mobile devices and other electronics, is now leveraging NVIDIA’s technology for its products. Huang praised MediaTek’s expertise in designing system-on-chip (SoC) solutions, stating that this collaboration could drive significant technological advancements and innovation.
At CES, Huang introduced new products and highlighted the emerging concept of “physical AI” as the next frontier in artificial intelligence. This domain includes humanoid robots and autonomous vehicles, both requiring advanced processing chips like those NVIDIA provides. Analysts predict that by 2050, there will be approximately 648 million humanoid robots worldwide, all relying on complex models to navigate the world.
To sustain its growth, NVIDIA is focusing on expanding into new addressable markets (TAMs) while increasing its share in the AI chip market. Huang noted that physical AI is reaching a transformative moment similar to what ChatGPT achieved.

NVDA - testing 50 EMA support at $137.50NVDA - Nvidia and AI Chip Stocks Brace for Impact as Biden Administration Considers New China Export Ban: Report. Stock held 50 EMA support level at $137.50. IF fails this level, we can see $133.82 and $126. stock needs to break $140.41 to continue higher. Stock is decent on indicators.


Nvidia - Shocking Everybody Again In 2025!Nvidia ( NASDAQ:NVDA ) will rally another +40% in 2025:
Click chart above to see the detailed analysis👆🏻
For most people, it seems absolutely counterintuitive to witness another parabolic blow off rally on Nvidia and that's exactly why we will see such moves during 2025. Market structure just supports this outlook since Nvidia is still overall bullish and has some room towards the upside.
Levels to watch: $200
Keep your long term vision,
Philip (BasicTrading)

NVDA: Buy ideaOn NVDA we have a high probability of seeing the market go up. This is explained by the fact that we have a succession of many red candles and on top of that we have a spring effect on the support line.
But we must always remember, let's be vigilant because the market can go down even if the probability is low in the event of a forceful break of the support line by a large red candle.

WHERE IS NVDA GOING?
NVDA IS CURRENTLY IN A RANGE BETWEEN 143.90 & 139.85.
I would not touch this unless it breaks out of this range.
I think we are still bullish but if we see a retracement back to 143.90 and it rejects it will head to 137.80
A hard break above 143.90 we can see 149.

NVIDIA Corporation (NVDA): Consolidation Near Critical Levels🔥 LucanInvestor’s Strategy:
🩸 Long: Above $144.22, targeting $150 and $155. Strong momentum needed for breakout confirmation.
🩸 Short: Below $133.70, aiming for $130 and $125. Bearish pressure intensifies below key support.
🔥 LucanInvestor’s Commands:
🩸 Resistance: $144.22. Breaking this level could trigger a bullish rally.
🩸 Support: $133.70. A drop below this may signal further downside.
NVDA consolidates as MACD momentum remains neutral, highlighting market indecision. Watch for volume spikes to confirm direction. The stock sits at a pivotal juncture, with both bulls and bears eyeing breakout opportunities.
👑 "Market mastery begins with clarity in chaos." — LucanInvestor


Breakout strong bullish swingNVDA has broken out of my blue trend line with a strong bullish outlook, signaling a great opportunity for a long swing trade. The price has been consolidating within a tight range for some time, but today's breakout confirms the momentum shift. The stock is in a strong uptrend, trading will above the 200MA, which acts as a long term support level. It recently bounced off the 20MA with a strong bullish candle, further affirming the continuation of the trend. While I have a set price target for this swing, I may consider holding the position longer if the trend remains intact. The strength of NVDA price action and overall market conditions will guide my decision.
Why I like this setup:
Strong bullish breakout from consolidation.
Clear uptrend with support from both the 200MA and 20MA
Bullish momentum confirmed by todays price action.
My Risk:
Ive placed my stop loss just below the breakout level to manage downside risk. I'll adjust my stop to breakeven or trail it closer to secure profits as NVDA moves higher.
Let me know your thoughts on this setup. Do you think NVDA will continue its bullish run?
Not financial advice, Trade at your own risk I just started posting my ideas :D

NVDIA First 1hour Golden Cross since September targeting $180.NVDIA has completed almost a -10% decline following the formation of a 1hour Golden Cross.
That was the first Golden Cross on the 1hour timeframe since September 26th 2024.
Both patterns peaked on this formation and then declined by almost -10%.
The September fractal then made a +30% rebound.
The current fractal is supported by both the 1hour MA200 and a Rising Support of Higher Lows.
We are expecting a similar rise to follow. Buy and target $180.
Follow us, like the idea and leave a comment below!!

NFP Week ShortsVery Low risk due to NFP week. Risk was light and still on some open positions, which could very well be closed at break even. Weekly profile was bearish and trade was aligned with weekly candle expansion. Posted futures earlier today. Treading lightly this week, and out of most positions, remaining runners only.

NVDA: Buy ideaOn NVDA based on the chart configuration, we would have a high probability of seeing the market go higher if and only if the vwap and the resistance line are broken forcefully.

NVDA – Buy the Dip for a Short BounceOur last NASDAQ:NVDA trade went very well. Within a few weeks we made more than 15% re-testing the ATH and generating a new one. Directly after hitting the ATH we saw a sell on good news event during the CES and the presentation of the “Home AI PC”. The perfect time to buy was yesterday minutes before markets closed. The price formed a falling wedge with a RSI divergence. Nevertheless, buying today could still give results. Target is the ATH again and invalidation point is a close below our $140 support.
Target Zones
$154
Support Zones
$140

We might possibly see a brief bullish trend.The price is now falling back into the buying zone, indicating that we could see a brief bullish trend. We would enter with a 0.5% position upon reaching the buying zone and add another 0.5% position if the price holds above the resistance rather than falling below it. The take profit would be set at the target level. This setup could result in a good, short uptrend.

NVDA - A 90% Short fall to the centerline ($100-$104) or lowerDouble top, failed breakout of the high—call it what you will.
Fact is, NVIDIA has taken a brutal hit and is now trading back inside the fork.
Hagopian—what on earth is a HAGOPIAN?
According to the Fork Framework rulebook, if the market fails to reach its next target (the next line, such as the centerline, lower median line parallel, etc.), it reverses and moves further back than where it started.
This is (not so exactly) what happened in December. Instead of reaching the centerline, the market turned, shot beyond the upper median line parallel (U-MLH), and was supposed to break above the November 21st high. It missed that target as well. And this, my friends, is....?
...again, a HAGOPIAN!
Now, it’s heading south again. But this time, we have an over 90% probability of reaching the centerline. Why? Because when the market breaks above the U-MLH and then falls back into the fork, it’s a very bearish signal.
Of course, nothing works 100%. The market could turn around today and push past the high. But statistically, we’re aiming for the centerline—and there’s an over 90% chance we’ll hit it.
When will it happen?
Sorry, my crystal ball is broken.
All I do is follow the Fork/Median Line rulebook and rely on my experience.
As for me, I’m opening a short position in NVIDIA today and may add to it on the way down to the centerline. And I play this game with Options, so no hard price level stop for me.

NVIDIA $NVDA | FALL OF THE CHIP KING, WHO'S UP NEXT? - Dec22'24NVIDIA NASDAQ:NVDA | FALL OF THE CHIP KING, WHO'S UP NEXT? - Dec22'24
NASDAQ:NVDA BUY/LONG ZONE (GREEN): $136.25 - $149.00
NASDAQ:NVDA DO NOT TRADE/DNT ZONE (WHITE): $133.00 - $136.25 (can be extended to $127.25 - $136.25)
NASDAQ:NVDA SELL/SHORT ZONE (RED): $118.25 - $133.00 (can be extended to $118.25 - $127.25)
NASDAQ:NVDA Trends:
NASDAQ:NVDA Weekly Trend: Bullish
NASDAQ:NVDA Daily Trend: Bullish
NASDAQ:NVDA 4H Trend: Bearish
NASDAQ:NVDA 1H Trend: Bearish
NASDAQ:NVDA stock has been in a downtrend since their last earnings release on Nov20, who will become the next trillion-dollar chip maker? Trying a new style of analysis. Previously would erase the zones that I would reference in the past, but now I will include them, as I have been constantly updating my NASDAQ:NVDA analysis for other to use and follow along. After we saw the fall from the Nov20 earnings report, price pulled back to the previous price level the day of earnings release, before tumbling back into the bearish zones. The down trend has not been broken for NASDAQ:NVDA , but bulls should look for a break above 136.25 and bears should look for continuation below 133.00 or 127.25.
I will link below my previous NASDAQ:NVDA analysis, along with my NASDAQ:SMCI analysis and NASDAQ:AMD analysis!
This is what I would personally look at before entering trades, everything is subject to change on a daily basis and as I analyze different timeframes and ideas.
ENTERTAINMENT PURPOSES ONLY, NOT FINANCIAL ADVICE!
trendanalysis, trendtrading, priceaction, priceactiontrading, technicalindicators, supportandresistance, rangebreakout, rangebreakdown, rangetrading, chartpatterntrading, chartpatterns, spy, sp500, s&p, fed, federalreserve, fedrate, fedratecut, interestrate, jeromepowell, fedchair, 50bps, volatile, volatility, nvidia, nvidiapricetarget, nvdatrend, nvidiatrend, nvdasetup, nvidialongs, nvidiashorts, chipmakers, smci, amd, supermicro, advancedmicro, chipmakertrends, newchipmakers, trilliondollarchipmakers, nvidiaproducts, nvidiachips, nvdachips, nvdatrend, nvdaprice, nvidiaprice, nvidiaanalysis, nvidiasetups, nvdaideas,

$NVDA NVIDIA AFTER CES: REALITY KICKS IN AFTER ATH | JAN08'25NASDAQ:NVDA NVIDIA AFTER CES: REALITY KICKS IN AFTER ATH | JAN08'25
NASDAQ:NVDA BUY/LONG ZONE (GREEN): $140.00 - $153.00
NASDAQ:NVDA DO NOT TRADE/DNT ZONE (WHITE): $136.00 - $140.00
NASDAQ:NVDA SELL/SHORT ZONE (RED): $127.00 - $136.00
NASDAQ:NVDA Trends:
NASDAQ:NVDA Weekly Trend: Bullish
NASDAQ:NVDA Daily Trend: Bullish
NASDAQ:NVDA 4H Trend: Bearish
NASDAQ:NVDA 1H Trend: Bearish
At CES 2025, NASDAQ:NVDA unveiled a series of groundbreaking announcements, including the RTX 50 series GPUs and the Cosmos AI platform, aimed at robotics and autonomous vehicles. This led to an immediate surge in NASDAQ:NVDA 's stock price, hitting new all-time highs and reaching the top of my previous bullish zone. However, the excitement didn't last, with the stock experiencing a significant pullback shortly after.
I will link below my previous NASDAQ:NVDA analyses, along with my NASDAQ:SMCI analysis and NASDAQ:AMD analysis!
This is what I would personally look at before entering trades, everything is subject to change on a daily basis and as I analyze different timeframes and ideas.
ENTERTAINMENT PURPOSES ONLY, NOT FINANCIAL ADVICE!
trendanalysis, trendtrading, priceaction, priceactiontrading, technicalindicators, supportandresistance, rangebreakout, rangebreakdown, rangetrading, chartpatterntrading, chartpatterns, spy, sp500, s&p, fed, federalreserve, fedrate, fedratecut, interestrate, jeromepowell, fedchair, 50bps, volatile, volatility, nvidia, nvidiapricetarget, nvdatrend, nvidiatrend, nvdasetup, nvidialongs, nvidiashorts, chipmakers, smci, amd, supermicro, advancedmicro, chipmakertrends, newchipmakers, trilliondollarchipmakers, nvidiaproducts, nvidiachips, nvdachips, nvdatrend, nvdaprice, nvidiaprice, nvidiaanalysis, nvidiasetups, nvdaideas, ces, cesevent, cesnvda, cesnvidia, ces2025, cesamd, cessmci, cesrtx50, rtx50, gpus, cosmosai, newai, aitrends, newaiindustries, nvdaproducts, nvdartx, jensenhuang, nvdaceo, nvdajensenhuang, nvdaoptions, amdsmcinvda,

$NVDA, Long, Risk=1/5, TP>15%NASDAQ:NVDA , Long, Risk=1/5, TP>15%
Fundamentally the stock is good.
Choose an entry point and do not forget about a protective order if you are trading with leverage.
Don't risk it if you're not sure.
Good luck to everyone.

NVDA Technical Analysis and GEX Insights-Jan. 8
Technical Analysis (30-Minute and 1-Hour Chart)
* Trend and Price Action:
* NVDA experienced a sharp pullback after testing the $155.00 resistance level and is now consolidating around $141.50.
* The price is forming a potential descending triangle with immediate support at $139.00 and resistance at $144.00.
* Volume: The pullback is accompanied by a significant volume increase, signaling heavy selling pressure at higher levels.
* Indicators:
* MACD: Bearish crossover with increasing downward momentum, confirming the recent selloff.
* Stochastic RSI: Oversold conditions, suggesting the possibility of a short-term bounce.
* Key Levels:
* Support Levels:
* $139.00: Immediate support zone and a critical pivot for maintaining bullish sentiment.
* $136.00-$135.00: Major support levels aligned with high PUT wall activity, signaling strong downside protection.
* $125.50: Extended support level, marking the lower boundary of recent price action.
* Resistance Levels:
* $144.00: Immediate resistance zone with PUT walls above, adding to selling pressure.
* $150.00: Strong resistance backed by CALL wall activity.
* $155.00: Key resistance aligned with the highest positive gamma exposure.
GEX Insights for NVDA
* Gamma Exposure (GEX):
* Positive GEX Zones:
* $150.00-$155.00: Dominant CALL wall region, acting as significant resistance.
* $144.00: Additional resistance level with high gamma-related hedging activity.
* Negative GEX Zones:
* $139.00: Immediate PUT wall, marking strong short-term support.
* $136.00-$135.00: High negative gamma concentration, reinforcing downside support.
* Options Metrics:
* IVR (Implied Volatility Rank): 21%, indicating relatively low options pricing.
* Options Flow:
* CALLs: Concentrated at $144.00 and $150.00, reflecting resistance levels.
* PUTs: Heavy activity below $139.00, highlighting significant hedging and support.
Trade Scenarios:
Bullish Scenario:
* Entry: Above $144.50 with confirmation of breakout momentum.
* Target: $150.00 (initial), $155.00 (extended).
* Stop-Loss: Below $141.00 to limit downside risk.
Bearish Scenario:
* Entry: Below $138.50 with strong selling volume.
* Target: $135.00 (initial), $125.50 (extended).
* Stop-Loss: Above $141.00 to cap losses.
Conclusion
NVDA is currently consolidating near $141.50 after a steep pullback. A break below $139.00 could lead to further downside toward $135.00 or lower, while a breakout above $144.50 may trigger a move toward $150.00 or $155.00. GEX data confirms these levels as critical pivot points for price action and options-related activity.
Disclaimer: This analysis is for educational purposes only and does not constitute financial advice. Always conduct your own research and manage risk responsibly.
Let me know if you'd like further clarifications or insights!

Nvidia Stock Double Top Nvidia 📉 **Double Top Pattern in Technical Analysis** 📉
A **Double Top** is a bearish reversal pattern that signals a potential trend change from upward to downward. It forms after a strong uptrend and consists of two peaks at roughly the same price level, with a valley (or trough) in between.
🔍 **Key Characteristics**:
1. **First peak** – Price hits a high point and retraces.
2. **Second peak** – Price rises again but fails to surpass the first peak.
3. **Neckline break** – A drop below the trough confirms the pattern, signaling a potential downtrend.
🚨 **What it means**: When the price breaks below the neckline (the support level), traders may look for a sell signal, as the pattern suggests weakness and a possible reversal of the current uptrend.
#TechnicalAnalysis #DoubleTop #ChartPatterns #StockMarket #TrendReversal #TradingTips

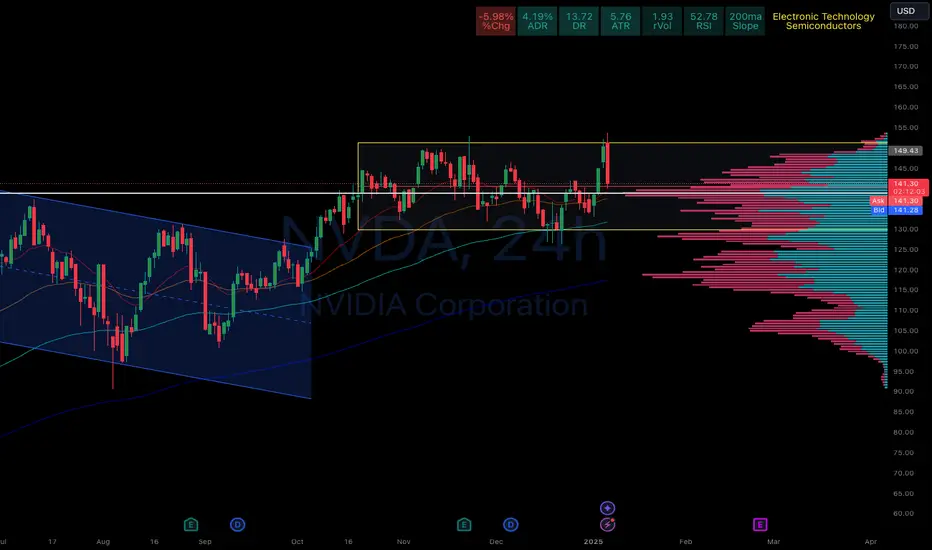
NVDA Nvidia 24 hr potterbox.NVDA Nvidia. 24hr potterbox. Well as we can see from the box is that nivida could possibly bounce off of the 50 percent line or cost basis. $140.62ish If it doesnt stop there it will possiblt keep going down to the floor of the box. $129.91ish we shall see where it goes tomorrow. I also believe in the power of the threes. one ,two ,three, bam. Happy trading.