SAP high reward ratioSAP crashed because of bad earnings, good opportunity to step in and take the high reward ratio as a swing trade.
SAP trade ideas

$SAP posting earnings as estimated with a neutral outlookPEAD is projecting a neutral outlook for the stock after publishing earnings close to the estimate, currently price is trading close to the lower boundary of the projected PEAD.

Pull Back FishingI guess the market was not happy with SAP's earnings
Fell through several support levels which now become resistance
Not a recommendation
The trend can be a fickle friend I guess

$SAP #SAP ... all hands on deck! Support area is 89 -79 USDHi and welcome to my analysis on SAP (NYSE, USD).
Yes, we had some news from the software provider that attracted sellers. Trading in Germany on XETRA is closed and no prisoners were taken...
In my first chart you can see a broadening top in the stock. SAP was not able to activate this formation to the upside in September...the upper trendline produced heavy resistance and forced a minor reversal...
In combination with a bearish engulfing pattern as per end of September...
...and last week's break below the KAMA21 the stage was set for a downturn...
The lower megaphone supportline is at 89 USD...this is a target if the bears remain in control.
POC (2016 to date) is showing the point of control around 79 USD.
Would be nice if you support me with a thumbs up and follow me...
Best,
Tom Jansen
Chief Investor-Guard
© Copyright TA Investor-Guard 2020. Charts powered by TradingView. All rights reserved.
The information provided here is of a general nature and not legal, tax or investment advice.

SAP (This Is What A FREE FALL Looks like!!)This Is What A FREE FALL Looks like!
this is a stark reminder to those who are new into trading, especially to those came into the market in the recent month, without understanding the vicious nature of the stock market.
YOU simply do not have time to GET OUT.
Sooner or later, the market will show you the importance of risk management.
Be Warned.


$SAP Resistance breakthrough $165.84Bulls tries to control the price.
MA on buy
MACD on breakout
RSI fairly sold
Like and follow


SAP Bearish momentumATR is going down. Buyers are preventing and fighting for the price up.
MACD is on bearish momentum, Price action moving down.
HMA is on divergence. Bears and bulls are on rally.

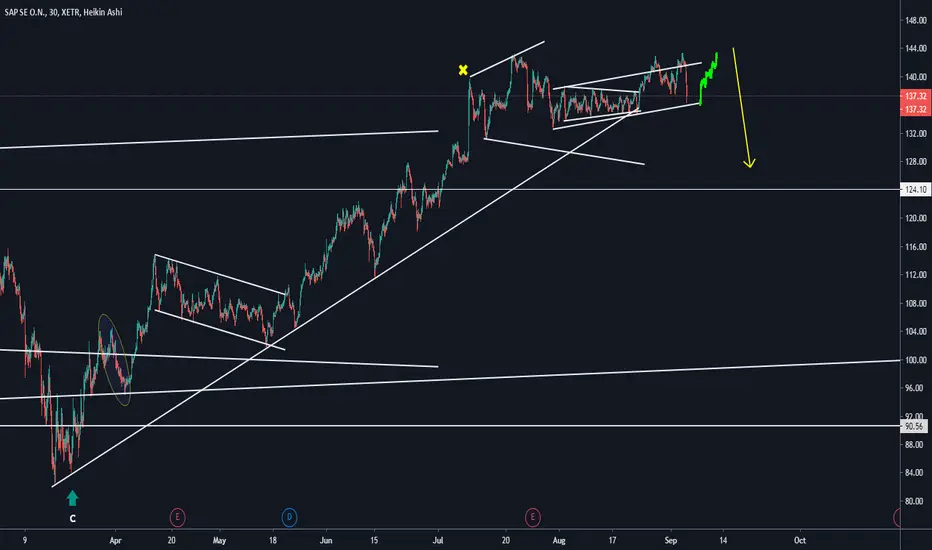
SAP, Pull-Back Since New Highs, These Are Preliminary Level!Hello Traders Investors And Community, welcome to this analysis where we are looking at the stock SAP and what to expect from it the next time. As the main market has recovered from the heavy corona crashes seen this year so also some stocks better some worse, everything that has a huge digitalization quote recovered good from the breakdowns and shown a decent growth as more and more people rely on modern technology and the opportunities arising out of it. The big question is now how long this will hold on and if there comes new bearishness into the market as the crisis is still going on and there are still many divergences between real economy and stocks, in this case also when this possibly happens which need to be considered in order to be prepared rightfully. In SAP I found some important signals which making a possible continuation firstly to the upside possible before bigger pull-backs can be considered within a more likelihood range.
As you can watch when looking at my chart is that the stock has just formed new highs within a growth since the corona-lows saw this year. Currently, there is bearish pressure entering the surface pulling the trend back and testing lower supports that need to behold when considering a bullish continuation in the middle-term-perspective. The crucial support in this structure is the support which formed by previous all-time-high price-action at the 128.5 level where the stock consolidates also with the 50-EMA in red together these levels forming a coherent support-cluster here which is marked in orange when the stock holds this cluster and bounces from there the potential for the final wave five to the upside will be given. When this happens we need to elevate and see how the stock approaches higher resistance levels and if there can be a continuation or a bigger pull-back waiting in the start-holes.
In this manner, thank you for watching, support for more market insight, have a great day, and all the best to you!
Information provided is only educational and should not be used to take action in the markets.

SAP testing support amid difficult DAX Corona outlookI am new here and would like to build a dialogue on SAP.
It is too early to call it a short - it may be buying opportunity if the support holds.


SAP SE (SAP - Xetra) - Bulls in driving seatSAP SE (SAP - Xetra) is in 4th subwave of 3rd wave up within impulse up cycle in 4 hr time frame. Stay bullish when 4th subwave will over in flat kind of correction for target of 5th subwave up with stops level below 127.70. In weekly time frame it is in 5th wave up and out-performing stock than DAX index.


SAP Stocks More chance to up in pricethe recent breaking out of a weekly strong support means that there is a high probability that the SAP stocks gets to high level of 132 Euro.
Please support this idea with like if you find it useful .

SAP Long IdeaLogic: Above 252D EMA & Yearly Pivot, confirmed uptrend.
Entry: €110-€111 area.
Stop: daily close below 21D EMA (€108.45, -2.29%) or (€104.50,-5.80%).
Target: €125


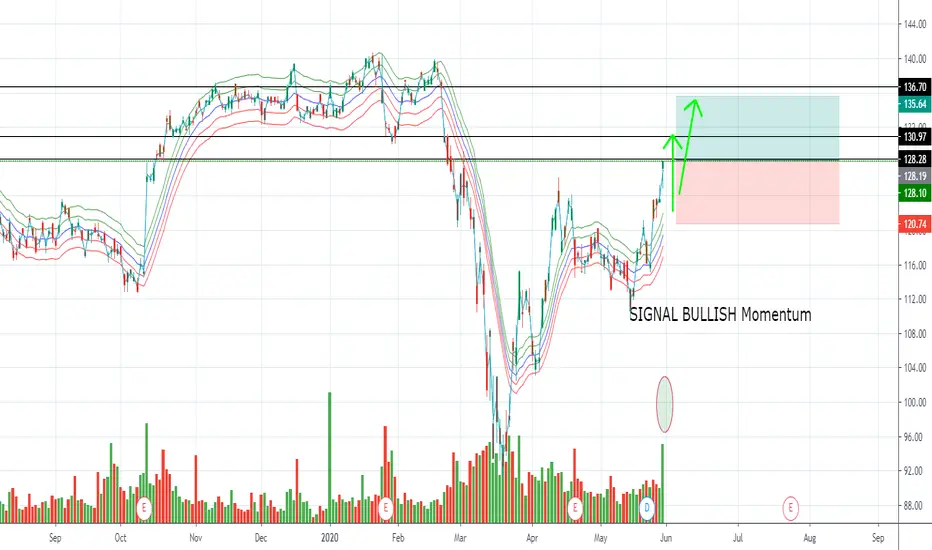
BUY SAP SE SPON ADR EACH REP 1 ORD NPV 1D DailyHello traders ,**DISCLAIMER** content on this analysis is subject to change at any time without notice, and is provided for the sole purpose of assisting traders to make independent investment decisions. SAP SE SPON ADR EACH REP 1 ORD NPV 1D gives a big bullish siganl the market may turn around.
Please LIKE & FOLLOW, thank you!
SAP More chance to up in priceThere is a high probability that the price get to 120.58 dollars ,
Please support this idea with like ,if you find it useful ,
