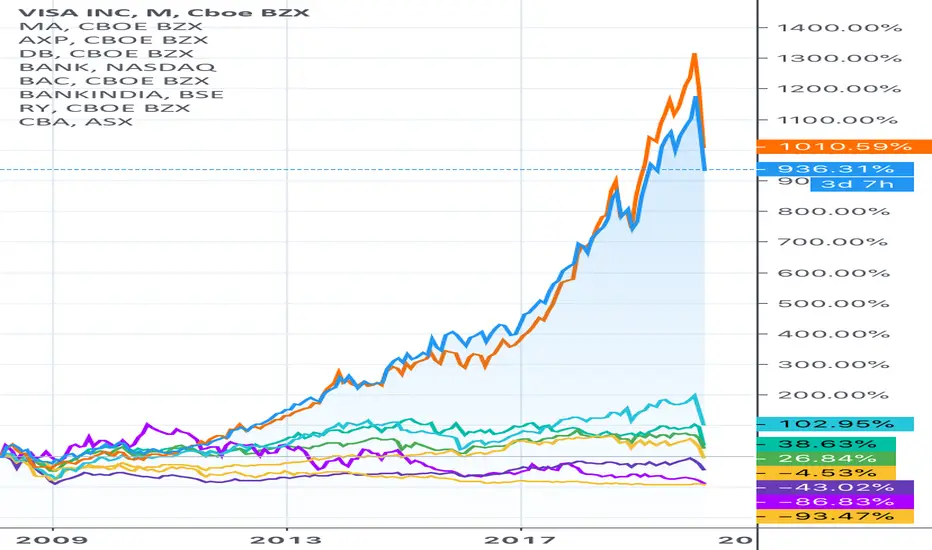
Bank Historical PerformanceThis is a quick chart to monitor how banks are performing. It includes companies such as Visa, Mastercard and American Express as well. If you think this should include other tickers, I’d be happy to include them.
VISA trade ideas

$V Brkn Wedge Backtest... (BEARISH)Team,
Here is a quick update on a short.
***Let's talk about it***

Visa booming upAs people all around the world now got stuck inside there home it is obvious that people can’t spend so much and visa stock is going down but as soon as the corona virus outbreak ends,people will start to spend using their visa card and the demand of the visa will sky rocket and perhaps making a new higher high in the technical analysis.


One more stock for correlation tradingCorrelation trading strategy idea analysis.
Today I have already shown a possibility for correlation trading of $NVDA.
In my other ideas, I showed my vision of correlated moves.
Now I want to tell about another stock for today's correlation trading.
Visa has big enough weight in the S&P 500, so correlation predetermined to be good.
Look on the $SPY and $V charts.
Actual corresponding support&resistance levels look so much alike.
Correlation is good enough to expect future similar moves.
Following the correlation trading strategy, it is reasonable to wait for correlated level breaking.
When $SPY and $V simultaneously break their resistance levels, it will be possible to buy $V.
When $SPY and $V simultaneously break their support levels, it will be possible to short $V.
Do not view this idea as a recommendation for trading or investing. It is published only to introduce my own vision.
Always do your own analysis before making deals. When you use any materials, do not rely on blind trust.
You should remember that isolated deals do not give systematic profit, so trade/invest using a developed strategy.
If you like my content, you can subscribe to the news and receive my fresh ideas.

VISA (V) Weekly chart still in long term uptrendSL at 165. Targeting 275 or until parabolic advance breaks. 180-190 range could end up being a fantastic long term entry


VISA Hidden Bullish Divergencehidden bullish divergence, a situation in which the oscillator produces a lower low while price maintains a higher low. Visa is a very consistent stock and has produced some great returns.. Very nice opportunity for a long entry if you don't believe in cryptocurrency's power ;) Currently sitting on grey EMA.

$V - Visa golden gap down 200D bouncePerfect Visa open placement here. Gap above starts to fill and still a good starter long entry. 200d does not continue its bounce and fails is a good down signal.

Visa update with buy opportunityHey all,
im long in VISA and have been in it for a year ( SwingTrading )
Visa have been in a up trend since the lunch in 2008, and it have been holding the 50 / 100 MA PERFECTLY for many years ( unbeliveable )
Visa er a healthy business and i think it have a lot in it then it shows ( fundamental analysis is very positiv )
link to visa earnings : investor.visa.com
I have put in a green line, to show where the FIBO retrancement 0,681 ends.
The plus side here is it just on the support line and could mean a posible new buy pos ( but we have to bare in mind the china VIRUS can have a small impacted on all stocks )
so we have to be carefull befor making the buy ( lets see if it holds the support line on monday ) or will it go down to the 50 MA line.
lets see what happens
your more then welcome to reply and share your thoughts
( This is not an investment advice - always remember to do your own reseach )

$SPY $V $V VISA Long term view to the top of the fib retracement. Any thoughts? Does this look right to anyone? Im long I want 230 250

V Symmetrical TriangleV gained momentum in January as it announced new displacement technology for 2020. The stock has a Professional Trader setup for triggering High Frequency Trader algorithms, which ran the stock up with momentum. Profit taking quickly halted the run temporarily with a gap down. Smaller Funds VWAPs triggered on the Buy on the Dip, which created another 4 days of profit taking.

Optimistic and conservative outlooks for the short-termPole of the flag forming at $191.92, breakout point at $203.94.
Conservative price target: $208.91
Optimistic price target: $219.92

Correction for Visa. Current price and wave analysis suggest that the stock has completed its 3 red wave upon rejecting the expansion level at 200.0%, a strong 3rd wave indeed. Current price action suggest that Visa is on the 4 th corrective wave and it is forming a strong bullish flag. Target rebound should be near the demand level 1 highlighted in the chart .

[Long] VSimilar to AMD and the rest of the tech sector, this bull flag could resolve very bullish.
We are likely witnessing a parabolic blow off top, risk manage carefully.


Visa to break north from the flagFundamentals and weekly trend indicates V is a buy every time it dips or consolidates - looking to market on a red open and hold for $220/s
will close if daily RSI dips under 50

this one is beautiful reports next week lets see what they will say.
the company is amazing and soon will enter full power to china after signing the first phase of the trade war with China.
