Are you cow to eat GRASS?GRASSUSDT looks a perfect trade, too perfect to be true! Just wait for the right buys!
GRASSUSDT trade ideas
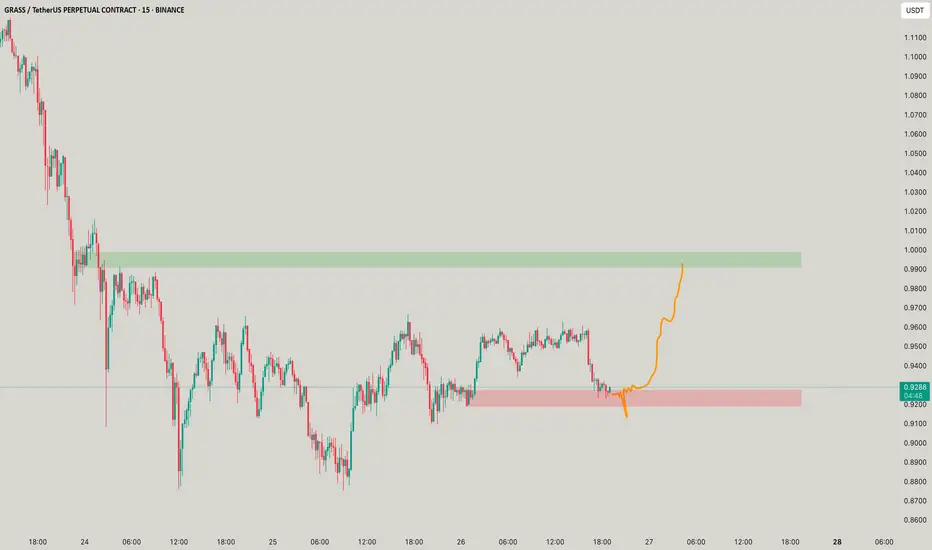
GRASS / USDTBYBIT:GRASSUSDT
Something’s cooking in GRASS coin… 🌱🔥
Be careful — big moves might be brewing. 👀📈
I mention guess it and enjoy the trade...
⚠️ Disclaimer: Not financial advice. Just market observation.
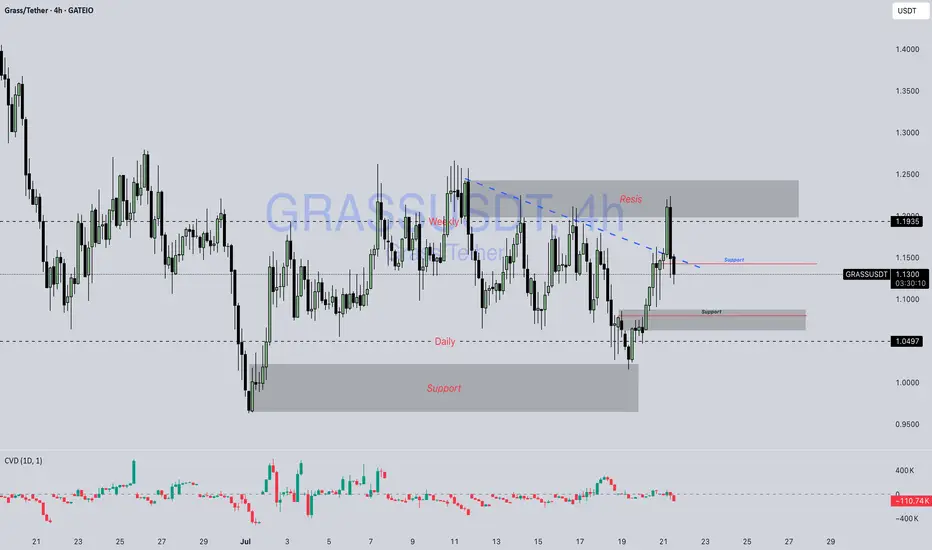
Grass / Usdt GATEIO:GRASSUSDT
📊 **Chart Overview – GRASSUSDT (4H):**
* 💰 **Current Price:** \$1.1362
* 🔻 **Previous Trend:** Downtrend has been challenged; price broke above the **descending trendline (blue dashed)**.
* 🟦 **Key Support Zones:**
* \$1.10 (recent demand area retest)
* \$1.05 (major support below, seen from earlier bounce zone)
* 🟥 **Key Resistance Zone:**
* \$1.19 – \$1.25 (major supply area where price got rejected again)
---
### 🔍 **Technical Breakdown:**
1. **Break and Retest Attempt:**
* Price **broke the descending trendline** and tapped into the \$1.19 resistance.
* Currently pulling back — possibly a **retest of the broken trendline** and the previous support near \$1.10–\$1.13.
2. **Supply Zone Rejection:**
* Strong rejection from **\$1.19–\$1.25**, which aligns with the upper supply zone.
* Sellers are actively defending this area.
3. **Bullish Case:**
* If GRASS holds above **\$1.10**, it may gear up for another push toward **\$1.19–\$1.25**.
* A clean break and hold above \$1.1935 could open room toward \$1.30+.
4. **Bearish Case:**
* Failure to hold \$1.10 or a breakdown below \$1.05 could invalidate bullish bias and revisit the lower demand zone near **\$0.95–\$1.00**.
---
📌 **Market Summary:**
GRASS is at a **critical zone**, attempting to flip trendline resistance into support. The reaction from \$1.10–\$1.13 will be key to deciding whether it can revisit higher supply levels or turn back toward major support.
---
⚠️ **Disclaimer:**
*This is **not financial advice**. All information provided is for **educational and informational purposes only**. Always perform your own analysis and manage your risk properly before trading.*
---
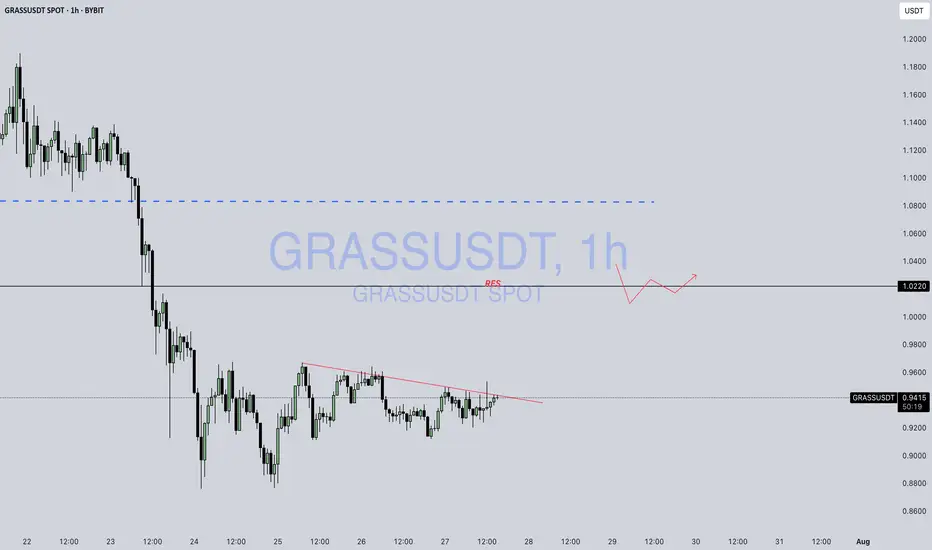
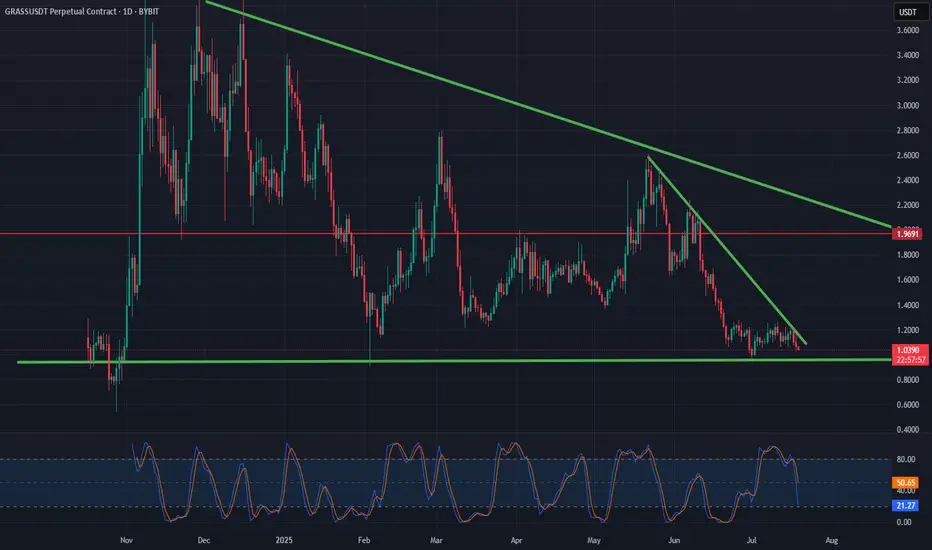
$GRASS - Potential BreakoutBYBIT:GRASSUSDT | 1D
Consolidating within this range, setting up for a potential breakout.
We can long this so long as we trade above 1.14 (equilibrium)
Stoploss: Below 1.05
TPs:
1.32 to 1.40 (scalp)
1.62 to 1.67
1.84 to $2
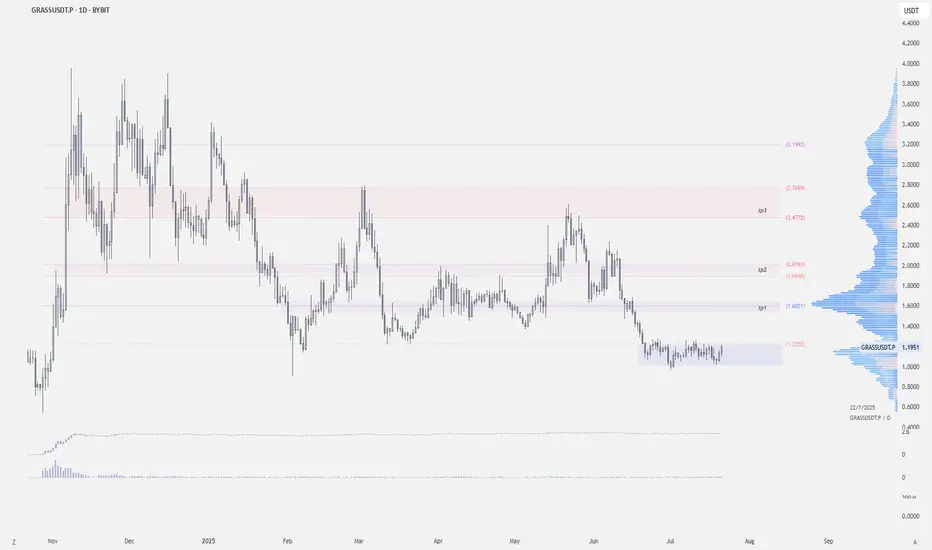
When Breakout??Downsloping trend on daily, breakout could be explosive..
Seems to be gathering liquidity around the $1 to $1.10 mark.
GRASS About to EXPLODE or COLLAPSE? Traders Could Get Trapped inYello, Paradisers! Are you ready for what could be one of the most deceptive breakouts we’ve seen this week? #GRASSUSDT is showing signs of strength, but as always, we need to stay sharp and look beneath the surface to avoid getting trapped like 90% of the herd.
💎#GRASS is knocking on the door of a key descending resistance trendline that has been respected multiple times this month. The current price action is attempting to break above it with momentum, and a confirmed breakout could trigger a strong probable impulsive move toward the next resistance levels at $1.2630, $1.3959, and eventually even $1.6512.
💎But what gives this setup its real probability strength is what most retail traders are overlooking: the confluence between minor support at $1.10–$1.15 and the short-term EMAs on the 4H timeframe. The 50 EMA and 100 EMA are starting to curve upward and align just above this support range, offering a strong dynamic base. This zone isn’t just visual support anymore—it’s turning into a technical launchpad.
💎From a technical standpoint, any clean 4H candle close above the trendline and $1.2630 resistance will increase the probability of continuation toward the mid-range resistance near $1.3959. However, failure to break above this zone convincingly or a rejection back into the previous range could signal that market makers are just pushing price up to trap breakout traders before dumping it again.
💎Support remains firm in the $1.10–$1.15 zone, but invalidation is crystal clear — any 4H candle close below $1.0549 would negate this bullish outlook entirely and suggest a deeper move is coming. That level has held well so far, but remember: one quick breakdown can wipe out many weak hands.
💎This is exactly the kind of setup that separates emotional traders from strategic ones. Many will FOMO in right at the breakout without considering the higher timeframes or waiting for confirmation.
Strive for consistency, not quick profits, Paradisers. Treat the market as a businessman, not as a gambler. Only the patient and prepared will survive and profit from these types of traps. Let’s continue to stay smart, strategic, and wait for the best high-probability opportunities.
MyCryptoParadise
iFeel the success🌴

$GRASS - Scalp Long IdeaBYBIT:GRASSUSDT | 6h
Entry: $1.02 to .98
Conservative entry/dca level: .97 to .95
Stoploss .90
TPs:
1.12 to 1.20
1.36 to 1.42
1.46 to 1.54

BIG PUMP ON GRASS COIN THAT NOONE TALKS ABOUTGRASS is setting up for a major reversal from this falling wedge structure. After a prolonged downtrend, price has now reached the apex of a well-defined descending wedge, supported by a key ascending trendline. This area is shaping up as a high-probability buy zone.
On the chart, we can see price respecting both wedge boundaries and now reacting to the lower support line. This is a classic setup where breakout potential increases significantly. The compression of price action inside the wedge suggests a strong move is imminent.
Looking at Market Cipher B, momentum is showing a clear bullish divergence. Multiple green dots have printed on the oscillator, and money flow, while still negative, is beginning to curve upward. These are early signs that sellers are losing control and buyers are stepping in with strength.
Volume has also dried up on this last leg down, which is typical in wedge structures before a breakout. Low volume near support and divergence on a trusted indicator often marks the beginning of a trend reversal.
From a risk-reward perspective, this setup offers a strong opportunity. A break above the descending resistance could propel price toward the previous key resistance levels around the $3.40 zone. Always place your take profit just below major levels to ensure execution.
Leave your thoughts in the comments. Are you long here or waiting for confirmation? This is not a trade setup, no stop-loss or take-profit is shared publicly. Trade with discipline and confidence.

GRASS might finally pump! GRASS - "A retail trader´s dream": I have an eye on the chart since some days. It could have went for a lot higher prices while being at 2.10, but unfortunately it didn´t. Maybe fortunately? The profile probability up there at the pmVAH wasn´t given. What´s the story now? Price rejected the pmPOC for a potential bullish FTR. As long as this remains valid, we are targetting the origin of the move. In this case this is all the liquidty up there at the pmVAH, where price came from. So the bullish FTR with the pmPOC as your key level is your foundation for a long setup. Yesterday it wicked again into the monthly liquidity level, which is like a pmVAL. This was your long. I didn´t take it, because I was in LDO, INJ and DEGEN. I just longed it tho at 1.62 a few minutes ago because of aggressive shorts and decreasing selling volume in the 30 min timeframe. These boys are trading against the probably bullish FTR (bullish rotation). For me this was a good local pullback to take a long. Probable 4 hr higher low here aswell, good. The pwVAH is the main target number 1 at 1.9390. Target 2 is the pmVAH at 2.1610, being the origin of the move and providing liquidity for the grab. Sometimes I like to have a look at sequences to have a higher timeframe direction and more importantly get a better understanding for the higher timeframe structure / foundation. Is it weak or strong? This one is strong as hell. IF the price can break the high blue "A" after the bullish FTR, it would activate a bullish sequence. Let´s say that sequences increase the chances for an expansion based on the price structure. The special thing is that the blue "A" is so close to the yellow "A" which would activate another bullish sequences. Two sequences like this mean that price will likely just expand super high and fast without stopping at the high or 100 extension. So we are having a high probabilty to run for the ATH, once the blue "A" gets broken.
Then it would also activate the biggest bullish sequence, revealing likely ATH targets of 4.30$ and higher. It is a very good long term outlook. There was a bearish sequence that was bringing the price below the big 100 extension, but with the current foundation it is more likely to run for the highs than to keep expanding lower.
I want to stress that I won´t hold my long until 4.30 or higher. I am trading profiles. The sequences only provide a possible long-term outlook, but you rarely see such a good "ladder" of sequences, at least once the blue "A" get´s broken (the high).
So I am planning to TP at the pwVAH (most of it), then a small runner for the pmVAH and a smaller runner for 4.30 (new expanded ATH).
If the price would lose the pmPOC and the monthly level and starts to find acceptance below, then I would need to think about cutting the long. Price would likely rotate to the pmVAL to finish the bearish rotation. For now, after rejecting the pmPOC and being above the monthly and fresh pwPOC, looking for longs is a damn good idea. No trade or a long.
We are also having local aggressive sellers on decreasing volume. Such a bad spot to hard sell, if the bullish FTR is your likely scenario.
Cherry on the cake at GRASS. Last week price was dropping also into the 1.272 expansion from the previous week. There are most of the stops. Such a nice confluence with the pmPOC and monthly liquidity area. So if most of the stops got taken and retail got punished, is an expansion to the downside probable? I am buying.

GRASS PERPETUAL TRADE ,Sold From $2.18GRASS PERPETUAL TRADE
GRASS SELL SETUP
Currently $2.18
Sold From $2.18
(Trading plan If GRASS go up to $2.30
will add more shorts)
Expecting target $2.11 OR DOWN
In the event of an early exit,
this analysis will be updated.
Its not a Financial advice

GRASSUSDT FallLet's keep it simple on the chart, as per the analysis on 1 hour and 1 day chart, the trend is down, and it's retesting the RSI overbought zone, good time to take the trade with 1:2 risk reward.
Please wait for the Bearish candle confirmation before entry.

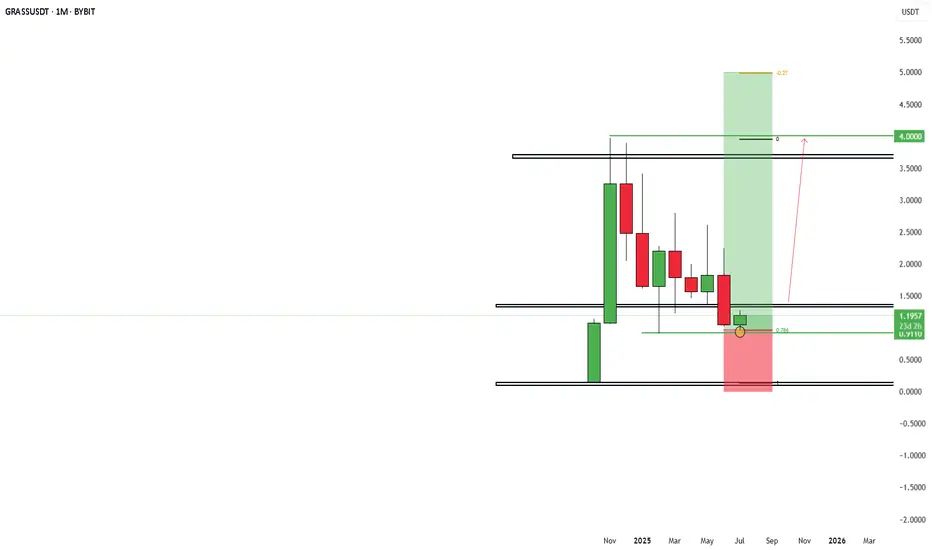
GRASS will DOUBLE in price within the next weeks. Grass has built a strong foundation during the past months. Price is very corrective and contracting every since. Locally it looked like a rejection off the upper pmPOC (previous month point of control) which is bearish. Well yes, it rejected but just short term. Market structure remains bullish. The price is building value above the pmProfile (previous month profile). Locally it is just leaving liquidity behind.
In my opinion GRASS is really setting up for a meaningful really and 2.15 ish will be one of the very last buying opportuinites.
4.67 is my main target and once it breaks the upper key level, it will just keep going.
The current FTR draw target (failure to rotate - because it can not bearishly rotate the pmProfile below) is slightly below the key level.
The stars align pretty well.
Honestly, this is one of the best charts I have seen lately.

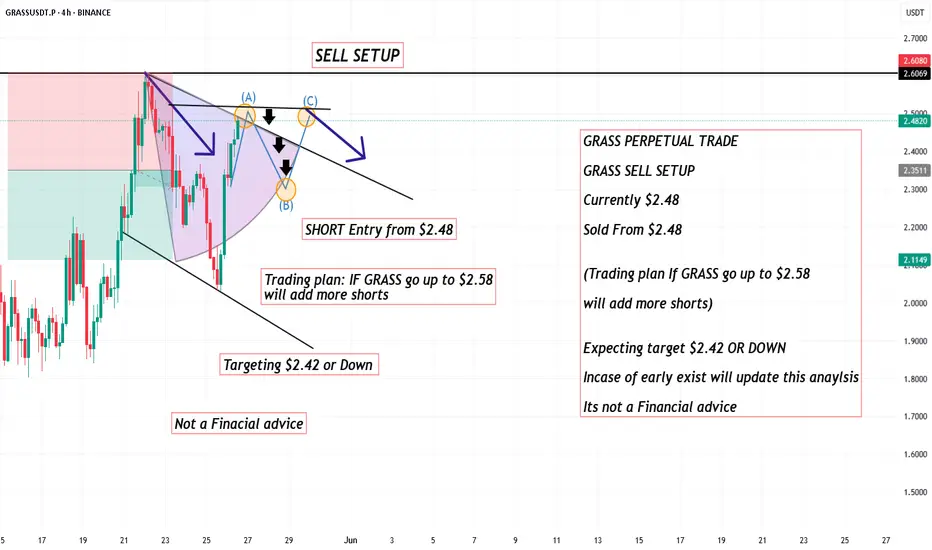
GRASS PERPETUAL TRADE ,Sold From $2.48GRASS PERPETUAL TRADE
GRASS SELL SETUP
Currently $2.48
Sold From $2.48
(Trading plan If GRASS go up to $2.58
will add more shorts)
Expecting target $2.42 OR DOWN
Incase of early exist will update this anaylsis
Its not a Financial advice
Grass short (scalp)Grass short retesting golden zone of fib 0.5 / 0.618
If we have a rejection in that zone then it can be a new support en we can look for an entry for long position.

GRASS movement lining up with M2 Supply on 120 day offsetI created this chart on GRASS, with the M2 and on offset of 118 Days. Seems to line up pretty well with the chart. If so, Grass may pump soon. Just my two cents, NFA DYOR :)

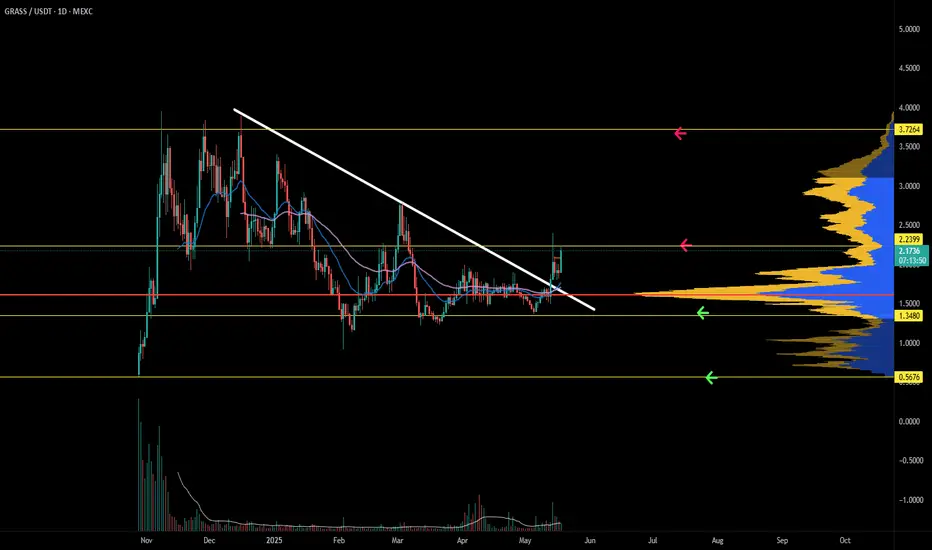
$GRASS just broke out of a long-term downtrend!$GRASS just broke out of a long-term downtrend!
#GRASS has broken out of a long-term symmetrical triangle and flipped the trend bullish.
Price is currently holding above the breakout zone and also respecting the 0.786 fib level from the recent range.
As long as it stays above the $2.13–$2.14 zone, the move toward $2.60+ looks likely.
This breakout could be the start of a bigger trend shift. Let’s see how it holds up in the coming days.
DYOR, NFA

Grass short to $2.15Recently entered a short position on grass. Targeting $2.15
Stop: $2.3306 or higher
Roughly 3RR
Dtt strategy applied . The odds are in my favor

GRASS Looks Bullish (1D)It appears that a triangle has completed and the B-D resistance line has been broken. Buy/long positions can be considered during pullbacks.
We have identified two entry points for potential entries.
Targets are marked on the chart.
A daily candle closing below the invalidation level will invalidate this analysis.
For risk management, please don't forget stop loss and capital management
When we reach the first target, save some profit and then change the stop to entry
Comment if you have any questions
Thank You

Grass is moving on up. GRASS broke an important trendline but did not confirm a proper high high. Momentum is entering overbought conditions, and the trend oscillator is still showing strength to the upside. Lower timeframe dips should be avoided. Until the Daily timeframe is not overbought, more upside is still possible.
Full TA: Link in the BIO
Grass short to $1.7755Another attempt on grass short. This time with big ass stop. Will look to scale in later on maybe given I see a more decisive move in my favor.
Time sensitive, see chart for stop and targets

Grass scalp short to $1.76 areaJust opened a scalp short position on #GRASS
Target $1.76 area
stop: $2.0085 or higher
Roughly 2 RR
My Dtt strategy applied
#grassusdt

"Scalp Shorting GRASS at CMP Entry Plan Inside!"📉 Scalp Short Setup: #GRASS
⚙️ Leverage: 5x to 6x
🟢 Entry 1: CMP - 1.8650
🟢 Entry 2: 1.9000
🎯 Take Profits:
TP 1: 1.8464
TP 2: 1.8277
TP 3: 1.8091
TP 4: 1.7718
TP 5: 1.7345
TP 6: 1.6972
🔴 Stop Loss: 2hr Close Above 1.9330 (~2.7%)
📌 TP's & SL will be updated as price action develops.
🚨 Not financial advice. DYOR before entering any trade!
