GRTBTC trade ideas


grt bounces from diag R to wave 5grt is touching & bouncing from diag R ( grtusd same pattern) need to break prev LH 0.00002313 to continue wave 4 if not correction wave resumes.

grt readying for another climbgrt btc pair now in wave 4 preparing ground fro wave 5 near 161 fib levels
grt usd pair going to 1.2

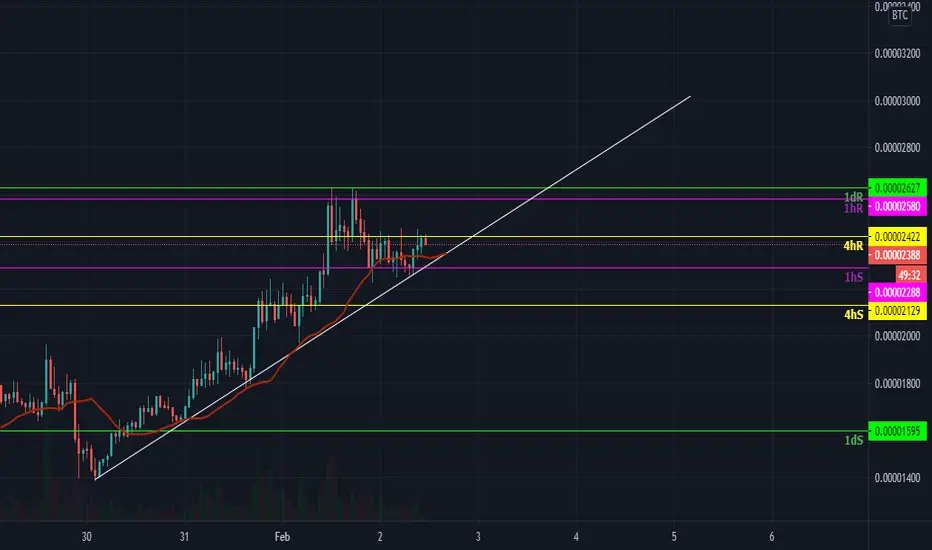
GRT/BTC - ascending triangle and solid fundamentalsGRT/BTC has been setting up an ascending triangle since roughly two weeks and had two fakeouts in a row due to BTC's spike but now looks promising for a long position after successfully retesting the uptrend.
Either DCA as long as it's inside the triangle or buy after it breaks through the resistance.
Buy zone: 1640 - 1850 sats
Important resistance: 1900 sats
On the USDT pair it recently broke out of a symmetrical triangle and finished testing the prior resistance as new support:
Consider using a stop loss a bit below the uptrend in case the trade doesn't work as planned.
Best of luck and let me know what you think.

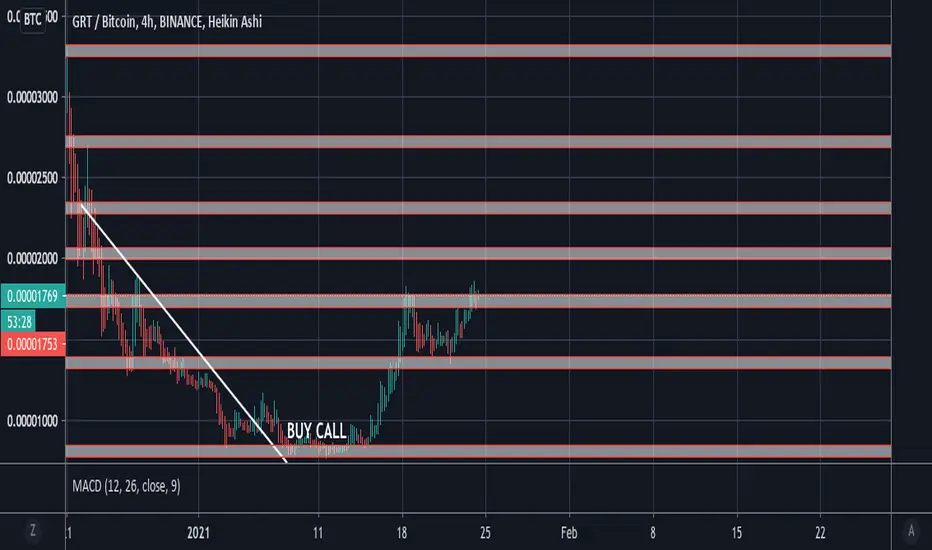
90% PROFITS GRTEverything in the chart. I upload it since several persons asked me to so they can follow it. I'm posting it agains USDT too, nice escenario.
Trade carefully! SL on point please, BITSTAMP:BTCUSD is critical (volatility).

GRT BTC Price Forecast 31 January 2021 — GRT UPGRT price forming Flag shape and in bigger scale you can see Inverted Head and Shoulders.
Consider this patterns bullish, we might see a +30% breakout target at 2300 zone.
Best regards
Artem Shevelev
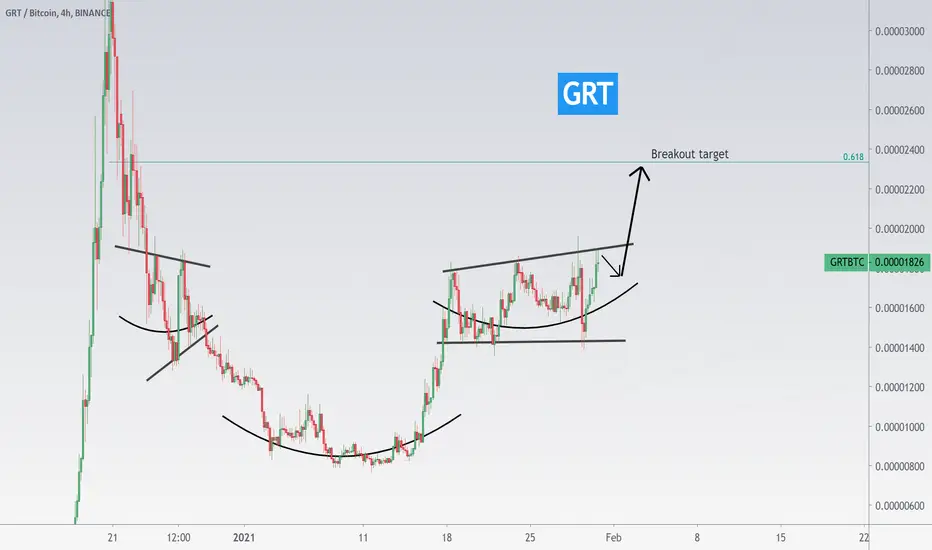
#TheGraph #GRTBTC (Binance TF. 4-hour)Cup & Handle pattern with breakout validated that could send #GRT rocketing higher price!
The Graph is ranked Top45 at the CMC, with a capital of $913,092,648 capital. (273 millions dollars more than 4 days ago)

GRTBTC BUY OPPORTUNITY WITH 200% TARGET IN VIEWHello guys,
Spotted perfect Cup and Handle setup here and price already attempting to break through the neckline. We have two different ways of joining this move, we can wait for the provided BUY zone or if the breakout happen without testing that zone, we should join the rally by waiting for pullback on neckline.
Kindly go through the chart and leave us your comments with your likes and also follow us for more trading updates.
Thank you.
Note:
It will be good to always understand risk involve in trading. Always trade with stop Loss in place.
Set up an entry/exit strategy for every trade, with good risk/reward ratio.


GRT/BTC - BullishGRT is looking bullish against the King Kong Dong Fuck The Suits BTC
Get off Robinhood, WeBull and any other Scamming Brokerage that haulted the mega pumps. GET OFF THE SYSTEM. GET OUT OF BANKS, DEBT and anything else that feeds the PIGS!


is grt/btc breaking bullish triangle?In my opinion, GRT is one of the best coins for investing long term as UNI, AVAX, AAVE, ALGO, SKL, SRM , 1INCH as new coin and SC, XEM, ETC, ETH, XVG, ENJ, RVN, IOST, ADA, VET, NEO, NANO, and link ,..... beside from the these technical analysis point of view try to buy small box from each one and hold it until November of 2021 or May of 2022, It will give you a huge profit. the targets for buying and selling drawing in the chart. all in all, it must be mentioned that, it is my point of view according to biography of their company and their past behavior and chart, so try to google it and then invest in these coins.

The Graph (GRT)Hello!
Possible Cup and Handle formation or falling wedge movement on The Graph.
Possible scenarios:
There is cup and handle (bull)
There is falling wedge (bull)
It's possible that we retrace to previous low where is also 200 EMA (red line) on 4hr and bounce from there.
To break the last high we need to see RSI break the resistance lines.
Price has tested the price resistance line 4 times. Usually the fifth or sixth time breaks it. If.. We will get a move upwards.
If BTC takes a big leap downward or uwards this analysis is in danger.
Right now Bitcoin is in a place where it will soon take a bigger moves atleast for my eye.. So be careful
What I have learned about The Graph Protocol it sounds pretty good for a long term holding and it really solves a problem blockchains have by organising open data and making it easily accessible for applications.
If you take trades (not holding long term) use stop loss.
Otherwise you will get your ass burned!
-Jebu