GRT Price Can Go Down Below The Major Support Of $1.5The weekly technical chart of The Graph showcases a consolidated momentum. On coming to 4hr cart, GRT price is below 100 and 50 Moving average. The 100 MA(Red) line is at $1.16, making it temporary support for the coin. Resistance for the coin on going upside is at $1.8. While on the downside, the coin can see a bounceback from $1.There is a formation of bearish engulfing pattern on the chart If the price goes 10% below the support ,then a new low upto $0.7 can be formed.THETA/BTC pair is currently performing negatively and can break the previous support zone.
Kindly comment your thoughts below
GRTPERP trade ideas


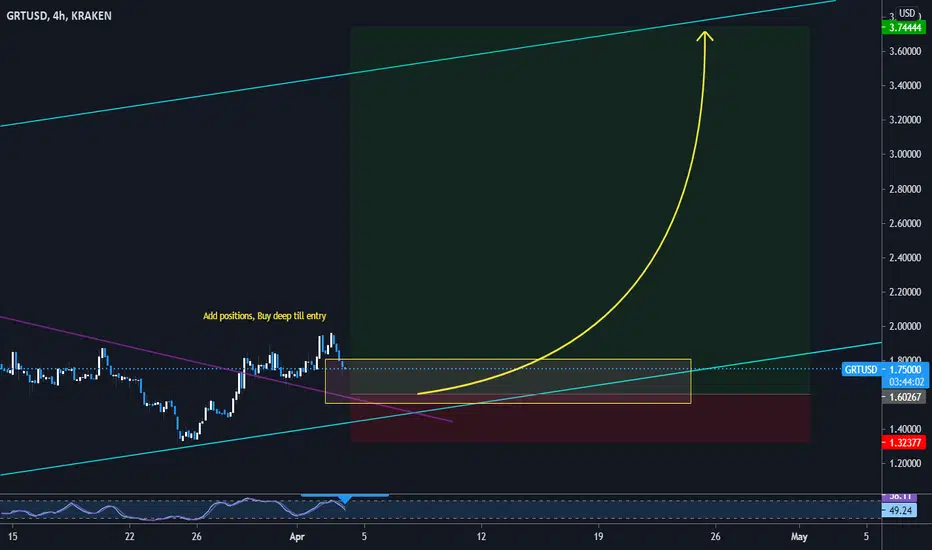
GRT/USD: Accumulate / Add on breakoutplaying this one a little early but ALTS looks bullish AF across the board and this one is lagging (albeit after a monster run up in Feb)..will accumulate and add more on a breakout.


GRT to $4. Keep and eye and Don't Miss this great Opportunity!Looking at GRT, the potential to the upside could definitely be very soon. Don't miss this opportunity guys. I will add more info soon. Cheers!
GRT againcomplex inverse h&S like a lot of these scoins. i like divergences on both oscillators in this case though. as well as the double bottom prior for extra confirmation that the bottom is in. same plan as the other 2 i listed today


GRT/USD - 10k position | BULL FLAGHey all,
This is just my take on GRT & current sentiment. After we saw a slight spike in BTC & ETH and it still being stuck in a consolidation pattern for now that could help alts finish their patterns out. I would love to see GRT onda around 2.00 and hold above it for a day or so then continue through making new highs. It would be great if GRT goes to $2 organically then follow through along with the market as I see BTC heading to 65k plus in April. If we for some reason moon shoot to $2 plus here I’ll update but for now here is the bull flag and first target is $2.
Updates following soon

GRT: Alternating corrective waves 2 and 4. Wave 5 up startingOne of the guidelines for waves 2 and 4 of Elliott Waves is that they are often alternating in form. If one is sharp, the other is often flat. You can can see wave 2 for GRT was a sharp zigzag. Wave 4 has been flat and lasted longer than I expected. The consolidation looks to be over with an impulse wave to kick off wave 5. The crypto market looks healthy with altcoin leader ETH recently breaking resistance. Buckle up!

GRT looks bullish on the daily log chartGRTUSD already broke out of the corrective structure and retested the upper boundary. It looks like we’re ready for another strong impulse up.

GRT LONG IDEAIt's alt season, so expect fundamentally strong alts to perform exceptionally well.
GRT is one of those and will be integrated in the entire crypto ecosystem just as much as chainlink is
Dubbed the Google for blockchain, it's already processing billions of transactions. This is my swing trade setup
Buy zones are outlined as below
SL: $1.68
TP zones as outlined
I'm excited for this one, let's see

GRT The Graph - Target close to $8I like this coin for its fundamentals.
The above idea shows a possible breakout over the next month.
Not investment advice.

GRT Cup and HandleFirst of all, congrats to you all who are realizing gains from today's (ongoing) pump! This may be obvious, and its not like things aren't already moving up, but just wanted to point out this beautiful Cup and Handle formation on the 15 min chart. The target approx. $2.07, with some resistance in between. Marked on the chart for your consideration. What do you think?

GRT/USD - BuySome alts look good rn. grt is shaping up well.
Blue zone is last support. Cant drop below
Thanks

quick GRT chart update/correction of POTENTIAL BUYZONE
hey guys just was taking a quick look at GRT
its starting to confirm alot of trends , this will be about the 4th false pump i have seen . normally with GRT since the launch it has normally stuck to the trend , confirming each on chart until rise . but now i have seen multiple false pumps , one can say that it is confirming a downward trend , but on a larger scale , it looks like it preparing for something BIG , with these drops of $0.20 becoming common , we can expect it to start moving 0.40 on a stroke to confirm a high rise in price
looking at the 1hr chart shows a little insight on how i got to this .

GRT Friday Fake-outIf GRT breaks down Friday leading into the weekend this is what I would be prepared for... If this happens I expect GRT to pump hard until Sunday, when I think Bitcoin will pump. Not financial advice. Good luck traders.


GRT/USD Analyshere we a head and shoulder pattern that is saying us the bearish trend is going to be end here
so if the price can break the neckline we can complete our long orders
but if we had 4h or D1 close candle below the SL line we should close our orders.
i will be happy to know your ideas about this. COINBASE:GRTUSD


Scalp trade long on $GRTPERP in anticipation on e2eThis is a scalp trade and is very risky
The idea is whether it does an e2e and then goes for ATH
target ATH
Sl around $1.5360
Will the Super algorithm indicator bullish sign give more here?

GRT looking to breakout of channel.GRT is currently sitting nicely at the top of this channel.
If it breaks up, entry will be at retest of approx $1.85. with a SL underneath the upper channel limit.
My indicators are starting to look bullish again on the daily and 4H timeframes, so potentially a breakup here.
Happy Trading.

Bull Flag on the weekly with Possible Breakout points.$GRT
The gold Trend lines show a bull flag pattern, The red lines and blue line indicate support and resistance levels and corollate with possible entry points. The paths show my idealistic path to our biggest gaining breakout point and also possible false breakouts that may or may not extend the length and time of the bull flag pattern or dissipate it entirely.
$BNT
Current Long position

