GRT Breakout! Plus Targets is breaking out.
- GRT has broken out of long-term resistance.
Flipped the EMA Ribbon; and, Conquered the 200 EMA Targets are $1.2, $1.5, and $2.
Use a stop-loss according to your risk appetite.
GRTUSD.P trade ideas

GRT on the way back to the top GRT price broke out from falling wedge pattern, made a retest at $0.62 and continued to grind higher to first major resistance at $1. Daily chart is bullish and I’m looking forward to next major resistance at $1.45 followed by $2.4 as my final target for now. Supports are at $0.755 and $0.627.
As always, for such a bullish movement ETH and BTC should stay bullish or at least trade in range for GRT to outperform.

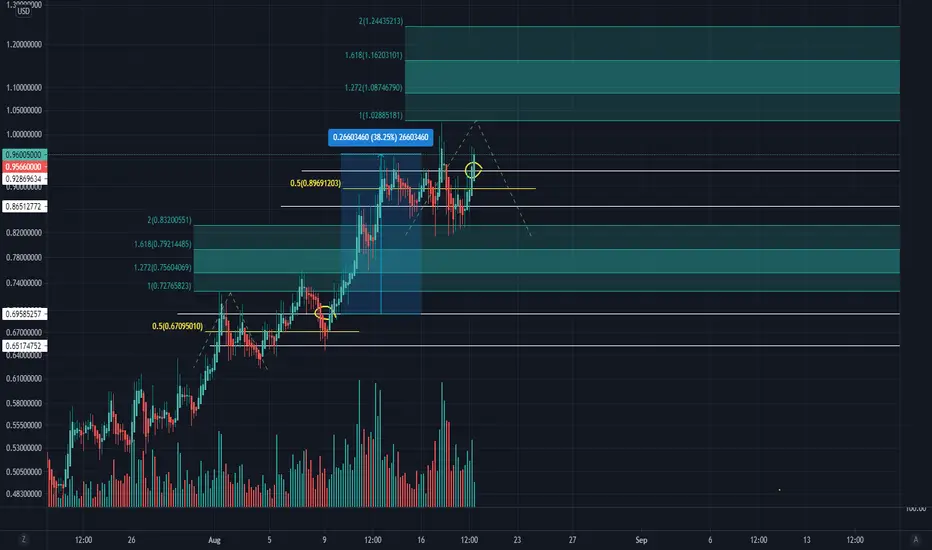
GRT Advance Continuation pt. 2GRT Continuation
Cumulative Gains from Preliminary Entry (.6952): 38.25%
Prognosis: GRT firing up for another markup continuation.
Had you entered this trade with me and taken profit only and not exited, you would've netted 38.25% gains in 14 days.
Not a bad return!
*Do you like big wins and big money? Do you have strong hands and patience?
I'm a full-time Wyckoff VSA crypto swing trader (since 2017) and I regularly seek out the most lucrative swings available on all the major exchanges.
All my charts are clean, straightforward, and easy to follow. No junk, no needless indicators, just solid volume spread analysis ( VSA ) and simple 'take-the-money-and-run' Fibonacci target zones.
My win rates are between 80-85%. Follow me on TradingView and see for yourself.
I review over 300 coins & tokens daily and handpick all the runners myself (no bot signals).
** Not financial advice. Please trade at your own risk.
graph denying pullback and is establishing bullish trendgraph's pullback is developing into a new price floor with its direction slowly taking shape into an upwards trend


Uptrend Starting For GRT/USD?COINBASE:GRTUSD
BINANCE:GRTUSD
COINBASE:GRTBTC
COINBASE:GRTBTC
Chart mainly explained in the chart text
Bullish setup for GRT looking more & more likely lately after that recent breakout.
Watching this one closely as a local uptrend looks to be starting after that breakout earlier.

GRT - Well, this looks familiar ...I remember watching GRT hit a dollar last February, and like a lot of people watched it fall back a bit. I was in profit, as i mostly bought around $0.50 and happy with my gains. I sold, only to watch it skyrocket to close to $3.00. I bought and sold a few times around $2, but when it fell (with everything else) I was able to buy enough at $0.50 to get my average buy to $0.60. I'm happy with my gains now, but this time, i'm NOT selling this time.

GRT +400% Target?!This little crypto could net some pretty awesome gains if this bullish shark plays out to the 1.236% Fib extension at $3.75 .
Now that we broke the trend, I think it'll pull back to $0.75 pennies before taking off.

Late Entry Inverse Head And Shoulders Continuation Above PCZGRT has broken Above Our Buy Zone and is now forming a potential continuation pattern above it. I previously stated that GRT was at the PCZ of a Bullish Gartley on the Monthly and now we are above the PCZ but there still may be a chance for those who are here late to enter.
For the context behind the Monthly Bullish Gartley look at the related chart below.

Graph A 10X PotentialIf crypto continues to rise as it did during the beginning of the year, then there may be a potential 10bagger here

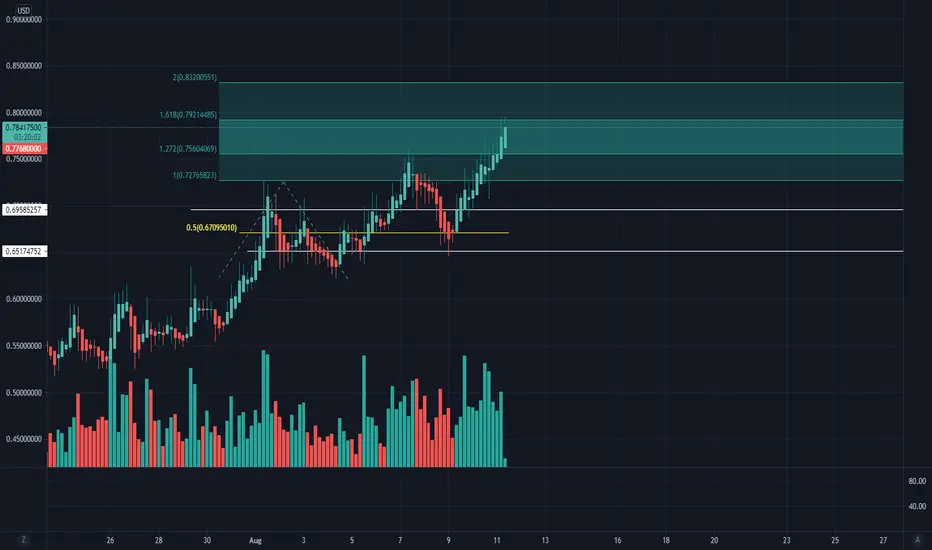
GRT: More to GoI entered GRT early at .6952 and collected 14% gains so far. But I still think it has some area to cover, having not yet crossed the 2.0 Fibonacci threshold. This is the chart I've been using to track its progress.
Do you ike big wins and big money? Good! Me too!
I'm a full-time cryptocurrency swing trader (since 2017) and regularly seek out the most lucrative swings available on all the major crypto exchanges.
My win rates are between 80-85%. Follow me on TradingView and see for yourself.
All my charts are clean, straightforward, and easy to follow. No junk, no needless indicators -- just volume & spread analysis with simple 'take-the-money-and-run' Fibonacci target zones.
Good luck and safe trading!
** Not financial advice. Please trade at your own risk.
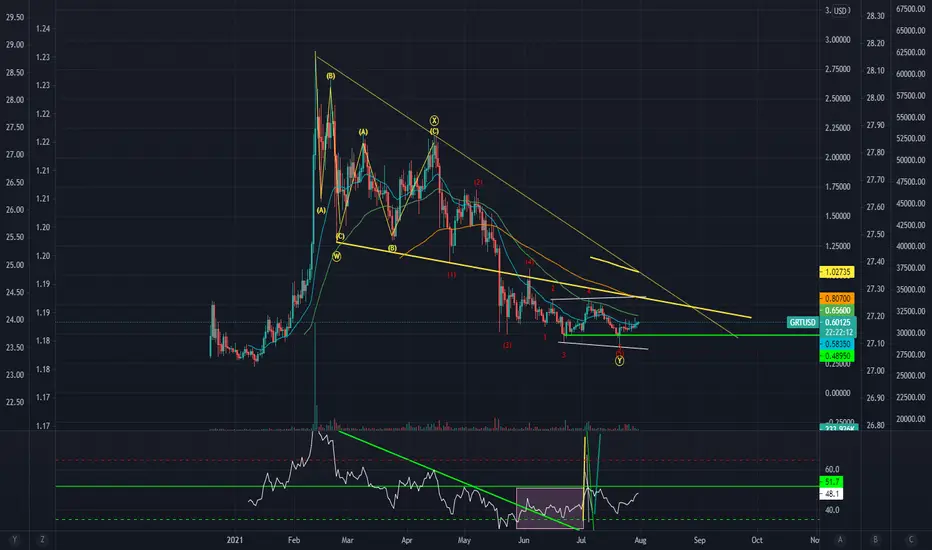
TheGraph Yes but Waiti was surprised by the weakness of one this big project while BTC was correcting.
No impulse, No rage, No Surprise. Stayed in perpetual weak downtrend for now.
------------------------------------------------------------------------------------------------------------------------------------------
- So i will give a trading simple way :
- Should wait GRT break his Downtrend and pass 1$ to invest in.
- TP1 : 2$
- TP2 : 3.5$
- TP3 : 4.8$
- The new GRT Bottom should be around 0.45$ but have to be prudent in cryptos.
- In Any of this cases if BTC makes a fast Dip (BearTrap), i suggest you to keep some Cash to get GRT around 0.2$.
------------------------------------------------------------------------------------------------------------------------------------------
Stay Safe
Happy Tr4Ding !

GRTUSD H16: Best Level to SHORT IT 40% gains(SL/TP)(NEW)Why get subbed to me on Tradingview?
-TOP author on TradingView
-2000+ ideas published
-15+ years experience in markets
-Professional chart break downs
-Supply/Demand Zones
-TD9 counts / combo review
-Key S/R levels
-No junk on my charts
-Frequent updates
-Covering FX/crypto/US stocks
-before/after analysis
-24/7 uptime so constant updates
🎁Please hit the like button and
🎁Leave a comment to support our team!
GRTUSD H16: Best Level to SHORT IT 40% gains(SL/TP)(NEW)
IMPORTANT NOTE: speculative setup. do your own
due dill. use STOP LOSS. don't overleverage.
Tagged as SHORT because I expect short-term
losses in this market.
🔸 Summary and potential trade setup
::: GRTUSD 16hour chart review/outlook
::: XABCD BEARS setup
::: expecting breakdown soon
::: heavy resistance overhead / rejection
::: BEARS get ready to SHORT IT
::: SHORT/HOLD and exit at +40% gains
::: chart is weak overall
::: recommended strategy: SHORT IT/HOLD
::: TP BEARS +40% gains
::: correction mode soon
::: good luck traders!
::: SHORT IT and get paid. period.
🔸 Supply/Demand Zones
::: N/A
::: N/A
🔸 Other noteworthy technicals/fundies
::: TD9 /Combo update: N/A
::: Sentiment mid-term: BEARS/REVERSAL
::: Sentiment outlook short-term: BEARS
RISK DISCLAIMER:
Trading Crypto, Futures , Forex, CFDs and Stocks involves a risk of loss.
Please consider carefully if such trading is appropriate for you.
Past performance is not indicative of future results.
Always limit your leverage and use tight stop loss.

Graph Under Accumulation Since MayBullish reversal breakout pattern confirmed when price crosses above .80

GRT Primed for a big run!!?The graph has been under performing recently even though i still remain long term bullish on this great project, we could be ready for a big run coming soon if we can take out a couple key levels. First being the first pivot point we directly are on as of right now, it would be very ideal for GRT to jump above and secure this level for our daily close, next will be the previous pivot point which is above and to the left of our first one, i think we will continue to face resistance here so getting above on the first attempt may not happen, the most ideal level we need to get above before we can really say we are in an uptrend again is the 0.2 FIB level, we haven't been above this level since late May. Looking at the bollinger bands we actually are looking bullish, price action is starting to cling onto the top band which as you guys know can induce a very nice big run to the upside, if i had to guess on where we could land if this plays out, i would say atleast the first level of resistance (R1). Looking at the MACD we are in bull territory but we need to keep pushing upwards to see our blue MA keep separating away from the orange or we risk having a bearish cross, our histogram seems to be really flattening out with our green bars staying the same or getting less, so looking at that i think we might be in for a bearish cross soon but there is a chance we could get a bounce aswell, definitely need to see some momentum and volume for GRT if we are going to keep pushing up. Not financial advice just my opinion!

The Google of CryptoWanna be rich? Me too.
Not sure if this will do it, but it's better than the other chances I got.
All time low.
Great crypto. Amazing concept with over 3 years of Beta testing before launching just last December.
Downside risk is -50% but the upside reward will be at least +500%.
Let's GOOO!!!
(Not Financial Advice....but yah know...)
30 Minute bearish Bat PCZ Approaches: RSI Will Be OverboughtRSI will likely be overbought by the time we reach the PCZ i will be preparing to enter my position when it gets there.

GRT is turning aroundBeen watching GRT for months now and finally seeing the turnaround start. There is a clear bullish divergence in both the RSI and the MACD. As the price has continued to decline while the RSI and MACD signal lines have been climbing. Finally seeing an RSI breakout (for the moment) and I jumped in with a starter position here.

Another Attempt at the big recovery Rally GRT/USDSince the last setting of GRT - it looks as if it has developed another large falling wedge.
If we are able to break out from it - we could potentially see an 86%ish move from the break-out point.
There are of course plenty of S/R pitstops on the way, but that is assumed/baked in of course.
We need to establish S/R on top of this wedge - where currently getting above the 62-69 cent area would be important. Then you have the 75 cent resistance to establish as support - where the new S/R zone would be from 75 cents to 97 cents or thereabouts.
I still have the same view that we may go over a dollar again on this recovery rally - my bias is that we will then fall again market wide once this recovery rally is over. BTC would then need to put in its real bottom, and same for the alt coin market cap.
Plenty of areas of S/R added on this chart as potential targets.
Thank you!


GRT $$aslong as bitcoin consolidates the next few days ( which looks like it appears too be doing ) alts will have there run!


GRT/USD - Something that I'd missed from beforeThe fib sequence in Magenta suggests a case that maybe the bottom was at 42 cents. The market makers followed this sequence pretty much to a tee so far.
There is still plenty suggestion that it could go lower, too, but I'd missed this from before.
Interesting Stuff.
