Related pairs

GRT. USDTTake Graph seriously.
This project is the backbone of data indexing in the Web 3 world.
Although Graph has a market cap of $10.4 billion, its current price is only $0.093.
Graph organizes complex data for both Aave and Uniswap.
So it will be very easy for Graph to break through the channel and hit

GRT Main trend. 23 02 2025Logarithm. Main trend. Time frame 1 week (no need for less). Hype will be when they promote everything related to artificial intelligence. It may go against the general trend in this regard.
But, at the moment, behind the market, which is logical. I imposed dynamic support/resistance zones of the G

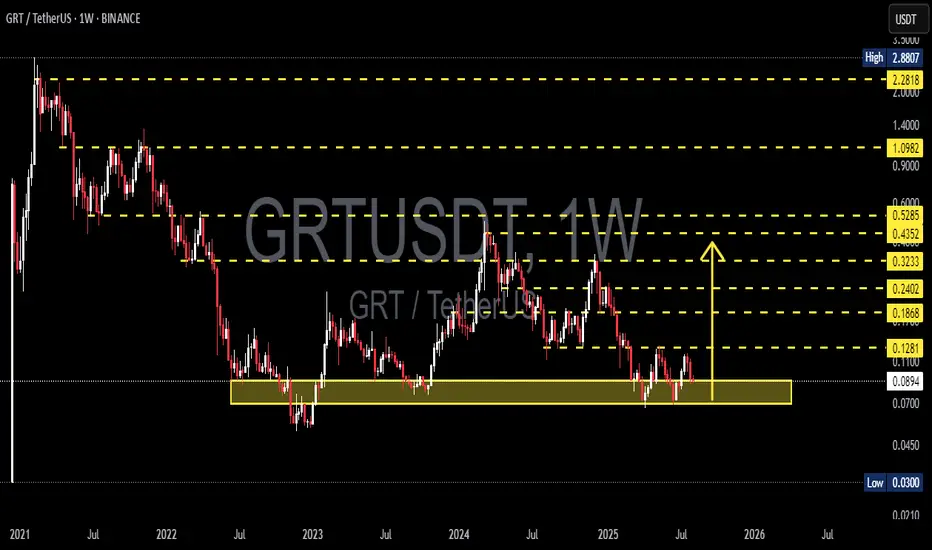
GRT/USDT Weekly Analysis — “Life or Death Zone” for The Graph!🟡 🔥 Critical Zone: Demand Area in Play!
The Graph (GRT) is retesting one of its most critical historical demand zones — the $0.0700 to $0.0897 area — a level that has acted as strong support multiple times since mid-2022.
> This zone is not just a support — it’s a make-or-break level that has defi
GRTUSDT Triangle Coil Tension Builds Bullish Breakout in FocusGRTUSDT is forming a clean symmetrical triangle with price rebounding from the lower trendline which brings an encouraging signal for potential continuation to the upside.
As long as the structure holds, we anticipate a breakout above the triangle, which could ignite strong bullish momentum. The e

GRT/USDT at a Crossroads: Golden Pocket Retest or Breakdown?The GRT/USDT chart is currently at a critical technical juncture, presenting a high-probability setup for both breakout continuation or breakdown rejection. Here’s a breakdown of the key elements visible on the chart:
---
📐 1. Major Downtrend Breakout
GRT has been in a long-term downtrend since i

Nice Bounce for GRT - What's next? *4 Hour Charting*I re-entered a trade at the 50ma (on the 4-hour) for a significantly smaller position than my previous trade where I went 40x long. There is no leverage here - not because I lack confidence in the trade, but because risk management is the single most important think you can do to protect yourself..

GRT. USDTThe Graph(GRT) is a Web 3 project that is used to search data from other platforms, such as Ethereum.
Similarly, AI (Artificial intelligence) developers can use it to promote their services.
And it has been in a neutral trend for a long time after a sharp correction.
Therefore, the probability of pr

GRT Short Term BullishOverall this crypto is very weak. Most alts are weak, with few exceptions. The Graph has actually been non-stop building even though the coin has bled out for 4+ years. I doubt the long-term trend is bullish, but on the short term, it looks like a standard head and shoulders pattern on the 1-hour.

Wave structure of GRT coin in week time frame- Week is swing bullish => current is pullback.
- Day is swing bullish => current is pullback.
- We can look for buying opportunities when there is a reversal signal on the 4-hour time frame or the price reaches the demand zone of the daily frame.

See all ideas
Summarizing what the indicators are suggesting.
Oscillators
Neutral
SellBuy
Strong sellStrong buy
Strong sellSellNeutralBuyStrong buy
Oscillators
Neutral
SellBuy
Strong sellStrong buy
Strong sellSellNeutralBuyStrong buy
Summary
Neutral
SellBuy
Strong sellStrong buy
Strong sellSellNeutralBuyStrong buy
Summary
Neutral
SellBuy
Strong sellStrong buy
Strong sellSellNeutralBuyStrong buy
Summary
Neutral
SellBuy
Strong sellStrong buy
Strong sellSellNeutralBuyStrong buy
Moving Averages
Neutral
SellBuy
Strong sellStrong buy
Strong sellSellNeutralBuyStrong buy
Moving Averages
Neutral
SellBuy
Strong sellStrong buy
Strong sellSellNeutralBuyStrong buy
Displays a symbol's price movements over previous years to identify recurring trends.
Frequently Asked Questions
The current price of GRTUSDT SPOT (GRT) is 0.09610 USDT — it has risen 0.47% in the past 24 hours. Try placing this info into the context by checking out what coins are also gaining and losing at the moment and seeing GRT price chart.
GRTUSDT SPOT price has risen by 0.50% over the last week, its month performance shows a −1.92% decrease, and as for the last year, GRTUSDT SPOT has decreased by −29.60%. See more dynamics on GRT price chart.
Keep track of coins' changes with our Crypto Coins Heatmap.
Keep track of coins' changes with our Crypto Coins Heatmap.
GRTUSDT SPOT (GRT) reached its highest price on Nov 9, 2021 — it amounted to 1.33860 USDT. Find more insights on the GRT price chart.
See the list of crypto gainers and choose what best fits your strategy.
See the list of crypto gainers and choose what best fits your strategy.
GRTUSDT SPOT (GRT) reached the lowest price of 0.05171 USDT on Nov 22, 2022. View more GRTUSDT SPOT dynamics on the price chart.
See the list of crypto losers to find unexpected opportunities.
See the list of crypto losers to find unexpected opportunities.
The safest choice when buying GRT is to go to a well-known crypto exchange. Some of the popular names are Binance, Coinbase, Kraken. But you'll have to find a reliable broker and create an account first. You can trade GRT right from TradingView charts — just choose a broker and connect to your account.
Crypto markets are famous for their volatility, so one should study all the available stats before adding crypto assets to their portfolio. Very often it's technical analysis that comes in handy. We prepared technical ratings for GRTUSDT SPOT (GRT): today its technical analysis shows the sell signal, and according to the 1 week rating GRT shows the sell signal. And you'd better dig deeper and study 1 month rating too — it's sell. Find inspiration in GRTUSDT SPOT trading ideas and keep track of what's moving crypto markets with our crypto news feed.
GRTUSDT SPOT (GRT) is just as reliable as any other crypto asset — this corner of the world market is highly volatile. Today, for instance, GRTUSDT SPOT is estimated as 4.81% volatile. The only thing it means is that you must prepare and examine all available information before making a decision. And if you're not sure about GRTUSDT SPOT, you can find more inspiration in our curated watchlists.
You can discuss GRTUSDT SPOT (GRT) with other users in our public chats, Minds or in the comments to Ideas.