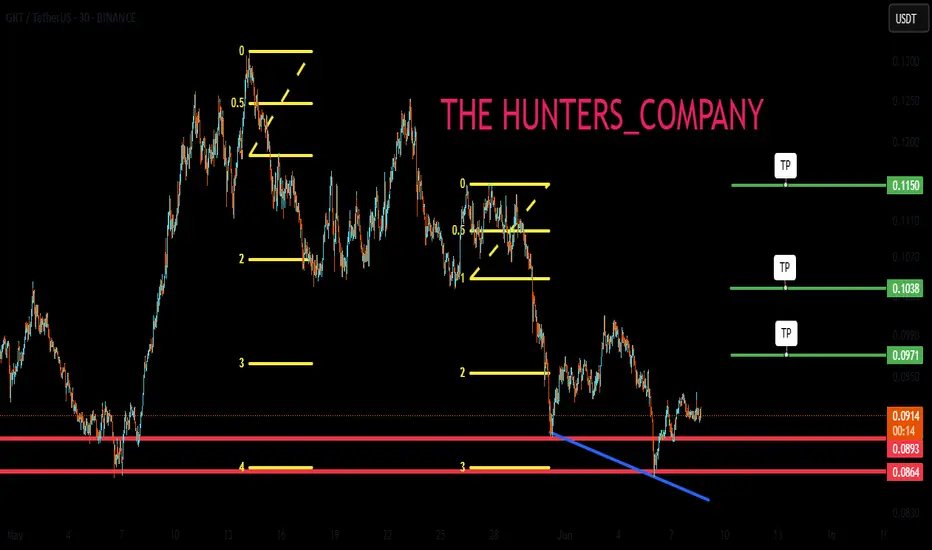
Maintaining support is necessary, not essential, for the climb.Hello friends🙌
🔊Given the price drop, you can see that the support we identified has worked well for you so far and buyers have supported the price.
Now, given the heavy price drop and disappointment in the market, we can expect a rise until the targets are set.
Don't forget capital and risk mana
GRT | Altcoins | MASSIVE UPSIDE Potential on The GraphAnother altcoin that has great upside potential is the Graph BINANCE:GRTUSDT
The Graph from a weekly perspective may seem like there's not much action, but if you zoon in to the daily timeframe we see a different picture.
WEEKLY:
VS DAILY:
We can see anything from a +40% increase to a -30%

The altcoin cycle is loading… don’t get caught chasing!Why It Might Be a Good Time to Start Building Your Nest Now 🥚🐣💸
If history’s taught us anything, it’s this: the best opportunities usually show up before everyone’s talking about them. 📈 Every cycle, whether it’s stocks, crypto, or real estate, rewards the people who start stacking early, not the o

GRTUSDT: Trend in daily time frameThe color levels are very accurate levels of support and resistance in different time frames, and we have to wait for their reaction in these areas.
So, Please pay special attention to the very accurate trend, colored levels, and you must know that SETUP is very sensitive.
Be careful
BEST
MT

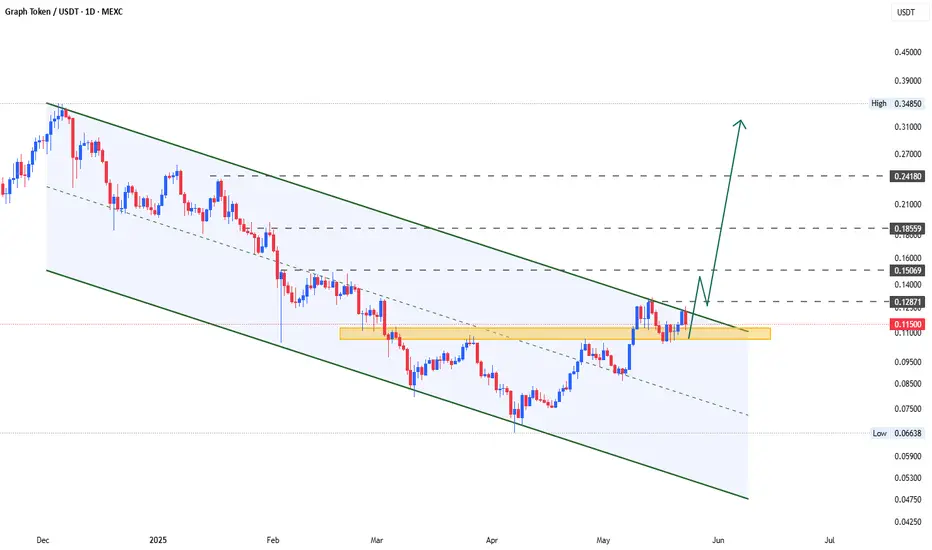
GRTUSDT 1D#GRT is moving inside a Descending Broadening Wedge on the daily chart and is now on the verge of breaking out above both the EMA100 and the wedge resistance. 📈
In case of a successful breakout, the targets are:
🎯 $0.1330
🎯 $0.1742
🎯 $0.2076
🎯 $0.2409
🎯 $0.2883
⚠️ Don’t forget to use a tight stop

GRTUSDT 1D AnalysisGRT ~ 1D Analysis
#GRT On the 1D time frame the selling pressure has stopped.. Buy on this support block with a short term target of at least 10%+ from here.

GRT Analysis (12H)From the point where we placed the red arrow on the chart, it seems that a large-degree triangle on the GRT chart has completed, and we are now in a new wave sequence.
In these new downward waves, wave A/W has completed, and it now appears we are in the middle of wave B/X.
We are looking for a reb

GRT channel is forming
Buy gradually from here or wait for breaking through this resistance line with a short-term target of at least 10%+.

GRT Testing Red Resistance – Breakout Potential! 🚀 JSE:GRT Testing Red Resistance – Breakout Potential! 📈
JSE:GRT is currently testing the red resistance zone. If the price breaks through, the first target could be the green line level! 📊
Let’s catch this breakout together! 💼💸

See all ideas
Summarizing what the indicators are suggesting.
Oscillators
Neutral
SellBuy
Strong sellStrong buy
Strong sellSellNeutralBuyStrong buy
Oscillators
Neutral
SellBuy
Strong sellStrong buy
Strong sellSellNeutralBuyStrong buy
Summary
Neutral
SellBuy
Strong sellStrong buy
Strong sellSellNeutralBuyStrong buy
Summary
Neutral
SellBuy
Strong sellStrong buy
Strong sellSellNeutralBuyStrong buy
Summary
Neutral
SellBuy
Strong sellStrong buy
Strong sellSellNeutralBuyStrong buy
Moving Averages
Neutral
SellBuy
Strong sellStrong buy
Strong sellSellNeutralBuyStrong buy
Moving Averages
Neutral
SellBuy
Strong sellStrong buy
Strong sellSellNeutralBuyStrong buy
Displays a symbol's price movements over previous years to identify recurring trends.
Related pairs
Frequently Asked Questions
The current price of The Graph / Tether USD (GRT) is 0.0873 USDT — it has fallen −1.59% in the past 24 hours. Try placing this info into the context by checking out what coins are also gaining and losing at the moment and seeing GRT price chart.
The Graph / Tether USD price has fallen by −3.13% over the last week, its month performance shows a −28.88% decrease, and as for the last year, The Graph / Tether USD has decreased by −64.03%. See more dynamics on GRT price chart.
Keep track of coins' changes with our Crypto Coins Heatmap.
Keep track of coins' changes with our Crypto Coins Heatmap.
The Graph / Tether USD (GRT) reached its highest price on Feb 12, 2021 — it amounted to 2.8757 USDT. Find more insights on the GRT price chart.
See the list of crypto gainers and choose what best fits your strategy.
See the list of crypto gainers and choose what best fits your strategy.
The Graph / Tether USD (GRT) reached the lowest price of 0.0003 USDT on Aug 8, 2022. View more The Graph / Tether USD dynamics on the price chart.
See the list of crypto losers to find unexpected opportunities.
See the list of crypto losers to find unexpected opportunities.
The safest choice when buying GRT is to go to a well-known crypto exchange. Some of the popular names are Binance, Coinbase, Kraken. But you'll have to find a reliable broker and create an account first. You can trade GRT right from TradingView charts — just choose a broker and connect to your account.
Crypto markets are famous for their volatility, so one should study all the available stats before adding crypto assets to their portfolio. Very often it's technical analysis that comes in handy. We prepared technical ratings for The Graph / Tether USD (GRT): today its technical analysis shows the sell signal, and according to the 1 week rating GRT shows the sell signal. And you'd better dig deeper and study 1 month rating too — it's sell. Find inspiration in The Graph / Tether USD trading ideas and keep track of what's moving crypto markets with our crypto news feed.
The Graph / Tether USD (GRT) is just as reliable as any other crypto asset — this corner of the world market is highly volatile. Today, for instance, The Graph / Tether USD is estimated as 3.98% volatile. The only thing it means is that you must prepare and examine all available information before making a decision. And if you're not sure about The Graph / Tether USD, you can find more inspiration in our curated watchlists.
You can discuss The Graph / Tether USD (GRT) with other users in our public chats, Minds or in the comments to Ideas.