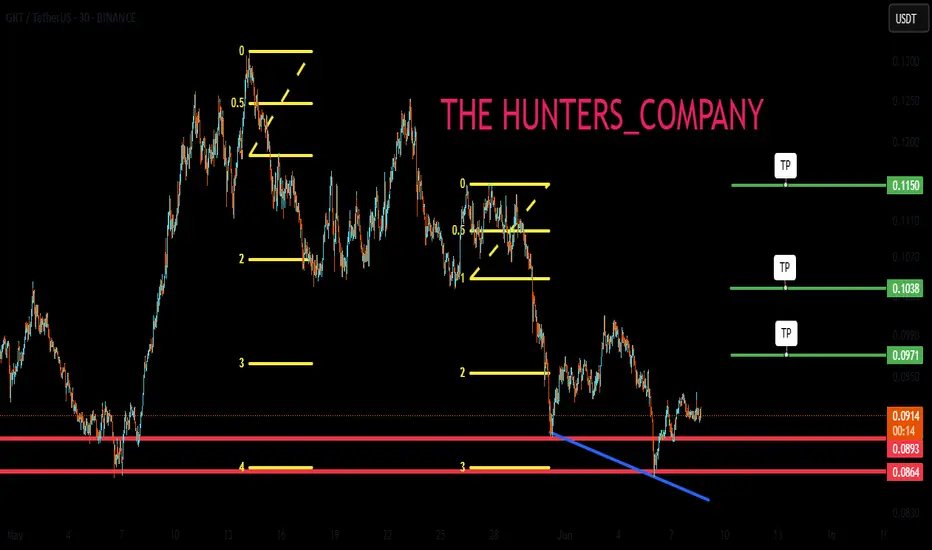
Maintaining support is necessary, not essential, for the climb.Hello friends🙌
🔊Given the price drop, you can see that the support we identified has worked well for you so far and buyers have supported the price.
Now, given the heavy price drop and disappointment in the market, we can expect a rise until the targets are set.
Don't forget capital and risk management, friends.🙏
🔥Join us for more signals🔥
*Trade safely with us*
GRTUSDT trade ideas
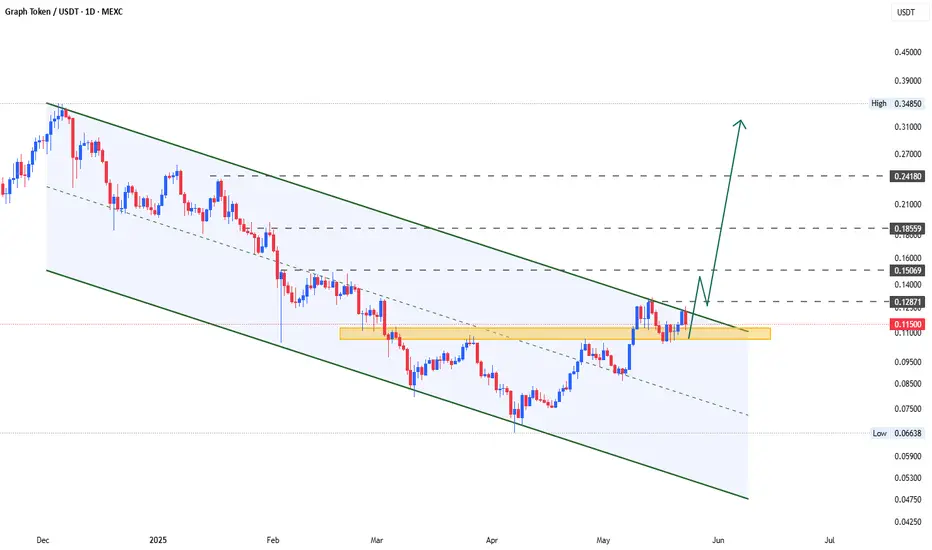
GRT | Altcoins | MASSIVE UPSIDE Potential on The GraphAnother altcoin that has great upside potential is the Graph BINANCE:GRTUSDT
The Graph from a weekly perspective may seem like there's not much action, but if you zoon in to the daily timeframe we see a different picture.
WEEKLY:
VS DAILY:
We can see anything from a +40% increase to a -30% dip in just a few days; a picture that is lost when we look at the weekly. This is IDEAL for swing trading.
Once you've established the general direction from the MACRO, swing trades become very viable (spot). If your patient enough to wait for a few days, a +30% could easily be achieved within a two week timespan.
______________________
BINANCE:GRTUSDT

The altcoin cycle is loading… don’t get caught chasing!Why It Might Be a Good Time to Start Building Your Nest Now 🥚🐣💸
If history’s taught us anything, it’s this: the best opportunities usually show up before everyone’s talking about them. 📈 Every cycle, whether it’s stocks, crypto, or real estate, rewards the people who start stacking early, not the ones waiting for a perfect moment (spoiler: it rarely comes).
A lot of people sit on the sidelines thinking they’ll “jump in later” … but by the time it feels safe, the big moves have usually already happened. 👀💨
Of course, this isn’t financial advice, just something to think about. 🤝 The ones who build their nest patiently, stay consistent, and prepare ahead of time tend to be the ones who win when the cycle really kicks off. 🛠️
Moral of the story: Start now, stay ready. Your future self will thank you. 🚀🫡

GRTUSDT: Trend in daily time frameThe color levels are very accurate levels of support and resistance in different time frames, and we have to wait for their reaction in these areas.
So, Please pay special attention to the very accurate trend, colored levels, and you must know that SETUP is very sensitive.
Be careful
BEST
MT

GRTUSDT 1D#GRT is moving inside a Descending Broadening Wedge on the daily chart and is now on the verge of breaking out above both the EMA100 and the wedge resistance. 📈
In case of a successful breakout, the targets are:
🎯 $0.1330
🎯 $0.1742
🎯 $0.2076
🎯 $0.2409
🎯 $0.2883
⚠️ Don’t forget to use a tight stop-loss to manage risk effectively.

GRTUSDT 1D AnalysisGRT ~ 1D Analysis
#GRT On the 1D time frame the selling pressure has stopped.. Buy on this support block with a short term target of at least 10%+ from here.

GRT Analysis (12H)From the point where we placed the red arrow on the chart, it seems that a large-degree triangle on the GRT chart has completed, and we are now in a new wave sequence.
In these new downward waves, wave A/W has completed, and it now appears we are in the middle of wave B/X.
We are looking for a rebuy opportunity around the green zone.
It is expected that during the middle of wave B/X, there will be a correction down toward the green zone, followed by an upward move to continue wave B/X.
A daily candle closing below the invalidation level will invalidate this analysis.
For risk management, please don't forget stop loss and capital management
Comment if you have any questions
Thank You

GRT channel is forming
Buy gradually from here or wait for breaking through this resistance line with a short-term target of at least 10%+.

GRT Testing Red Resistance – Breakout Potential! 🚀 JSE:GRT Testing Red Resistance – Breakout Potential! 📈
JSE:GRT is currently testing the red resistance zone. If the price breaks through, the first target could be the green line level! 📊
Let’s catch this breakout together! 💼💸

$GRT Head & Shoulders breakoutJSE:GRT Classic inverse
Head & Shoulders breakout on BINANCE:GRTUSDT
A strong 6h formation just confirmed with price breaking through neckline resistance around 0.111.
Targeting a potential 60% move towards 0.18 based on measured move projection! 🚀
The chart says it all
DYRO, NFA

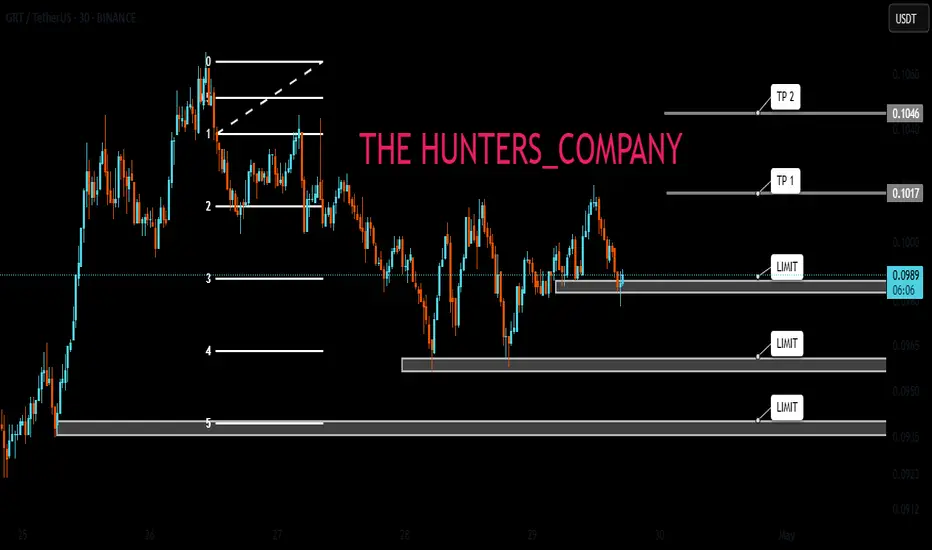
Is it time to buy?Hello friends✌
Given the good price growth and the arrival of buyers, now that the price is correcting, it is the best time to buy.
🙏If you like it, support it with a ✔like✔ and ✔comment✔.
*Trade safely with us*
GRTUSDT 1D AnalysisGRT ~ 1D Analysis
#GRT Buy when re -testing this support block or buy after successfully penetrating this resistant line with a short -term target of at least 10%+.

GRTUSDT Triangle Coil Tension Builds Bullish Breakout in FocusGRTUSDT is forming a clean symmetrical triangle with price rebounding from the lower trendline which brings an encouraging signal for potential continuation to the upside.
As long as the structure holds, we anticipate a breakout above the triangle, which could ignite strong bullish momentum. The external demand zone remains ideal for strategic accumulation, while the internal supply area should be monitored for signs of short-term rejection.
If buyers absorb pressure at that level, GRT could rally toward the crucial upper supply zone, which marks the next major area for distribution. Let’s see how this unfolds, feel free to share your perspective.

#GRT/USDT#GRT
The price is moving within a descending channel on the 1-hour frame, adhering well to it, and is on its way to breaking it strongly upwards and retesting it.
We are seeing a bounce from the lower boundary of the descending channel, which is support at 0.0956.
We have a downtrend on the RSI indicator that is about to break and retest, supporting the upward trend.
We are looking for stability above the 100 moving average.
Entry price: 0.1010
First target: 0.1033
Second target: 0.1065
Third target: 0.1110

The Graph: Your Altcoin ChoiceCan The Graph really grow by 6,000% in 2025?
I don't know, seems like a lot but I also have some more conservative targets.
$2.04 can yield a huge 2,493% from current levels. This is GRTUSDT moving up and not hitting a new All-Time High in 2025. There is a long long-term higher low and higher lows tend to lead to higher highs, which means that an All-Time High is indeed possible.
Another conservative target sits at $1.18 for 1,400% from current levels. There are also several lower, short-term targets mapped on the chart.
The Graph peaked super early in 2021, in February. The rest of the market peaked in April, May and many pairs in November 2021. So this is almost erratic behavior. This is good for the long-term and for the 2025 bull market. When projects move in unique ways, it tends to be a positive.
The project has been solid and strong. The chart is also good with good price action, a nice design and reasonable growth. The action is happening now near the same levels as the September 2023 low support. From here, prices can grow.
It can take a few days, maximum several weeks for the start of the next bullish wave. May for certain but never beyond. In fact, the bottom might be in now and we are gearing up for up for months.
I will not give you more as this is enough... A full bull market can develop within 6 months. Sometimes it can take 12 months or 16 months, but at other times, a pair can produce all the action in less than 6 months. This might be one of those.
Be prepared.
Thank you for reading.
Feel free to leave a comment with your questions.
If you enjoy the content just follow.
Namaste.

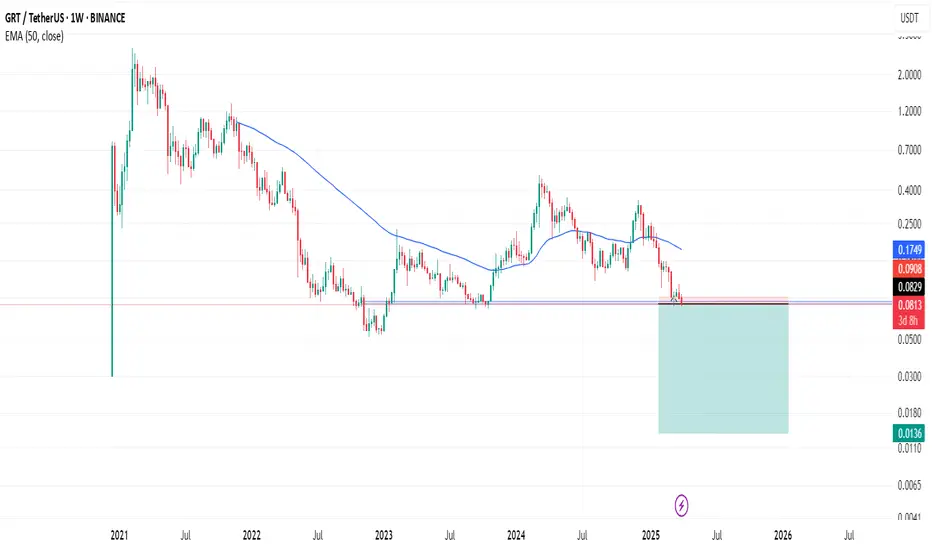
The Graph drop to 0.055C Then Rally to 0.27C?Hello traders as we can see the graph looks like it may be falling and testing the ultimate lows what I have named the last line of defence which is around 0.05C. Great buying opportunity where I will be loading my bags. From here an obvious take profit is that prevailing green trend line suppressing the line around 0.27C
Entry 0.05C
TP1 0.1
TP2 0.2
TP3 0.3
NFA


THE GRAPH LOWER BEFORE HIGHER?Hello traders as we can see the graph is trying to break out but is struggling. I believe a ST of that yearly low 0.0796 is about to take place. Before pushing higher the graph needs liquidity from lower prices If broken cheaper prices are on the horizon such as
0.0765
0.0732
0.6
and even 0.0520 C
If this happens I will be loading my bags! NFA

bearish market GRT is showing readiness to touch lower prices. I suggest standing by for long positions in autumn.
GRAPH MAKE IT OR BREAK ITHello traders as we can see the GRAPH is in a continuous downtrend. I believe it will come and test the yearly low or even put in a new low

Trading Idea for GRT/USDT Based on the ChartChart Analysis:
Head and Shoulders Pattern – A classic reversal pattern is identified, indicating a potential decline after forming the right shoulder.
Descending Channel – The price is moving within a downtrend, marked by two blue lines. A further drop to the lower boundary (~$0.025–$0.030) is expected.
Elliott Wave Analysis – After completing the 5th wave of the downward cycle, a bullish impulse wave is anticipated.
Potential Upside – Following the expected decline, a breakout from the descending channel could lead to a strong rally, potentially reaching $8.00+.
Trading Strategy:
Short-term Strategy (Short Position):
Enter a short trade from the current levels ($0.096) or after a retest of the upper channel boundary ($0.12–$0.14).
Take profit targets: $0.05–$0.03.
Stop-loss: Above $0.15.
Long-term Strategy (Long Position):
Buy near the expected bottom zone at $0.025–$0.035 (potential completion of wave 5).
Main targets: Take partial profit at $0.40–$0.50, with an extended target of $2.50+ and beyond.
Stop-loss: Below $0.020.
Risks:
Possible false breakouts of the channel boundaries.
Prolonged consolidation before an upward breakout.
Market conditions (news, macroeconomic factors) may affect the expected scenario.
Conclusion:
A short-term short position can be considered, but in the long run, GRT has the potential for a strong rally once the downtrend cycle is completed.

GRTUSDT SCALP TRADE SETUP.GRTUSDT forming a clear long trade setup. As previous low liquidity has been swept and did BOS after taking previous low liquidity (MSS done). As MS done so we are expecting a internal liquidity sweep as FVG and then up as move marked,
