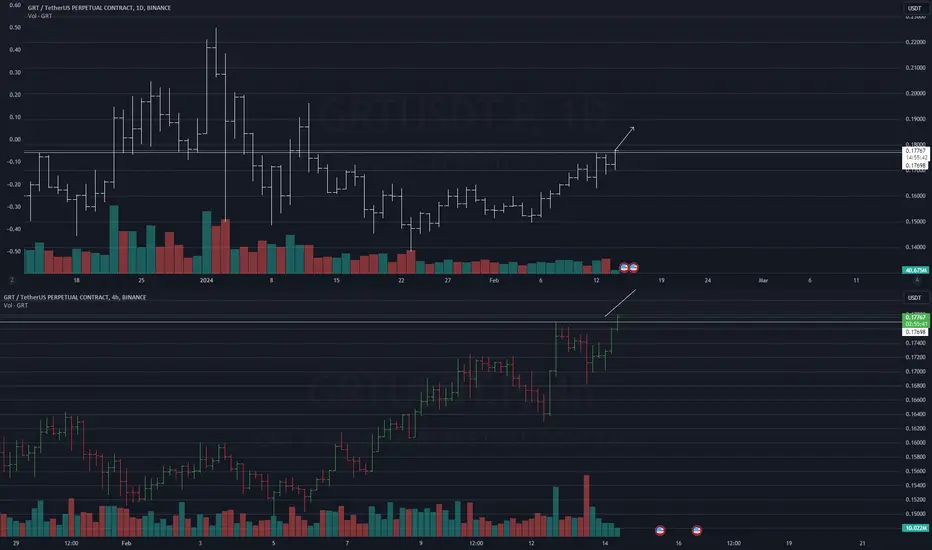
GRTUSDT: Potential 58% Breakout TradeTimeframe: 1 Hour
Analysis:
GRTUSDT is currently facing resistance at the 0.3336 price level. A break above this level could lead to a 58% surge in price, with a target of 0.5274.
Entry:
Enter long if the price closes above 0.3336.
Place a stop-loss order at 0.3094.
Confirmation:
RSI (14) on the 1-hour chart should be above 70 to confirm the breakout.
Risk Management:
This trade is a high-risk, high-reward opportunity.
Only risk what you can afford to lose.
Disclaimer:
This analysis is for educational purposes only and should not be considered financial advice. Please do your own research before making any trading decisions.
Additional Information:
The Graph (GRT) is a decentralized protocol for indexing and querying blockchain data.
GRT is the native token of The Graph and is used to pay for indexing and querying services.
The Graph is a popular project with a large and active community.
GRT has been on a bullish trend since the beginning of the year.
GRTUSDT trade ideas

THE GRAPH 2$we need this to happen!
im investing all i have in The Graph.
2$ next
i marked all the resistance lines, we need to break all of them.
Elliot waves are in our side.
The Grqph is the last coin to do the big movement.
Have you seen DOGE? my Doge idea?
rised up a lot!!!

grt usdt ello everyone..
This is my belief that the currency movement will be in the next two months..
All of them depend on long and short deals.. Thank you

GRT/USDT Need to Break the pattern for continue the upward move!💎 GRT has recently experienced notable shifts in the market. Currently, GRT has bounced from the demand area, with the candle exhibiting a positive response.
💎 If this bounce is validated, the next objective is the resistance trendline of the descending channel pattern. A successful breakout from this pattern probability could initiate a bullish momentum, facilitating an easy movement towards our target strong resistance area.
💎 However, should GRT fail to break out of the pattern, there's a potential retreat to the demand area to create new market momentum. Sustaining the demand zone is crucial, as a breakdown could signal a bearish trend, leading to a downward movement with the next support level situated at the support area, possibly extending further downward.

Where does it go?(GRTUSDT W)BINANCE:GRTUSDT The expected target is visible on the chart. If a second target is provided, it is likely to be achieved.

✴️ The Graph | Already Moving (34%, 154% & 274%)This chart is very similar to Immutable X (IMXUSDT), which has been published recently.
The Graph (GRTUSDT) is trading within a long-term higher low (Oct - Sept '23 vs Dec - Nov '22).
The higher low is confirmed as the pair is already trading above EMA50 and moving ahead.
The rising volume and RSI supports additional growth.
It is already moving, support confirmed, bullish bias confirmed, continuation confirmed so the rest is just to see it grow.
You can find the targets on the chart.
These can all hit within 1-2 months or medium-term.
Back in late 2022, it took 40 days for the bullish wave to peak after the Dec vs Nov. higher low.
It should be similar in duration.
It goes up fast and strong and then the correction is boring and long.
People tend not to sell on the way up, then become bored as prices drop.
Once support is hit, people sell at the bottom and prices start to move up again.
The market always sends the signal in reverse.
➖ When one feels is the wrong time to buy; red, low, near support, it is almost always the best time to buy.
➖ When one is complacent and determined to hold long, that's most likely the time to sell.
Thank you for reading.
Namaste.

GRT/USDT Break this level, It will be confirmed Bullish movement💎 GRT has recently demonstrated noteworthy market dynamics, seemingly breaking out of the major cup and handle pattern, a reversal pattern indicating bullish momentum.
💎 However, for further confirmation, GRT needs to break above the bearish OB + supply area. A successful breakout from this zone could lead to a significant upward movement, probability signaling a bullish trend.
💎 Conversely, if GRT fails to break above and experiences rejection, there is potential for the price to retreat downwards towards the support area, which previously acted as resistance at the neckline of the CNH pattern.
💎 The support area holds significant importance, as a failure to maintain price above this level could invalidate the pattern, potentially leading to a reversal back into a downward trend. This could result in further decline towards the demand area, or possibly even lower levels.

MEGA VOLUME FOR GRT (THE GRAPH) $0,22 TARGETThanks for reading this update, remember that this is not trading advice.
We did follow GRT by the previous update since $0,11
We expect that this coin can become one of the coins with a bullrun effect that can gain to $0,22 in the coming time. we will update this chart soon with more data.

GRTUSDT SHORT POSITIONThe price has successfully completed a three-drive pattern, and concurrently, there is a noticeable formation of a rising wedge pattern and I shouldn't forget to mention that the strength of each new upward wave has weakened compared to its previous wave. Additionally, the confirmation of a bearish movement is evident through the observed RSI divergence.
please follow and support for more

GRT- PLAYING OUT BEAUTIFULLYI have always been bullish..
A must bag to stock up for the uprun-
You just have to be patient..

Triangle Pattern on GRTFriends, in the one-hour and two-hour time frames, I see a symmetrical triangle pattern in the chart. What do you think? In my previous three posts, cup and flag patterns were seen, and the market trend is bullish and promising. Do you think GRT can experience prices above one dollar soon?
I am currently hoping for an intermediate target of 40 cents and a main target of 50 cents, and after a correction, higher prices are likely.

the GRAPH what will you do Nextgood morning to all of you around the "globe"
this analisys of the graph will show you the magical potencial of this coin.
take your time and sit:
from 0.30$ to 0.50$ tp 1.10$
according to Elliot waves indicator

Another Reason for Pump GraphHi friends again.
Dear friends, please see the diagram, everything is self-explanatory.
I will add that the one-hour RSI is right below fifty, but it has started to rise, this, together with the positive RSI with longer time frames, confirms the rise again.
I had 2 other reasons in previous posts too.
I emphasize again that this is my personal opinion based on the little information and what I see in the chart, so don't use it directly for trading and start trading with personal analysis and strategy and the help of more professional friends.

Graph pumping In the previous post , I said that the graph had formed a flag pattern and was likely to rise rapidly to three cents and then to five cents. Now, a cup pattern can be seen in the half-hour and one-hour time frames. Usually this will be a sign of a sharp rise.
This post is just to give an idea and do not use it as a criterion for your purchases and sales and go ahead with your own analysis and strategy.
Target 0.5

*GRTUSDT* BUY : 0.2266 DCA 1 : 0.2193
📈 GRTUSDT
⏳ Wait for retest
💰 BUY : $0.2266
🔄 DCA 1 : $0.2193
💸 Take profits when you are satisfied with profits.
ℹ️ GRT All-time high is $2.87, and it's currently around $0.25. So, it's strong, especially in the Artificial Intelligence Narrative year, and I am expecting a good high.

Graph pump again?Hi friends.
GRT made a flag pattern.
Target 0.3
Then 0.5
Please comment your idea, I want use your advices for my trading


GRT Secure Your Financial Future: Invest in Crypto and Seize## Short Fundamental Analysis of GRT Coin:
**GRT coin (The Graph)** powers a decentralized indexing protocol for Web3 applications. It facilitates efficient searching and querying of data across various blockchain networks without relying on centralized servers.
**Positives:**
* **Growing ecosystem:** The Graph boasts a diverse ecosystem of over 30,000 developers and over 8,000 subgraphs (APIs for blockchain data).
* **Partnerships:** Collaborations with prominent players like CoinGecko, Uniswap, and Decentraland showcase its potential.
* **Utility:** GRT serves a valuable purpose as the core token fueling the network's indexing and querying services.
**Negatives:**
* **Competition:** Facing competition from other blockchain indexing protocols like Covalent and DIA.
* **Tokenomics:** Total supply of 1 billion GRT raises concerns about potential inflation.
* **Price volatility:** Like most cryptocurrencies, GRT experiences significant price fluctuations, posing risks for investors.
## Recent News about GRT Coin:
* **February 13, 2024:** The Graph Foundation announced a partnership with NEAR Protocol, enabling developers to build decentralized applications on NEAR using The Graph's indexing services.
* **February 8, 2024:** GRT coin was listed on Coinbase Custody, a secure custody solution for institutional investors.
* **January 25, 2024:** The Graph deployed its mainnet v0.13.0, introducing scalability improvements and enhanced developer tools.
## Disclaimer:
I am not a financial advisor, and this information should not be considered financial advice. Please do your own research before making any investment decisions. Cryptocurrency investments are inherently risky and volatile, and you could lose all or part of your invested capital.
Remember, this is just a brief overview. For a more comprehensive understanding of GRT coin, you should conduct further research and consult with a qualified financial professional.

Accumulation before the level, free zone after the levelAccumulation before the level, free zone after the level
GRT SHORT SCALP SIGNAL 15 MINHello again dear traders
In GRT currency, we can enter a scalp position or short term for shorts
Profit and loss limits are specified in the chart
Don't forget the free risk or the profit
No one places positions in Trading View, only JAWAD does this for you
I hope it will be useful
Thank you for your support

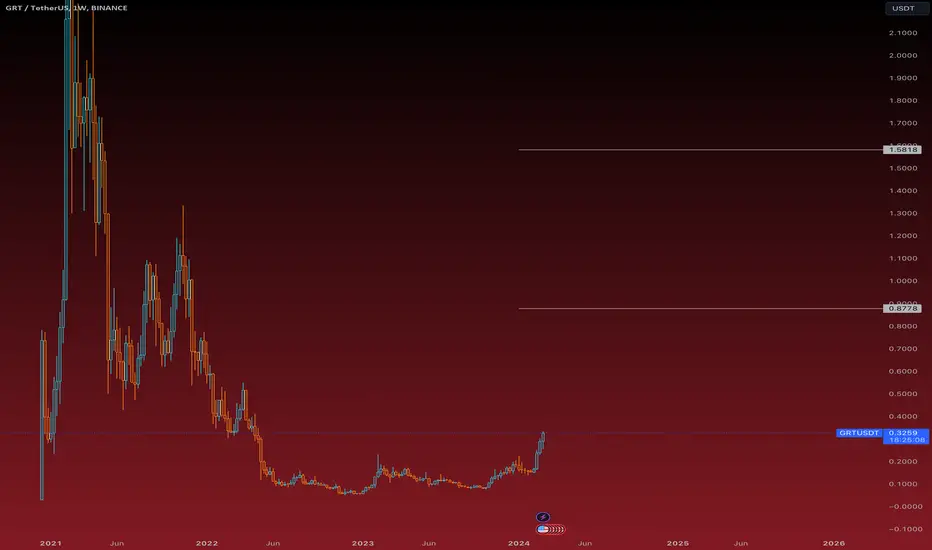
GRT/USDT | 1W 👀1.The number one token in the market.
2. Undoubtedly, it ranks among the finest infrastructure projects today.
3. Backed by a team of experienced and ambitious developers, the project exhibits strength
- Not financial advice, trade with caution.
✅ Stay updated on market news and developments that may influence the price of TheGraph. Positive or negative news can significantly impact the cryptocurrency's value.
✅ Exercise patience and discipline when executing your trading plan. Avoid making impulsive decisions driven by emotions, and adhere to your strategy even during periods of market volatility.
✅ Remember that trading always involves risk, and there are no guarantees of profit. Conduct thorough research, analyze market conditions, and be prepared for various scenarios. Trade only with funds you can afford to lose and avoid excessive risk-taking.
#Crypto #TheGraph #Investment #GRT

GRT/USDTThe project shows excellent dynamics, consolidation is occurring within the structure, I think we should wait for the final wave (E)
