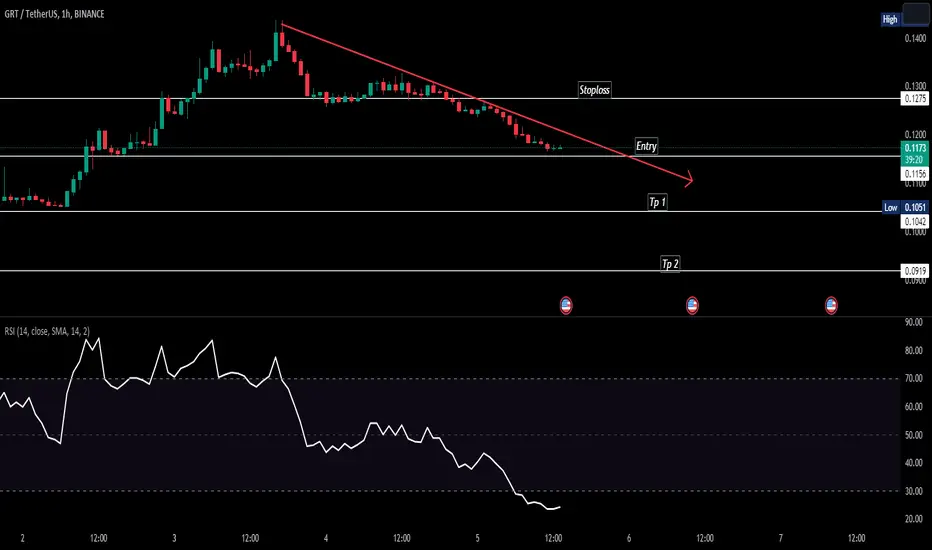
GRTUSDT The Graph Potential Move DownLooking at the chart here we had a month of uptrend here where it forms a lower highs and then market breaks above 0.116 but fails to hold at that level and later breaks 0.113 level which is the weekly support, further breaks the trend line with continous retracement at the 0.113 level a clear indication for me that the price would be looking for another move down at 0.092 level or below.
Take note that this is just my insights in the chart and I do not gurantee a winning setup, please do some research and analyze also on your own.
GRTUSDT trade ideas

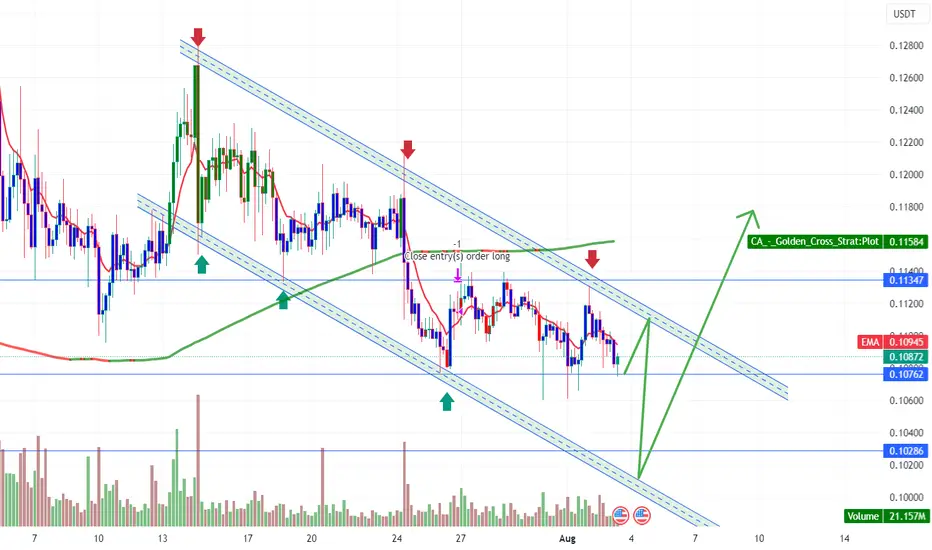
GRTUSDTHello Traders,
As we can see on the chart GRT is moving between the channel we can only open a long position when it will comes to the lower support, follow the chart plan/.
#GRT/USDT 12h (Bybit) Symmetrical triangle breakdown and retestThe Graph got rejected on resistance forming a shooting star with an overbought RSI, retracement down to 50MA support seems in play.
⚡️⚡️ #GRT/USDT ⚡️⚡️
Exchanges: ByBit USDT
Signal Type: Regular (Short)
Leverage: Isolated (3.8X)
Amount: 5.0%
Current Price:
0.12445
Entry Targets:
1) 0.13580
Take-Profit Targets:
1) 0.10715
Stop Targets:
1) 0.15015
Published By: @Zblaba
CRYPTOCAP:GRT #GRTUSDT #TheGraph #AI #Web3
Risk/Reward= 1:2
Expected Profit= +80.2%
Possible Loss= -40.2%
Estimated Gaintime= 3-4 weeks
thegraph.com

Current vibeWe need a motive wave to have something constructive and reliable.
I would think its only 1 of an ending diagonal if its an ending diagonal.
However, it doesnt have to take half of the august for this to find its feet.
Its just a represenation of a supposed further developement that should play out all in 3 waves.

GRTUSDTNot an investment recommendation. This chart was made for personal study and personal use only. If you liked the idea, please like it. If not, write why. In my humble opinion, the price will go up.

GRT SHORT TERM TARGETgreat coins = great pumps
JSE:GRT is one of them and this is my short term target🎯

Massive opportunity if we get an alt coin runI see a pattern.
Strong hold is as follows
-0.61-0.65 fib retracement
-Bottom Diagonal Trendline
-0.786
Stop loss under the (4)
i dont see it holding if it drops there
You have it all for free...
Ultimate target 0.9$
Send it.

ENTER GRTUpcoming entry for GRT, I recommend entering this coin since it has enormous potential and utility, as well as a large community.

GrtIn the area of entering the box, it can be checked. It can be checked. If it is supported, it can be checked up to the red lines, otherwise the support will be lost.

Looks like an easy game playThe move downwards looks definitly corrective.
The motive (expanding diag ) is not as strong as an impulsive wave. but still it is what we need to make things go higher.
stops arent far away. Invalidation of a motive wave is also a a potential stop loss zone .
Send it. If everything goes, this can.

TheGraph - 500%UP? Follow unicorn!A few days back, we observed an attempted breakout that resulted in a decline in prices until now. The downtrend has persisted for over 175 days, but thankfully, we have identified a reassuring trend line with two robust supports.
Currently, there's a shift in character from a downtrend to an uptrend, as evidenced by the formation of higher pivots. Nevertheless, it's important to note that this change doesn't automatically guarantee a price increase.
+1.2 USD soon?
DYOR

1673% gains are expected with GRTGains of 1673% are expected with GRT
Tremendous descending channel pattern and text book bull flag pattern

GRT 170% GAINS TO BE MADE SHORT TERMmy short-term target is $0.29 , but my mid- and long-term goals are far greater. This coin is screaming pump, has a huge user base and community for its technology, and has loads of utility so stakers may profit passively from the protocol.

🔥 GRT Patient For Break Out: Pump Potential!After a huge pump earlier this year, GRT has largely been trading bearish and losing value. However, a break out through the dotted diagonal resistance could be the catalyst to set off another pump for this token.
Target placed at the 2023 highs, stop just below 0.12$. For a less risky trade you could take (partial) profits around 0.17$.

GRT looks bullish. JSE:GRT USDT pair reclaiming a key level here. Looking for continuation in the next few weeks. Great risk/reward play.

GRT LONG. TO THE MOON SOONTO THE MOON SOON. Formed Descending Channel In 3 Days Tf Expecting Massive Breakout Once Channel Got Cleared Midterm Target Will Be 0.50$ 0.80$

GRTUSDT wants the breakout?GRTUSDT is currently exhibiting a specific price pattern, with the price confined within a falling wedge on the daily timeframe. This falling wedge is formed between larger weekly structures, indicating a potential significant price move in the future.
According to Plancton's rules, the price would ideally need to create a breakout from the falling wedge pattern and subsequently retest this breakout level. This retest is crucial as it confirms the validity of the breakout and provides an opportunity for traders to enter new long positions.
Traders following this strategy would look for signs of a breakout above the upper trendline of the falling wedge, followed by a pullback to the breakout level for a retest. Upon successful retest, it could signal a favorable entry point for new long positions, anticipating a potential bullish move in the price of GRTUSDT.
–––––
Follow the Shrimp 🦐
Keep in mind.
🟣 Purple structure -> Monthly structure.
🔴 Red structure -> Weekly structure.
🔵 Blue structure -> Daily structure.
🟡 Yellow structure -> 4h structure.
⚫️ Black structure -> <= 1h structure.
Follow the Shrimp 🦐

GRT target 0.281D time frame
-
GRT retesting the triangle structure.
White zone is good entry around 0.105~0.111
TP: 0.28
SL: 0.088
*Notice risk that range to SL is 20%*

GRT - Correction not done yet
The initial target for wave C, which I posted back in March, has been reached.
But... the lack of RSI divergence (even in the 4H timeframe), and the absence of a higher high, leads me to believe we will still have another leg down.
A possible target would be the green support zone at 88.6% pullback.

GRT - Falling Wedge Pattern
* 1D
GRT is drawing a falling wedge pattern.
It is currently coming down against resistance, so it is expected to come down a little.
But I think this is the chance to buy it.
If a breakthrough in the top of the falling wedge is made, a significant increase is likely.

GRTUSDTThe current situation of BINANCE:GRTUSDT (Graph Token) is as follows:
A few days ago, we witnessed an unsuccessful breakout that led to a price decline up to this point. There has been a downtrend lasting for more than 150 days, but fortunately, we also have a supportive trend line with two strong supports.
we have a change of character from a downtrend to an uptrend, and we can confirm this with higher pivots that have been formed. However, this doesn't necessarily imply a reason for the price to go up.
In my opinion, a price of 0.105 could be a reasonable buying price with the target of retesting the downtrend line.
⚠️"Daily crypto market analyses I provide are personal opinions & not financial advice. Trading carries risks, so do your own research & seek advisor's help."
Don't forget to like and comment

The Price Level That We Desire to Be Long GRTOKX:GRTUSDT.P
We used the manipulated price movement for the completion of the bearish harmonic pattern and we were successful.
Now we are ready to be long by using T618 and moving average support.
We have a little price action but maybe it is not enough for now, however it is all up to you with your risk management skill.
Good Luck Everyone.

GRTUSDTGRTUSDT IS in bearish phase potentially printing LH and LL.
No divergence shown in RSI which indicates trend is going to continue here.
we wait for the breakout of last ll.