The Graph (GRT) - Hidden unicorn of the month JUNE Bounced off strongly from key support level that holds the uptrend within the ranging market. Parabolic may happen. Possible look in next two month! 700%UP?
GRTUSDT trade ideas

THE GRAPH long term more gain and shine 💣🚀💣Hello 🐋
we expect to see more gain for the price in log term targets 🚀💣
Brief explanation 📖👌💡
It is an indexing protocol designed with the specific aim of querying networks like Ethereum and IPFS.
In simple words, projects with complicated contracts (such as Uniswap and even the Bored Ape Yacht Club NFT collection) store information on Ethereum’s network.
The Graph makes it very difficult to read anything other than the basic data directly from the blockchain.
Without getting too far into technicalities, The Graph solves the complexities through a decentralized protocol that’s designed to index and enable the performance of efficient querying of the network data.📖
Please, feel free to share your point of view, write it in the comments below, thanks 🐋

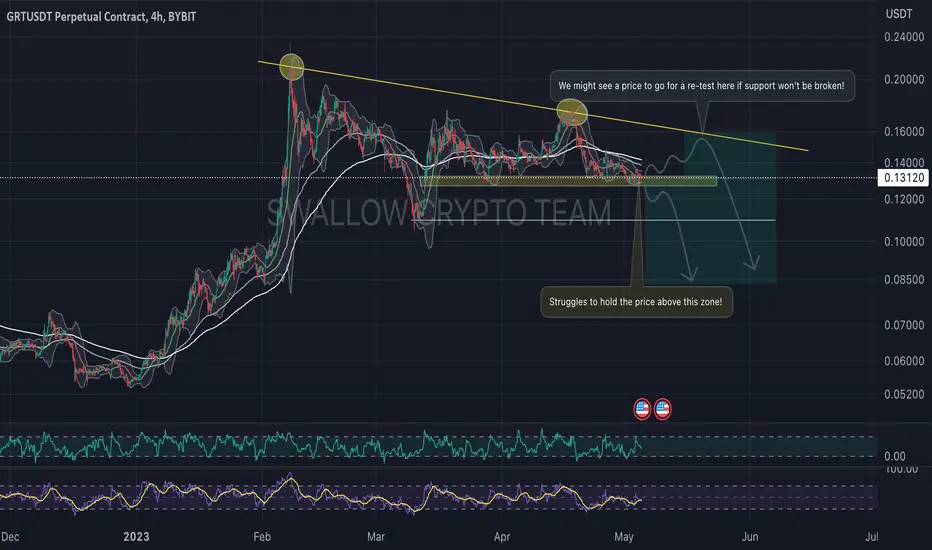
GRT/USDT is it ready?Hey guys 👋
Let's take a peek at GRT coin as well which has formed a nice triangle formation with a weakening spot at lower side of this formation. We see a good chance for a drop but it is a bit early to talk about it as we need to see a CLEAN breakdown before the further movement here! What are your thoughts?
If you like ideas provided by our team you can show us your support by liking and commenting.
Yours Sincerely,
Swallow Team
Disclamer:
We are not financial advisors. The content that we share on this website are for educational purposes and are our own personal opinions.
grt entryThe range that the lower lines indicate can be the golden entry range for the next upward move, the range between 0.88 and 0.8
good luck

#GRTUSDTMy analysis of the #GRTUSDT chart suggests a promising opportunity for significant price growth. However, please note that this is solely my personal prediction and not financial advice. It is crucial to exercise discipline and adhere to risk management and money management principles to survive in the financial market.

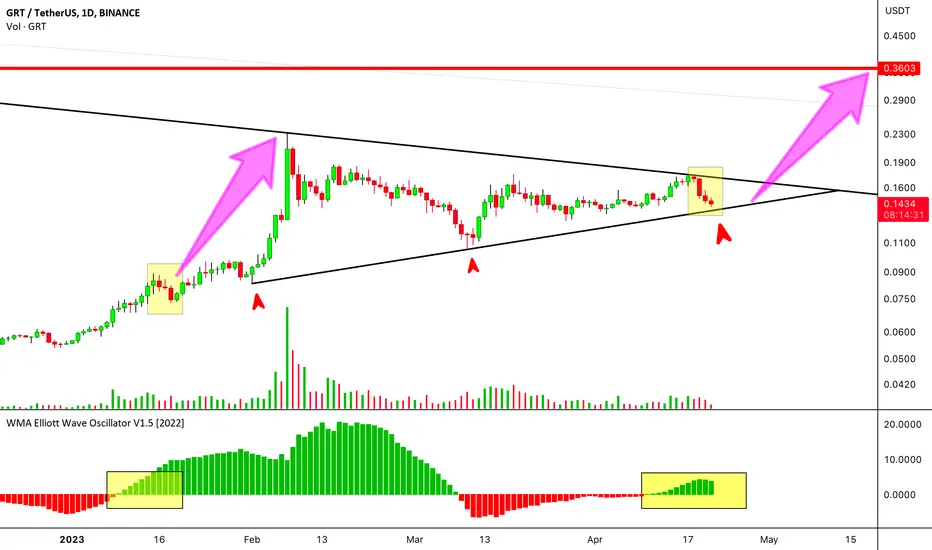
GRT- ELLIOT WAVE THEORY WAVE-2 COMPLETEDhrllo friends
today i share GRT day chart analyisis wave - 2 completed as soon as possible wave - 3 started when the breaks above the resistance level
now grt nearly in support zone it will break go to the next support level in 0.10 $ this month btc breaks 32k grt go to the next level of 0.3 $
guys if anything wrong please comment below it will help full for further process.
thanks

GRTFriends, I saw a harmonic pattern for this currency that I specified the targets.
So far, two targets have been hit and two more targets are left.
Not all targets are necessarily hit.
Good luck
Karim Heydari


destiny 1DIt is quite clear that the supports in the picture have worked well and it is very clear that the target is the $0.35 range.

Destiny 1hPositive divergence, as well as static support and RTM, as well as the narrowing of the Bollinger band: it promises the growth of Sharp.

Potential hidden bull flag on The Graph (GRT) Hello, how are you . O dealer. and speculators. There is a high probability of a bullish on The Graph (GRT)

GRT has cascade support to the shortThe coin has formed a descending structure in the form of a triangle with the highs being squeezed along the inclined line, which indicates the weakness of the buyer to update these values. Also, the level of support is confirmed by several touches, which indicates the accumulation of participants' stops, due to which I consider the continuation of the movement.

W9.1-4 GRT BULLISH IDEA (HARMONICS PATTERN)Potential Bullish Entry
Dow Theory In Place - Higher High and Higher Low Expected in Place
Formation of Harmonic Bullish reversal Pattern coupled with bullish divergence at potential reversal zone (PZR)
Entry at the new HH
SL & TP Levels are defined.

good stophuntit is a good position for buy
the price in this level had a stophunt we can get a buy position

GRTUSD Grt ready for a big fall, first resistance is about 0,10 is good target for buy as hodl. Investors will be patient
Sorry for my poor English 😢

GRTUSDT go down to 0.05now I think there is a chance to go down to 0.05
is a really good timing to short becuase we know where we can put our stop loss at 0.12911

Destiny short term futureEverything is clear and I hope you will not be fooled by the behavior of the market and there is a high possibility that we will move towards a price increase.
Destiny 1DAll things go hand in hand that the price will rise to the range of 0.35, I am very confident and I hope these crypto games will not fool and bore you. I hope!

I am very sureAll things go hand in hand that the price will rise to the range of 0.35, I am very confident and I hope these crypto games will not fool and bore you.

GRT - Bullish case - possible move UPThe The Graph (GRT) chart look very promising, hopefully we will see an upward movement in the coming weeks!

Destiny 1DThis time, let's look at the chart from the indicator view: we can see that it has been under the red line for a long time and recently the bar has changed to size, this is a very important sign that it will experience good growth in the future.

DestinyIt has progressed very well in the past period and according to total3 and usdt.d indicators, it expects 60% growth from GRT.
