Grt/usdt analysis GRT/Usdt
This is my idea. I have tried my best to bring the best possible outcome to this chart, Do not consider it FINANCIAL ADVICE.
This chart is likely to help you in making better trade decisions.
I am not a market maker I could be wrong.
Everything is on the chart.
Everything depends on the BTC movement
Thank you
GRTUSDT trade ideas

GRTUSDT is testing the 4h resistancesthe price is testing the daily support on 0.09$ inside a falling wedge.
On the 4h timeframe the price is testing the dynamic resistance below the static 4h resistance.
How to approach it?
IF the price is going to have a breakout from the resistances and retest as new support, According to Plancton's strategy , we can set a nice order
–––––
Keep in mind.
🟣 Purple structure -> Monthly structure.
🔴 Red structure -> Weekly structure.
🔵 Blue structure -> Daily structure.
🟡 Yellow structure -> 4h structure.
–––––
Follow the Shrimp 🦐


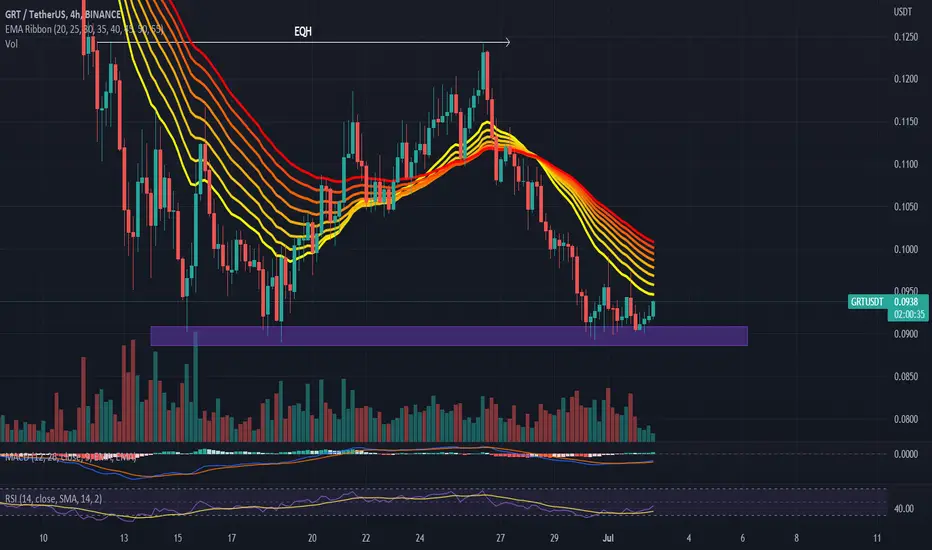
#GRTUSDT 4H Chart
Price is currently bouncing off the support area around $0.9 which has already been tested multiple times. MACD is showing some bullish momentum, RSI is neutral and EMAs are bearish. We might see a sweep of this support area as lots of liquidity is resting below it however overall price should keep moving up in order to take out the equal highs at $0.1245.
Grt analysisGRTUSDT Chart:-
Price is trading in a Downtrend.
Price is taking a correction from 0.125$
Price is also respecting a TL
Price if give a breakout of support then
Sell 0.0918$
TP:- $0.087$ ,0.767$
SL:- $0.105$
#follow it
#keep motivated
#stoploss must

#GRTUSDT THE GRAPHAttempting to plot the expected price movement of THE GRAPH based on waveform analysis and price action.. God knows


GRTUSDT LONG PLANkinda bullish on this coin, waiting for the break of range and then reclaim of the range low, to long into the 0.17

GRT plan of attackWe have touched the overhead resistance 3/4 times now. Looking for some consolidation here, and grinding up against the resistance more and more, before a break out.
Down below on the upsloping support line would be a sensible place to take a long; with an easy invalidation/stop loss just below.
Good luck everyone!

GRT/USDTGRT / USDT
It was located in two descending channels where the floor support was lost.
The possibility of falling to lower levels and even 3 cents is available.
#GRTUSDT #GRT #BTCUSDT #BTC #ETHUSDT #LUNA #LUNC

Trend and neckline break-out patternI set the limit order above the neckline and will set the stop loss at 0.236 Fibonacci level. I will use the Parabolic Sar for trailing stop loss or just put the take profit order on the 0.618 Fibonacci level.


GRT is going to Decrease + Target Provided!GRT is in a Descending Triangle and we can Expect the Price to Fall because Not only The Price is in a Bearish Pattern and That the Price would Decrease as much as the Measured Price movement (AB=CD) ,We also have a Hidden Bearish Divergence (-HD) on MACD as well! This Means that The Bulls are in Real Trouble Right now! The Price should Reach around 0.105$ after Descending!
-GRT is in a Descending Triangle
-Price will Decrease as much as the Measured Price Movement (AB=CD)
-(-HD) On MACD
-0.105$ Is the Right Price!
_ _ _ _ _ _ _ _ _ _ _ _ _ _ _ _ _ _ _ _ _ _ _ _ _ _ _ _ _ _ _ _ _
Thank you for seeing idea .
Have a nice day and Good luck

GRT long 15 minute chartGRT/BTC looking ok also.
Falling wedge / bull flag formation on the 15 minute chart. Buy/long on the bottom line support to max risk reward, stops on a close below this.
Targets.....off the top of my head historical price action of 0.126

GRT - SUPER BULLVolume and buying is strong down at these lows.
for the bulls i'd like to see retest of the Yellow trend line with more volume.

GRT | USDTThis is my opinion about GRT I hope It will be helpful for others ..
pray for me if it was helpful ..
thanks ..
green lines is the targets for long terms
turquoise line is for med scalping
yellow line is for quick scalping
red line is the stop loss
NOT FAINICIAL ADVICE ...!!

GRT LongLooking for this potential Inverse head and shoulders to play out.
Target points even higher from here.
Hard to put a stop loss on this one and there is loads of support levels immediately below.

Allow $GRT to Heal from its WoundsFinding support at extremely oversold level and I feel it is relatively a reasonable entry to take a trade. Altscoins were brutally targeted since early April where $GRT lost 70% of its value in such a short short span of time. I am entering the trade with small downside risk and at the same time would like to hold through the bearish period. If it starts losing more, then it is good to exit at the critical support level.

GRT - Back on EL LevelThere is an interesting view for GRT - that is back on before entry-level.
We will see if this coin will get some increased volumes above as it's an important zone.
As always there is no guarantee in markets, your real guarantee, is your risk management.
This coin's choice as markets Techincal signal shows as interesting.
Coins could have in a small time frame an increase - but in long term, all can change.

#GRT Buy Opp , #thegraph #CryptoThe Graph is an indexing protocol for querying networks like Ethereum and IPFS. Anyone can build and publish open APIs, called subgraphs, making data easily accessible.
When we are in the buy zone.
We will update this analysis in minor tf in order to get the right timing and buy without dd.


GRTUSDT is in Demand ZoneThe price is testing the demand zone on 0.14$ and the market is getting new liquidity from this area.
The price is creating a tringle as well.
How to approach it?
the price needs to create a new Higher high above the 4h resistance. IF the price is going to have a breakout, According to Plancton's strategy , we can set a nice order
–––––
Keep in mind.
🟣 Purple structure -> Monthly structure.
🔴 Red structure -> Weekly structure.
🔵 Blue structure -> Daily structure.
🟡 Yellow structure -> 4h structure.
–––––
Follow the Shrimp 🦐

