GRT falling wedgeGRT has created a nice falling wedge if we see a breakout with volume we can have a nice order which can gives 30%-35% profit
GRTUSDT trade ideas

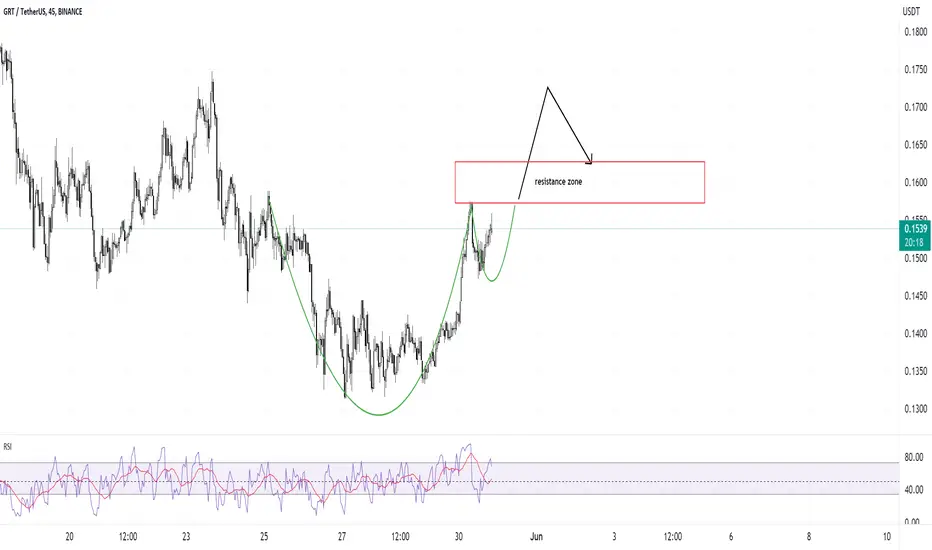
GRT cup and handle possible formationLong position possibly forming on GRT. Looking to complete a cup and handle formation on the 45mins candles. Let's hope it breaks up!

Idea on GRT breaking down-trend. Opinion:
Downtrend could be breached and a TP for risk-reward seems appropriate. TP1 looks attractive.
This is not intended or made to constitute any financial advice.
Notes on how I personally use my charts/NFA:
Each level L1-L3 and TP1-TP3 has a deployment percentage. The idea is to flag these levels so I can buy 11% at L1 , 28% at L2 and if L3 deploy 61% of assigned dry powder. The same in reverse goes for TP. TP1: 61%, TP2:28% and TP3:11%. If chart pivots between TP's, in-between or in Between Sell levels these percentages are still respected. I like to use the trading range to accumulate by using this tactic.
Just my personal way of using this. This is not intended or made to constitute any financial advice.
This is not intended or made to constitute any financial advice.
FED Macro Situation Consideration:
All TP's are drawn within the context of a return to FED neutral policy. I do not expect these levels to be reached before tightening is over.
NOT INVESTMENT ADVICE
I am not a financial advisor.
The Content in this TradingView Idea is for informational purposes only, you should not construe any such information or other material as legal, tax, investment, financial, or other advice. Nothing contained within this idea constitutes a solicitation, recommendation, endorsement, or offer to buy or sell any securities or other financial instruments in this or in in any other jurisdiction in which such solicitation or offer would be unlawful under the securities laws of such jurisdiction.
All Content on this idea post is information of a general nature and does not address the circumstances of any particular individual or entity. Nothing in the idea/post constitutes professional and/or financial advice, nor does any information on the idea/post constitute a comprehensive or complete statement of the matters discussed or the law relating thereto. You alone assume the sole responsibility of evaluating the merits and risks associated with the use of any information or other Content on the idea/post before making any decisions based on such information.

GRTUSDT are you rdy ?👌👌👌UPThe desired currency code for the holders can be the best currency code. With the analysis I did based on my strategy, it can touch the desired 4 orders.
Be prepared for the beautiful benefits of this currency code for its holders.


GRTUSDTThere is demand zone here once it touched you go to long and DYOR and conclusion with use low leverage..

GRT - 1D1D chart for GRT
support zones & resistance zones
Information purposes only
Like if u like chart
@Cringeego

Short grtPositive funding
Higher lows will break market structure down
Btc looks wonbly
USD looks strong

grt usdt perp falling wedgeif you see that there is a falling wedge that can cause the price to increase at this point, if you want to take a long position, you can break the falling wedge area above 0.18846, only set a 3% stop loss from the entry area.

Buy GRT at 1785 Expecting min. 10 X in next bull runBuy GRTUSDT at 1785. At bottom, Web3 based coin, expecting min. 10X in next bull run.

GRTUSDTHello everyone, this analysis has been done using the downtrend line, I have drawn a resistance area above the trend line, which has been broken several times, and again this resistance can be easily broken and the damage limit is lower than the shadow. It has been taken before so that the trade does not close with a loss. Be successful and professional.

GRTUSDT, Sell from levelHello traders, Everything is clear on the chart for you like always.
Good luck.
If you like the idea, do not forget to support with a like and follow me for next analysis :)
Write your comment and opinion below to me


GRT buy signalGRT seems to have completed five correctional waves, and now at the end of wave 2 there is a new uptrend, in addition to breakout and recording a new minor ceiling, it can be considered as wave 3 if it does not record a new Lower Low. , Have a good climb
If a stronger weekly candle closes, the chances of success in this education increase
Stop loss : Fix below 0.297
Profit limit : range 0.775
R/R: 6
WR: 65%

GRTUSDT
Hello Crypto Lovers,
Mars Signals team wishes you high profits.
This is a one-day-time frame analysis for GRTUSDT
The price is approaching the support line and actually it is now supported well. We predict that if it moves below this line, it will face more decline. Also it is possible for it to move gradually upward to the resistance line and face more increase.
Warning: This is just a suggestion and we do not guarantee profits. We advise you analyze the chart before opening any position.
Wish you luck

GRTUSDT Ready for the breakout?The price is testing the demand zone on 0.26$ below the monthly support on 0.29$.
On the daily timeframe the price is creating a descending channel, and now the price is creating a falling wedge inside it.
How to approach it?
We need to wait the clear breakout from the supply zone at 0.35, where the market has the dynamic and static resistance.
IF the price is going to have a breakout According to Plancton's strategy , we can set a nice order
–––––
Keep in mind.
🟣 Purple structure -> Monthly structure.
🔴 Red structure -> Weekly structure.
🔵 Blue structure -> Daily structure.
🟡 Yellow structure -> 4h structure.
–––––
Follow the Shrimp 🦐

GRTUSDT - Short by Supertrend 5/9/2022- 4h timeframe: Supertrend indicator > Short.
- 1h timeframe: Wait a correction (Long) and breakout long for short to open a Sell follow 4h timeframe.
... Long correction (Supertrend 1h)
...Long correction be broken:
* Author trades real at Binance Future.

GRTUSDT SHARK PATTERNShark
The Shark pattern is a distinct 5-point reversal structure that was discovered by Scott Carney in 2011. It is similar to the Bat Pattern, except for the C point exceeding the BC leg. It can point to a strong counter-trend move. The potential Reversal Zone (PRZ) is defined by the following harmonic levels: the 0.886 retracement of initial leg and the 1.13 reciprocal ratio of the initial leg. Targets can be various retracements of the CD leg, all the way up to C itself. There are different methods of determining where the stop would go. Some put it beyond the next structure level after the D point, others choose the 1.41 extension of XA.
Conservative traders look for additional confirmation before entering a trade based on an indicator value, a specific candlestick pointing at a reversal or confluence with other methods. The Shark pattern can be either bullish or bearish. It is as effective as other harmonic patterns and a common variation on trading this pattern is to trade the last leg to completion.

GRT / USDTGRT is currently trading on the bottom, I personally think this is really good position to buy with very likely to have return at least about 40% with a massive upwards potentional.


GRTUSDT is ready for the reversal?The price got rejections from the dynamic daily resistance and now the price is testing the 4h resistance above the weekly support.
How to approach?
IF the price is going to have a breakout from the resistance and retest the resistance as new support, According to Plancton's strategy , we can set a nice order
–––––
Keep in mind.
🟣 Purple structure -> Monthly structure.
🔴 Red structure -> Weekly structure.
🔵 Blue structure -> Daily structure.
🟡 Yellow structure -> 4h structure.
–––––
Follow the Shrimp 🦐

MAKE 7X JUST LIIKE THATYEAH I AM THE ONE AND ONLY
I AM THE BEST OF THE BEST
THE ONE AND ONLY
THE GUY WHO GOT 0 MONEY
based on my high level TA I can say
GRT is about to bounce here or there
the bottom is in!!
confirmed by the king of all charts the one and only MR. WEOOOOO
remember as always I dont have money to buy you guys enjoy the gains!!!!
