GRTUSDT Entry PointResistance: 0.5517
Support: 0.3076
Fib retracement shows a target point of 0.5486 USD, If it breaks the fib level of 0.236 then the next target will be 0.63 to 0.70 USDT
Entry Point: 0.40
Stop Loss: 0.3650
TP1: 0.5350
TP2: 0.63
TP3: 0.70
GRTUSDT trade ideas

GRTUSDTGRT Buy and Hold in Spot part buying 2 area buying area in chart #GRT #grtusdt #Web3 #web3community #cryptocurrecy #Bitcoin


GRTUSDT LONG Grt web3.0 project which is very undervalue currently buy and in 2 parts 0.4300-0.3500 and hold for target mention on chart best investment dont miss

GRTUSDTI expected this motive
But we need the confirmation that 3D candle close above 0.5537 to reach targets
Anti-Gartly Patteren
Thank you


GRT is ready to pop off Created an inverse head and shoulder. Massive buying pressure. Won’t be surprised if this hits .6 tomorrow

GRTUSDT Bids set at 0.43, 0.38 area. Let's hope to be filled due rising wedge pattern.
And if once flip the 0.52 area then long, and the expected targets would be 0.59, 0.65, ++.
Manage your own risk

GRT/USD - Uptrend lost. Price will seek support. 😱See chart. The resistance at the key fib level was too much for GRT.
So long it does not break above it price will seek support.
Bias - BEARISH short term. A higher low would be nice.
Like and follow if you liked my idea!

THE GRAPH 1-2 TARGETGRT: everything you need to know
GRT is a token that powers The Graph, a decentralised indexing protocol used by blockchains such as Ethereum.
In a similar way to how search engines such as Google index the Internet, Graph protocol indexes blockchain data, grouping it into subgraphs on open application programming interfaces (API) that anyone can query via GraphQL, Graph’s programming language.
Subgraphs can be then composed into a global graph of all the public information. This data can be transformed, organised and shared across applications, enabling users to make a search using GRT tokens.
The Graph platform makes it easy to search for blockchain data through simple queries.
“Before The Graph, teams had to develop and operate proprietary indexing servers,” Graph says on its website. “This required significant engineering and hardware resources and broke the important security properties required for decentralisation.”
Currently, The Graph supports nine networks, including Ethereum, Polygon, CELO and BSC.

GRTUSDT is creating a bullflagThe price is creating a bull flag after a breakout from the daily resistance as I told you on the previous analysis.
On 4h timeframe, the price is testing the 0.618 Fibonacci level on the daily support..
How to approach?
The price needs to have a new breakout from the bullflag with volume. Be careful to the 0.43$ resistance, it's a monthly resistance. According to Plancton's strategy , we can set a nice order
–––––
Keep in mind.
🟣 Purple structure -> Monthly structure.
🔴 Red structure -> Weekly structure.
🔵 Blue structure -> Daily structure.
🟡 Yellow structure -> 4h structure.
–––––
Follow the Shrimp 🦐

GRT/USDT SCALP TRADE SETUP!Hello everyone, if you like the idea, do not forget to support with a like and follow.
Welcome to this GRT/USDT SCALP setup. GRT looks good here. As you see BTC is retesting so it's worth taking some leverage positions with the tight SL.
GRT is breaking out from the falling wedge-like structure in 2hr time frame. Also, trade above 21 ma. So buy some here and add more in dips.
Entry range:- $0.40-$0.41
Target:- 10-12%
Lev:- 10x
SL:- $0.39
If you like this idea then do support it with like and follow.
Also, share your views in the comment section.

GRT HITS ALL TARGET!!According to my last prediction GRT gave us 27% profit just in 3 days
Now again we can entry now and target for 0.52USD zone
If you are ready to hold for 1/2 month, the target will be 0.7USD ( according to current market position)
Please FOLLOW AND SUPPORT ME for more hitting predictions like this
grt looking good grt looking good since called the bottom on my last chart
hopefully you got in on my last chart and can enjoy the ride

#GRTUSDT looks prime for 60% Rally!Welcome to this quick GRT/USDT analysis.
I have tried my best to bring the best possible outcome in this chart.
Hello members welcome to GRT/USDT 12hr chart update by CRYPTOSANDERS
As we can see from the above-mentioned chart that GRT/USDT created the head and shoulder pattern and broke the neckline and retested so in the current scenario we are expecting that get will go up all the way to $0.69000 means almost 60%.
So if it moves to the green zone again then it will be the zone to go long on GRT/USDT
entry:-$0.46330,$0.49780
target:-50% to 60%
stop-loss:-$0.42240
with leverage 5x to 10x
Sorry for my English it is not my native language.
Remember:-This is not a piece of financial advice. All investment made by me is under my own risk and I am held responsible for my own profit and losses. So, do your own research before investing in this trade.
Do hit the like button if you like it and share your charts in the comments section.
Thank you.

GRT The Graph price movement predictionPrice Prediction
not financial advice
this is for entertainment purposes only
always DYOR
smash the like button

GRT LONGGGGGGGIn my last prediction I said it will come down to 0.30 and then hit 0.45
Or it will come to 0.38 and then go for 0.52
So now 0.38 to 0.52 is going to be true
tp1 0.455
tp2 0.52
HAPPY TRADING

#GRT market insight GRT gave us a descending triangle of daily time frame as the bigger structure and gave us a break of the recent high on the smaller structure. If the price closes above the recent high we will be buying to the trendline and if it closes below we will wait for a retest and sell


GRT important levelsthis chart was created by senoglus
ı mean mentıon a few levels
this s/r price zones very important.

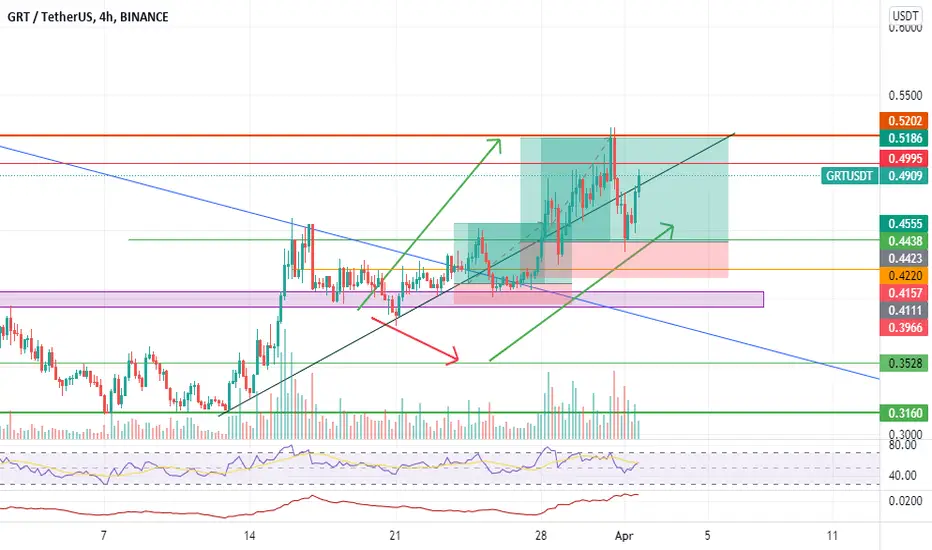
GRTUSDT 4HGRTUSDT is broke the dynamic trend line also Broke the rising wedge that one of the great pa
👤SecondChanceCrypto
📅29.March.22
⚠️(DYOR)ttern for traders.

$GRT- Looking Ready!It seems that defi, Layer 1,Layer 2 and web 3 projects are knocking it off while nfts,P2E and Metaverse has been a bit laid back except few tokens.
Memes on the other hand are grappling to hold their place prolly because a lot of money is flowing into the utility...
GRT is currently looking ready to set it off
Interesting to watch...

