#GRT/USDTT is testing a crucial multiple resistance area🧐 A su#GRT/USDTT is testing a crucial multiple resistance area🧐
A successful breakout from this resistance zone is anticipated📈
The target for this potential bullish move is around the $0.50 level🎯
GRTUSDT trade ideas

GRT ANALYSIS ON DAILY TIME FRAME GRT/USDT Break Falling Wedge On Daily Time Frame Local Support @ Price Level 0.2800 Order Block Support @ Price Level 0.2300.
Local Volume & Supply Zone Resistance @ Price Level 0.300 & 0.3300.

GRTUSDT BULLISH MOVE EXPECTED It's look like a head & shoulder pattern,once the breakout comes we can see the level of 0.3500


GRT Bullish Long IdeaBroke out from trend recently and is currently retesting
Double bottom formed on the daily
Key levels marked on chart
Position carefully when trading choppy markets (BTC major resistance at 65.5k) watch out for these levels and take profits/move stop losses up accordingly

GRTUSDT.PThe price needs to sweep the liquidity at this level, either by pushing directly up to this level or after fluctuating and then reaching this level.

📉🔄 GRT Trading Strategy 📈💡Current Situation:
GRT faced rejection yesterday and is now testing the next support area, presenting a potential buy opportunity.
Trade Setup:
Entry: Long spot trade at $0.2825.
Take Profit: Target $0.3050 - $0.3200 and next resistance area at $0.35 - $0.3625.
Stop Loss: Just below $0.2750 to manage risk.
📊🚀 Stay attentive to GRT's price action for trade execution! #GRTTrading #CryptoAnalysis 🌐💰

GRT usdtGRT Setup. After a confirmed breakout from the marked zone in green, we could take an entry at 0.3248. Remember stop loss is your friend. Everything is on the chart.
Entry 0.3248
S.L 0.2845
T.P 1 0.3544
T.P 2 0.4025
T.P 3 0.4486
T.P 4 0.4932

GRT running away from a Bull Flag!Look what a beautiful break! After the dragged out downwarding channel, the price runs away! Targets on pink arrows


GRTUSDTI think we are completing a contraction triangle of the running type, it could be interesting

GRTUSDT 3DIt would be nice if you grab some #GRT on the support zone. That support is strong. Targets are:
$0.3228
$0.3632
$0.4123
$0.4559

🔥 GRT Double Bounce: Back To All Time Highs?In this signal I'm going to combine two important reversals:
- The daily RSI on GRT has hit oversold for the first time since September 2023. Daily oversold RSI's are amazing buying opportunities during bull-markets.
- The price retested the bear-market highs of ~0.23 from back in January 2023 as support.
This might be the final bearish move in the next few months, hence the target at the current ATH. Be aware this is a long-term trade and might take months to play out.

GRT/USDT is need breakout the resistance to continue upward!💎 Paradisers, the recent market dynamics surrounding #GRT have been noteworthy.
💎 GRT is demonstrating significant bouncing from the support area around $0.22, coinciding with a golden cross on the MACD indicator, signaling bullish momentum for the price.
💎 Currently, the price is facing resistance at the $0.33 area, which aligns with both a horizontal resistance level and the resistance trendline of a descending channel.
💎 For GRT to continue its upward movement, it needs to successfully break out above the resistance level and the pattern. A breakout above $0.33 would not only indicate a bullish reversal but also pave the way for further upward movement, potentially backtesting the supply zone area.
💎 However, if GRT fails to break out above the resistance area and experiences a bearish rejection, it may retreat to the support area to gather new momentum for another attempt at breaking out.
💎 Upon revisiting the support area, there's potential for a bounce, but if GRT fails to bounce and breaks down below the support zone, the next likely destination is the demand area around $0.185. Here, a successful reclaiming of price above the support could lead to a significant upward movement.
💎 Conversely, if GRT fails to find support at the demand zone and breaks down below it, it would invalidate the bullish scenario, signaling further downward movement.
MyCryptoParadise
iFeel the success🌴

$GRT Best Project Of 2024-2025 CryptoPositioned at a critic resistance at level 0.3250 we are faced with 2 scenarios. With a great project GRT cached my eye 1 year ago. My opinion is this coin will be one of the best in the next bull market.
-One where we see a breakout of this level and direct upward moves from GRT.
-One where we see a downwards move to the support level between 0.2330 and 0.2000 followed with the upward move where if a bull market happens we see GRT passing its ATH level of 2.9 dollars.
Both of this positions is LONG and needs patience to profit.
Stay spot, stay safe.

GRT/USDT Market predictionJSE:GRT lookiing bullish, now at resistance area
wait for correction to discount price and we'll looking price action on lower timeframe for confirmation to enter buy
Happy trading guys!

The Graph - GRT a simple fact - Bull Flag Forming! Based on this chart, it appears that GRT has developed a bullish flag pattern after breaking out of these bands. The price is currently retesting the upper band while forming a bullish flag and maintaining its overall bullish structure. This setup suggests that it is poised to continue upward and potentially reach its all-time high (ATH)

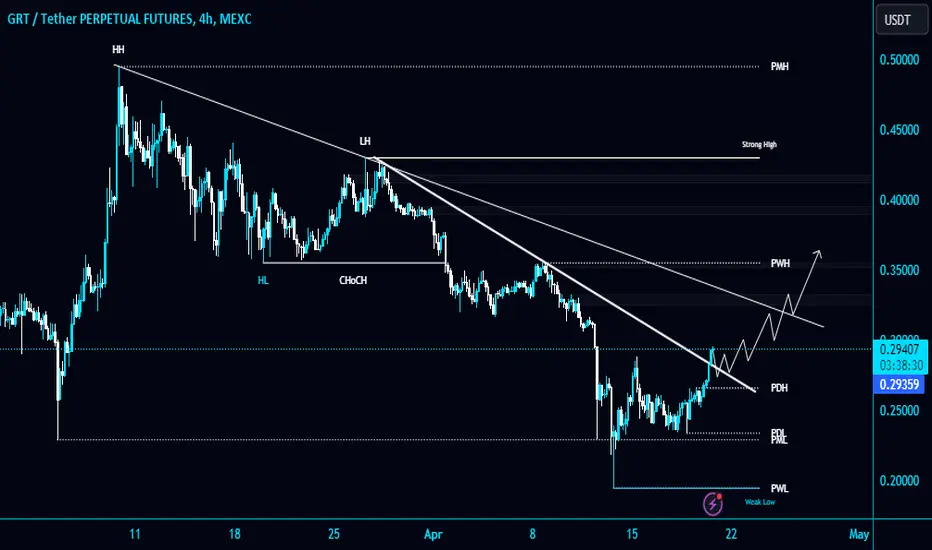
#GRT/USDT breaks the first Diagonal Trendline in 4-Hour TF!#GRT/USDT breaks the first Diagonal Trendline in 4-Hour TF!
JSE:GRT is looking good for Long position. Wait for a retest to long. #GRTUSDT is holding PML $0.2291 support level, the resistance level is $0.35425.
Market review 15/04/2024Review of BINANCE:BTCUSDT.P BINANCE:SOLUSDT.P BINANCE:CHRUSDT.P BINANCE:BNBUSDT.P BINANCE:DOTUSDT.P BINANCE:GRTUSDT.P and vision for the future bull cycle

GRT/USDT bullish turnaround from demand? 👀 🚀GRT analysis💎 Paradisers, direct your attention to #GRTUSDT for an intriguing trading opportunity that hints at a potential bullish surge emerging from a key demand level.
💎 Over recent times, #GRT has consistently adhered to a descending channel pattern. As the price approaches the demand level, maintaining momentum here could significantly enhance the chances of a bullish ascent, aiming to overcome the formidable overhead supply zone.
💎 Should the momentum for JSE:GRT begin to waver, we stand ready to seek a vigorous rebound from the crucial support level just before the demand zone, currently situated at $0.2110.
💎 However, a breach below the critical demand level of $0.2110 would necessitate an in-depth reassessment of our trading approach. Such a development would signal challenges in sustaining bullish momentum, prompting strategic adjustments to align with the evolving market landscape.
MyCryptoParadise
iFeel the success🌴

RED! Long RED!Evening fellas,
This chart to me looks like one of the best.
I think its a cup and handle formation building-up.
Keep an eye on it.
Trade thirsty.
