GTCUSDT trade ideas

#GTC/USDT#GTC
The price is moving in a bearish channel on a 4-hour frame and is adhering to it well. The price has rebounded from the green zone and is expected to retest it at $0.900.
We have a tendency to stabilize above the Moving Average 100
We have an uptrend on the RSI indicator to support the rise
Entry price is 0.900
The first goal is 1.32
The second goal is 1.50
The third goal is 1.75

GTCUSDT.PHello Trader BINANCE:GTCUSDT.P
wait for the valid support area breakdown first if you want to short, because if you short now the risk of a noise area stop loss is hit.
take profit 18%
stop loss 3%
Please add a comment and Positive feedback and constructive criticism are important to authors and the community.
Disclamer: Not Financial Advice

GTC/USDT Get ready for continue the upward movement!💎 GTC has recently experienced significant market dynamics, particularly with a successful reclaiming of price above the support level after a bearish trap. This led to a bounce in price, suggesting potential for continued upward movement towards our target strong resistance area.
💎 However, if GTC struggles to maintain its upward momentum, there's a likelihood of price retracing back to the support area to gather new bullish momentum.
💎 It's crucial for GTC to bounce from this support area, as failure to do so could result in a breakdown, with the next potential stop being the demand zone around 1.42. Such a scenario would confirm a return to a downward trend.
💎 Nevertheless, there remains a chance for GTC to resume its upward movement if it manages to reclaim the price above the support level. However, if this scenario fails to materialize, the price may continue its descent further downwards.

GTC Buying Frenzy: Seize the Opportunity Now!Gitcoin (GTC) Fundamentals:
Function: Gitcoin is a platform that connects developers with open-source projects needing funding and support. It uses a unique quadratic funding model to distribute grants.
Token: GTC is the platform's governance token, launched in 2021. Holders can participate in voting on grants, protocol changes, and other key decisions.
Market Cap: $133 million (approx.) (as of March 28, 2024)
Current Price: $2.01 (approx.) (as of March 28, 2024)
Recent News:
There isn't readily available news specific to Gitcoin, but the platform facilitates funding for various innovative projects in the open-source realm. You can check their social media or blog for recent updates on specific initiatives.
Disclaimer:
I am not a financial advisor and this is not financial advice. Do your own research before making any investment decisions. Cryptocurrency is a volatile market and prices can fluctuate significantly.

GTC LOOKS BULLISHFrom where we wrote "START" on the chart, it looks like we had a diametric that ended.
The green range is the rebuy range.
Image targeting is specified.
Closing a candle below the invalidation level will trigger the role of analysis
For risk management, please don't forget stop loss and capital management
When we reach the first target, save some profit and then change the stop to entry
Comment if you have any questions
Thank You

#GTC/USDT#GTC
The price has been moving in a reversal downward flag since last February, and the downtrend of the flag has been breached for the Tor.
We have oversold on MACD.
And the moving of the 100 thousand was broken up.
Current price 1.10
First Goal 1.44
Second Goal 1.83
Representing 170% of the current price

GTC will give us atleast 5x After breaking out of long term down trend i believe GTC will flip atleast 5x soon!
More updates coming soon !!

SasanSeifi 💁♂ Potential Long-Term Growth $2.70 and $3.50?Hi there! 😊
As you can see in the chart, the price of GTC has faced a range after a long-term downtrend and has experienced a slight growth after breaking the downtrend line. Currently, the price is trading in the range of $1.97.
The scenario that we can consider in the long term is that the price will increase to the liquidity ranges of $2.70 and $3.50. Then, after a minor correction and pullback, the price is expected to rise again to the supply zone in the long term, which is in the range of $4.50 to $5.00.
To better understand the continuation of the price movement, we need to see how the price reacts to the liquidity ranges of $2.70 and $3.50. The important support levels are $1.60 and $1.20. The possible long-term trend of GTC is shown in the above image.
🔵Remember, always conduct your analysis and consider other factors before making any trading decisions. Good luck!"✌️
❎ (DYOR)...⚠️⚜️
Sure, if you have any more questions or need further clarification, feel free to ask. I'm here to help!☺✌
if you found my analysis helpful, I would appreciate it if you could show your support by liking and commenting. Thank you!🙌🙌

Buy signalAccording to the waves analysis we can expect that price rise again to the green zone.
You can follow me for more ideas

Signs of a potential trend reversal
GTC Coin Analysis
Technical Analysis:
Weekly Timeframe:
Downtrend
Signs of a potential trend reversal
Break and hold above $2.36:
Trend reversal confirmed
Entry after $2.36 and buying could be a good opportunity
Support Level: $0.831
Notes:
Always conduct your own research and employ proper risk management strategies before making any investment decisions.
This analysis is for informational purposes only and should not be considered investment advice.
Project Overview: Gitcoin is a platform for funding open-source projects.
Roadmap: Gitcoin is developing new features like token auctions and a prediction system.
Team: The Gitcoin team consists of experienced individuals in the blockchain industry.
Community: Gitcoin has a growing and active community.
Conclusion:
GTC is a project with high potential.
Technical analysis suggests a possible trend reversal.
Conduct your own research before investing.
Disclaimer:
This analysis is for informational purposes only and should not be considered investment advice. I hold no liability for any financial losses you may incur.

GTC/USDT Indicating Continue Bullish Movement after retesting!💎GTC has recently demonstrated noteworthy market dynamics, breaking above the supply area and transitioning into a demand zone.
💎There's potential for the price to undergo a retesting phase at the demand zone before resuming its bullish movement, with the probability of GTC reaching our target area.
💎 However, if during the retesting phase, GTC fails to bounce off the demand area and instead breaks below it, the price may reverse back into a downward movement, potentially revisiting the demand zone.
💎 The price must bounce off the demand area and reclaim its position above it to maintain bullish momentum. Failure to do so could result in a breakdown below the demand zone, leading to further downward movement for GTC.

GTC/USDT Break Alert! If also break the supply. Pump is coming!💎 GTC has recently demonstrated notable market dynamics by breaking out of a descending triangle pattern and undergoing a retesting phase, signaling bullish momentum.
💎 However, a key obstacle lies ahead at the supply area. If GTC manages to successfully break out above this supply zone, we can anticipate significant upward movement, potentially targeting our desired Bearish OB area.
💎 Conversely, if GTC fails to breach the supply area and faces rejection, the price may retreat to the demand area around 1.06 to gather new momentum for another attempt at breaking above the supply zone.
💎 The demand area has historically served as a strong level of support for GTC, with previous bounces reinforcing its significance. Nevertheless, a failure to bounce and subsequent breakdown of the demand zone could signal further downward movement towards the strong support area.
💎 This strong support area presents a lucrative buying opportunity for GTC traders, as a significant bounce or further downward movement may ensue.

ScalpA great scalp position, given that we are in a strong uptrend and corrective wave analysis we can expect to return to the green zone.
Be patient and enjoy your profit
✴️ Gitcoin | The Altcoins Will Grow, Explained (Last Time)Let's have a look at Gitcoin and compare it to some other projects in this market.
First, many Altcoins are in the same situation as Gitcoin, these didn't have a chance to grow in 2023. These are the ones that stayed behind and the ones likely next in line to shine.
Here we can see GTCUSDT trading near the same price level as it was back in June/May 2023. Very low indeed.
If we look at Bitcoin, just to mention one example, we know that it is currently trading at the same price level as back in December 2021.
Solana is trading at the same price level as in April 2022.
All those Altcoins that grew strong in the recovery year moved to the same level as back in March/April 2022 and some did even better and hit the same price value they had back in December and November 2021. Many others stayed behind. This is normal because the market is now so big.
Pairs like the latter group can easily go into correction mode, imagine Injective produced almost 4,000% growth.
The former, such as GTCUSDT and many of the pairs that I am sharing in the last few days, didn't move but the chart patterns are the same as those that moved ahead before they entered their bullish phase. Meaning, they produced a classic bottom pattern and then went to grow strongly.
Going even deeper, pairs like Bitcoin Cash and XRP moved ahead of the entire pack, just to mention two. Notice that these peaked in July 2023 and even though many other pairs moved strong afterward, these continued with their corrective/consolidation phase.
As the market continues to grow and evolve, more and more pairs will detach and move within their own cycles and many pairs move in groups.
Looking again at GTCUSDT, we can see a minor retrace between late December and early February. In this same period Bitcoin grew strong... We can easily assume that if Bitcoin and the bigger Altcoins release some energy, move down/retrace, this energy will flow to those projects that are now sitting at bottom prices and will grow up really fast because the market capitalization is small compared to those.
That's the situation we are in.
➖ In a bear market, everything goes down when Bitcoin goes down.
When Bitcoin goes sideways, everything drops... When Bitcoin goes up, the ALTSBTC drop but the major Altcoins move with Bitcoin.
➖ In a bull market, which is what we are getting into in 2024, when Bitcoin moves down and entire section of the market will go up.
When Bitcoin goes sideways everything grows and when Bitcoin moves up some will stall while others will follow... Just look back to 2019, 2020 and 2021 or the previous cycle or wait and see how things will turn out in the weeks ahead.
Regardless of the relation between the pairs;
Regardless of what Bitcoin does;
We will see the ALTSBTC produce a major bullish phase in 2024.
This will happen sooner rather than later, so be prepared.
Thank you for your continued support.
Namaste.

#GTC/USDT#GTC
The price is moving in a descending channel for 1 day
We have a strong support area at the 0.9200 level in case the lower limit of the channel is dropped, and this is possible in the event of a market decline.
Therefore, there are two possibilities that it will continue to rise directly from the current level
Current price 1.115
First goal 1.148
Second goal 1.22
Third goal 1.32
Fourth goal 1.41
If the pattern breaks down, we will go to the main support area 0.9200 and thus bounce from it

GTC Embrace the Power of Crypto: Invest Smart and Build Wealth ## GTC Coin: Short Fundamentals, Recent News, and Disclaimer
**Disclaimer:** I am not a financial advisor and this is not financial advice. Please do your own research before making any investment decisions.
**Fundamentals:**
* **Purpose:** GTC is the native token of the Gitcoin platform, which facilitates funding for open-source projects and public goods through a mechanism called quadratic funding. This means individual donations are matched proportionally, amplifying the impact of smaller contributions.
* **Supply:** There are 100 million GTC tokens in total, with 66.29 million currently circulating. There is no maximum supply.
* **Market Cap:** As of February 14, 2024, the market cap of GTC is around $87.6 million USD.
* **Token Utility:** GTC can be used for:
* Voting on grants within the Gitcoin ecosystem.
* Participating in quadratic funding rounds.
* Paying fees on the Gitcoin platform.
* Accessing exclusive features and benefits within the Gitcoin community.
**Recent News:**
* Gitcoin and Metalabel collaborated to release a limited edition collection of NFTs commemorating the paper "Liberal Radicalism," which introduced the concept of quadratic funding.
* The Gitcoin Grants Round 14 is currently ongoing, with over $8.8 million USD pledged to various open-source projects.
* Gitcoin partnered with NEAR Protocol to launch a quadratic funding grant program specific to the NEAR ecosystem.
**Disclaimer:**
* The crypto market is highly volatile and speculative. The value of your GTC tokens could fluctuate significantly over time.
* Quadratic funding is a complex mechanism with its own risks and limitations.
* Before investing in GTC, please carefully consider your own financial situation and risk tolerance.
**Additional Resources:**
* Gitcoin Website: (gitcoin.co)
* Gitcoin Blog: (blog.gitcoin.co)
* CoinMarketCap: (coinmarketcap.com)
* CoinGecko: (www.coingecko.com)
I hope this information is helpful. Please let me know if you have any other questions.
GTCUSDT → Resistance Retest. Preparation before the breakthroughBINANCE:GTCUSDT is testing the trend and consolidation resistance and apparently has a chance to break through this boundary.
The coin is forming a bottom at 0.300, after which the consolidation phase continues, but at the same time, relative to the trend resistance the coin is forming a pre-breakout consolidation.
Growing capitalization of altcoins, green cryptocurrency market favorably affect GTC, which can provoke a breakout of the mentioned resistance area.
The break of 1.344 level and price consolidation above this zone will form a bullish potential, which may trigger a bullish distribution after consolidation.
Resistance levels: 1.344, 1.650, 1.915
Support levels: 1.210, 1.060
I expect that the pre-breakout consolidation will favor the breakout of resistance and the price will eventually start to change the bearish trend
BINANCE:BTCUSD CRYPTOCAP:TOTAL CRYPTOCAP:TOTAL2
Regards R. Linda!

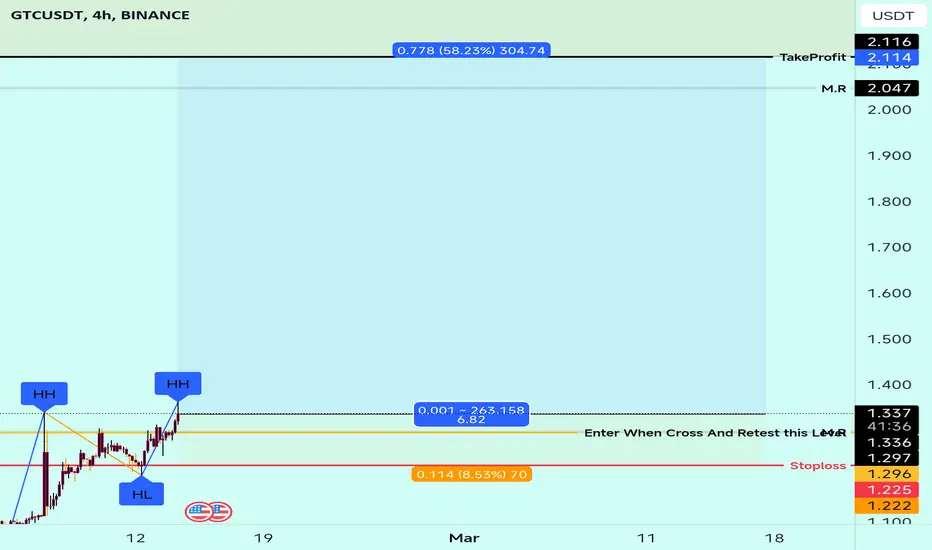
GTCUSDTGTCUSDT was trading in symmetrical triangle pattern. The price was reacting well the support and resistance of triangle.
Currently the price has given the breakout of triangle and now retesting the broken level where it is also forming a local support zone and seems like the price may go for another leg higher.
If the breakout sustain to upside the optimum target could be 1.3400
What you guys think of this idea?

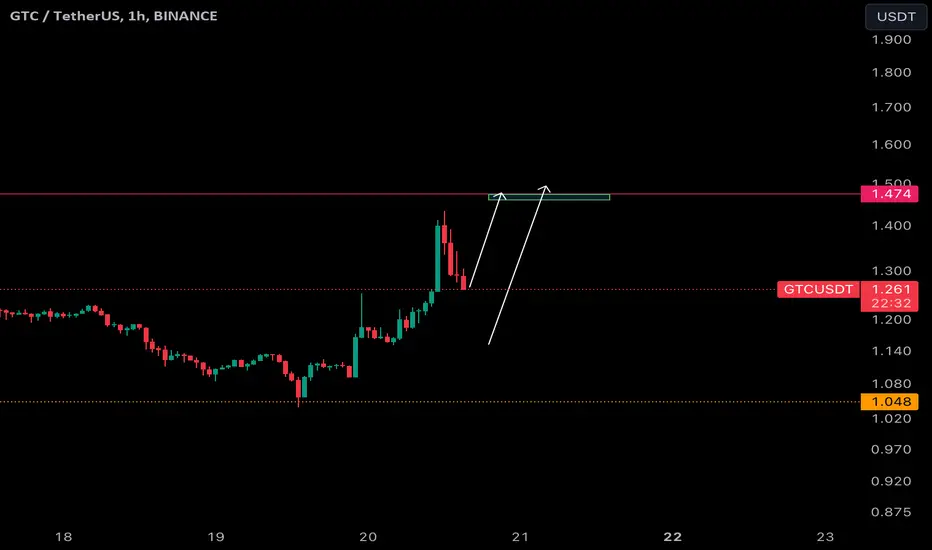
GTC can go massive if holds anywhere Just longed 1.165 with massive leverage and very tight sl possibly if holds here can go big.
Technically if it creates one more HL anywhere it can go very big so taking a chances with high leverage.
Will look again of this doesn't workout but this is currently in a massive Bullish formation.
Note: Not a Financial Advice.

SHORT GTC💲GTC/USDT
🟰SHORT
✖️LEVERAGE:20X
🔜ENTRY:
1.260
1.210
✔️TARGETS:
1.188
1.174
1.161
1.145
1.128
🔚STOP LOSS:1.313
Link to Chart:https://www.tradingview.com/x/pCGItZH9/
©️Signal By :@Cryptoscalper7

GTC above the boxGTC trying to break above the box. Watchout for volume. If it hold above this box for a day, could be sign of better days ahead. Second box is also a resistance box. Above second box, GTC will be a money spinner.

Retest restitanceAfter positive retest we will se 2usd and above.. maxbe in the next 2-3 days
No financial advice
