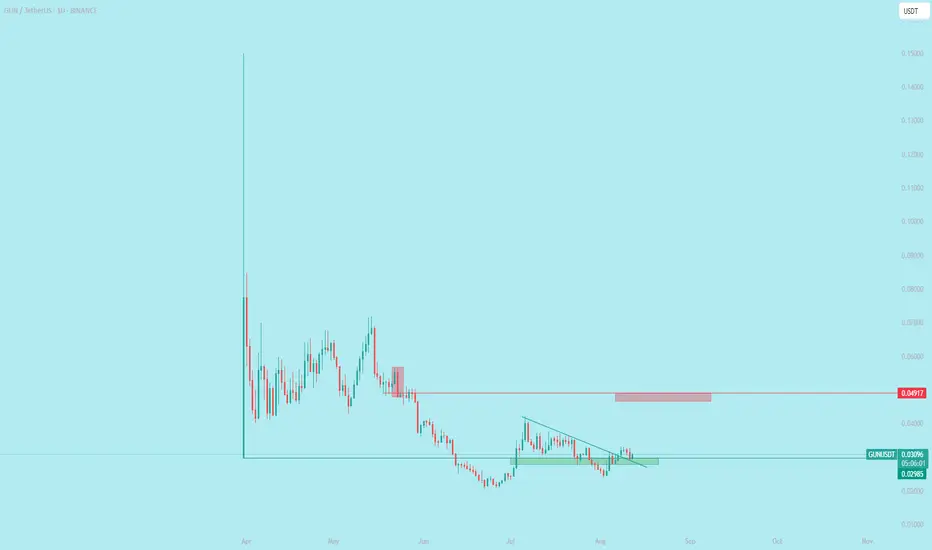
GUNUSDT Forming Descending ChannelGUNUSDT is forming a Descending Wedge Pattern, which is a strong bullish signal often seen before major upward breakouts. This pattern typically signifies decreasing selling pressure and builds up buying momentum. As the price moves closer to the apex of the wedge, a breakout becomes increasingly li
$GUN a huge bag loaded The chart you provided is for GUN/USDT on Binance , showing a significant price drop followed by a period of consolidation. Based on the visible trend, the price has recently approached a support level around 0.024 USD and appears to be testing it. If the support holds, the next move could be an upw
GUNUSDT.P LONGThe setup has been marked.. i will suggest to buy it and hold. It might explode.
The price broke out with strong momentum to upside.
Always book 50% profit at 50% level and bring s.l to the entry.
Keep following and support me please to keep posting like that.
Thanks

GUN/USDTKey Level Zone: 0.02800 - 0.02860
LMT v2.0 detected.
The setup looks promising—price previously trended upward with rising volume and momentum, then retested this zone cleanly. This presents an excellent reward-to-risk opportunity if momentum continues to align.
Introducing LMT (Levels & Momentum


GUN/USDT: FALLING WEDGE BREAKOUT ALERT!!🚀 GUN Falling Wedge Breakout – 35%+ Potential Incoming?! 👀🔥
Hey Traders! If you're all about high-conviction plays and real alpha, smash that 👍 and tap Follow for more setups that actually deliver! 💹💯
GUN has officially broken out of the falling wedge structure on the 2H timeframe — a classic bull

GUN Analysis (4H)By analyzing he GUN chart, a large wave B can be identified, which started from the point marked with a green arrow.
This wave appears to be a diametric, and we are currently at the end of wave F of this diametric. It is expected that wave F will complete at the green zone and wave G of the diametr

GUN/USDT – Breakout Retest in Play!🚀 GUN Breakout Alert – 100% Potential Incoming?! 👀🔥
Hey Traders! If you're all about high-conviction plays and real alpha, smash that 👍 and tap Follow for more setups that actually deliver! 💹💯
GUN just completed a clean breakout from a long-term symmetrical triangle and is now retesting the breako

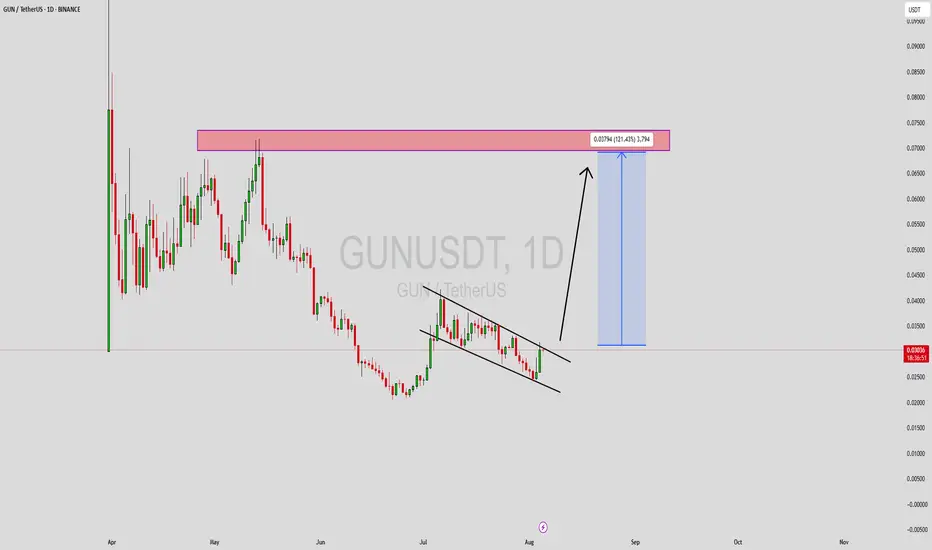
GUNUSDT 12H#GUN is trying to break out above the rectangle pattern on the 12H timeframe. It may retest the support level at $0.05937 before the next leg up. In case of a breakout above the resistance zone, the targets are:
🎯 $0.07584
🎯 $0.09000
🎯 $0.10416
🎯 $0.12432
🎯 $0.15000
⚠️ Use a tight stop-loss.

GUN/USDTKey Level Zone: 0.05620 - 0.05700
HMT v8.1 detected. The setup looks promising, supported by a previous upward/downward trend with increasing volume and momentum, presenting an excellent reward-to-risk opportunity.
HMT (High Momentum Trending):
HMT is based on trend, momentum, volume, and market s

See all ideas
Summarizing what the indicators are suggesting.
Oscillators
Neutral
SellBuy
Strong sellStrong buy
Strong sellSellNeutralBuyStrong buy
Oscillators
Neutral
SellBuy
Strong sellStrong buy
Strong sellSellNeutralBuyStrong buy
Summary
Neutral
SellBuy
Strong sellStrong buy
Strong sellSellNeutralBuyStrong buy
Summary
Neutral
SellBuy
Strong sellStrong buy
Strong sellSellNeutralBuyStrong buy
Summary
Neutral
SellBuy
Strong sellStrong buy
Strong sellSellNeutralBuyStrong buy
Moving Averages
Neutral
SellBuy
Strong sellStrong buy
Strong sellSellNeutralBuyStrong buy
Moving Averages
Neutral
SellBuy
Strong sellStrong buy
Strong sellSellNeutralBuyStrong buy