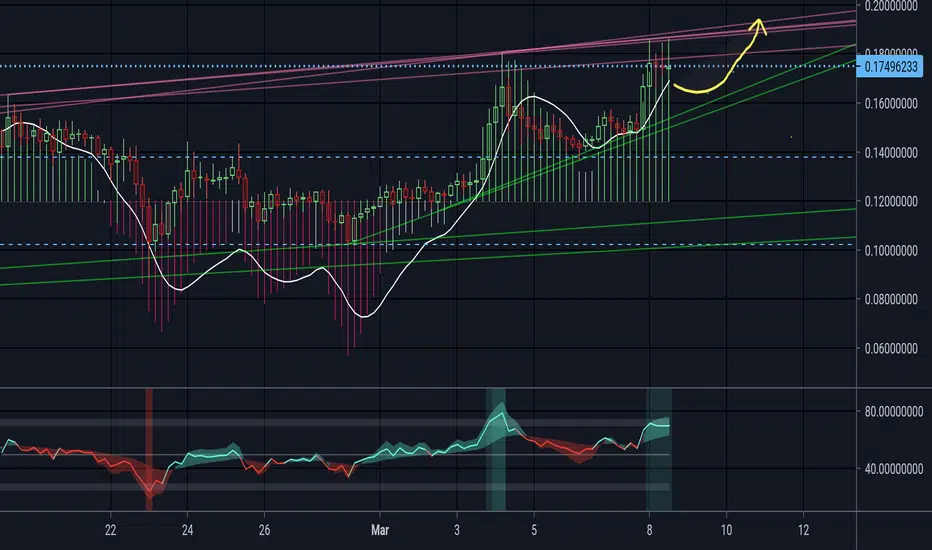
HBAR HEDERAups! as predicted on my previous post, that is on the move,
i love those patterns :-)
take care and good luck
Charlie.
HBARPERP trade ideas


Saw the drop to .30-.33 - HBAR Could Be Going Higher Per Trend
On Monday morning (11:00am) I posted to my Twitter account (OTRWithPeanut) that we could see HBAR retrace back to the .30 to .33 cent level. The price was at .41 cent. What the chart was telling us clearly didn't lie.
I now see that a possible upward breakout may be about to happen by tomorrow morning around 7am. Keep in mind that we may see the price continue to slide to the support line until then.
This is not financial advice, I simply post these charts for my own personal development & documentation. Always do your own research.
Thoughts?

HBAR probably to go down upto 0.10USDDISCLAIMER: I'm not a financial advisor all the analysis were my experience and prediction Buy and Sell at your Own Risk
Get ready to buy HBAR and hold strong to EARN A profit of 30%-50%.
Be ready to earn the profit. Get Ready with your and exchange ready to earn.
Thank You

HBAR Hereda Hashgraphbe prepared for another big move in HBAR (i guess 0.55 as a top & 0.44 as next stable point)
to me Hereda is not a speculative asset. i bet for the future.
this weekend lots of gain on this Crypto and some take profits, the price drop after reaching $0.44 top
this is a 30 minute chart frame.
just my opinion, not an advise, mostly based on the strong fundamentals of this enterprise.
i recommend to get advice from profesional and acquire knowledge about Hereda before investing. Investing is always risky and a bet.
good luck!!!
Charlie


Lets see if CELER and HEDERA can continue the uptrendas usually i like to enter on pullback to the POC on strong uptrending instruments. last tuesday CELER and HEDERA provided entry spots at the POC.
with the stoploss on the swing trade below prior days low these two instruments still continue to go higher
bitcoin and chilliz got stopped out as the traded below prior days low.

HADERA HASHGRAPH to go up by 50% - 200%I think it's the best time to take entry in the market. And you should do your own analysis before you invest since I am not an professional experienced financial advisor, Invest at your own risk.
Thank You

HEDERA HASHGRAPH HBARi already posted the first triangle formation in the 30 minute timeframe chart yesterday, which as give us a 30%, to me, it seems an even more aggressive 2º triangle is on the go right now following the price action of the first compression.
Please refer to Herera.com and learn about this mega project before investing. It ´s important to know what it means.
i feel confortable with the profits but i also know the company and what they are doing,
Anyway good luck to all
as always investing is risky and if you are not sure take professional advice. that ´s just my opinion about HBAR.
Cheers
Charlie

HBAR HederaI like that, looks espectacular, apart of courses this is the biggest worldwide Crypto project to Date, Crypto 3.0, for more info look at Herdera.com, to know more about who are the CEO ´s and Council members and owners, who are far more spectacular than the charts,
BOEING, GOOGLE, TATA, STANDARD BANK, DEUTCH TELECOM, IBM, AVERY DENISSON, DENTONS, DLA PIPER, EDF, EFTPOS, FIS, LG, MAGALU, NOMURA, SWIRLDS, UCL, WIPRO, ZAIN
I agree that will help the world in all sense
take your time to learn about the Technology Hashgraph Invented by DR. Dr. Leemon Baird Hedera ´s CEO (Hasgraph inventor), before investing. As well what is the fundamental role of this enormous DATABASE project.
To me it ´s pretty clear
welcome to the future :-)
the idea is a 30 min time frame looking chart
Charlie


#HBARI think I need to “Get me some of that.”
BUT, Imma wait until the price consolidates (drops) nearer that blue trend line ~


HBAR is it a double Top?Hbar has Formed a Double Top, we will get the Confirmation if we break Below the Red Line, if we break down we might see 22c lvl again, and retest the red line and go back down to the 18-20c lvl.
if we make new ATH and close above the current ATH. this TA will be Invalid.
wish you all good Profits!

A Bold Prediction for Hedera HashgraphThis chart represents a potential possibility, as it gains more recognition for it's breakthrough technology, it may create a massive speculative bubble as many startups are still in early stages building on hedera.

HBAR 150% rally on the verge of wipe off
Hedera Hashgraph engages reverse gears on failing to rise above the all-time high of $0.2821.
HBAR is seeking higher support, but a worsening technical picture hints at a correction to the 50 SMA.
Hede
ra Hashgraph must clear the resistance at $0.2821 to open doors to gains above $0.3.
Hedera Hashgraph has witnessed an incredible rally since the beginning and 2021 and most recently in March. The token shot up more than 150% in the first 11 days of the month, trading a new all-time high of $0.2821. However, selling pressure has started to intensify, resulting in the ongoing correction.
In the meantime, Hedera Hashgraph is exchanging hands at $0.25 following the minor correction. The downward action appears to be gaining traction, accentuated by the Moving Average Convergence Divergence (MACD). This technical indicator follows the trend of an asset and keeps track of its momentum.
The MACD has stalled significantly higher within the positive region. Besides, the indicator is sending out bearish impulses, especially with the MACD line (blue) likelihood of crossing under the signal line.
On the downside, very little support is expected at $0.25 because the price has sliced through the zone several times before. Therefore, the most significant near-term tentative anchor is highlighted at $0.22. Here, bulls can increase their position and confidently defend the support as they push for another assault on the record high.
However, if push comes to shove and the price explores the levels under $0.22, Hedera Hashgraph will risk diving to the 50 Simple Moving Average (SMA) around $0.18 on the 4-hour chart. Other critical support levels to keep in mind include the 200 SMA currently holding the ground at $0.14 and the buyer congestion zone at $0.11.
Hedera Hashgraph intraday levels
Spot rate: $0.25
Relative change: -0.017
Percentage change: -6.35%
Trend: Bearish
Volatility: Growing

Top Inversion i can do from now to the future to meI think it ´s important to the community to inform about this big project
The Chart only saids UP and UP for now
i believe it ´s the future
as always judge by yourself and consider risk before investing and get advice from a profesional.
Charlie,
Hedera, is a Distributed Ledger Technology which use the most advanced to date encrypted transaction network,
Find your self info at Hedera.com
Chart Transaction per seconds, delay and price
TPS Fees Time (delay)
Bitcoin 3+ 0.20$ 10-60 min
Ethereum [ETH 12+ 0.13$ 10-20 seg
Hedera 10000+ 0.0001$ 3-5 seg (this will surpass easily 500.000 transaction per second on the net expand in the future, VISA does 60.000 TPS)
CEO ´s :
Dr. Leemon Baird (hashgraph technology inventor)
Mance Harmon
Hedera is owned and governed by the world's leading organizations
Governing council:
from A-Z
Avery Dennison
Boing
Dentons
DeutscheTelecom
DLA PIPER
EDF
eftpos AUSTRALIA
FIS
GOOGLE
IBM
LG
Magalu
NOMURA
STANDARD BANK
Swirlds
TATA COMUNICATIONS
UCL
WIPRO
ZAIN

HBAR / USD - Showing Good Chance to go ParabolicHBAR / USD has formed a strong parallel uptrend and it keeps making attempts to break up and out of that trend. Recall that, the more knocks at the door, the better chance at breaking through that door. This is usually said about getting past a resistance (or support), but also applies with parallel channels.
That said, its absolutely possible that we can test the bottom of our channel again before seeing a move up and out.
BTC pair looks even stronger after double-bottoming on the all-time chart and moving back up. We're not even halfway to our old highs vs BTC and may have a shot at breaking it. Should either of those two things occur, the USD price of HBAR could easily do 2-5x from here.
On the chance we move back down and revisit bottom again against BTC, that would give us a triple bottom and send us even higher than expected now. In case you haven't noticed, i'm super bullish on HBAR.
Channel drawn based on 30 min line chart, and then viewed above on daily candle:

Just own some HBAR - nuff saidThis tech is very interesting. The speed and low cost of transacting are amazing. DYOR! BITTREX:HBARUSD

are we going higher on HBAR??HBAR has been very bullish in the last couple of days and weeks.
My analysis is not a financial advise.
we might retrace from this point. we have filled all the 5 Eliott waves (if i have counted it Right) i aim for the .38 fib because the market is extremely bullish and mostly won't go lower than the .38 Fib.. it's healthier if we retrace from here and wait for the next bullish Move!
wish you all good Profits!!
PS: i hate to do SHORT "Signals" on HBAR!

