#HBAR/USDT#HBAR
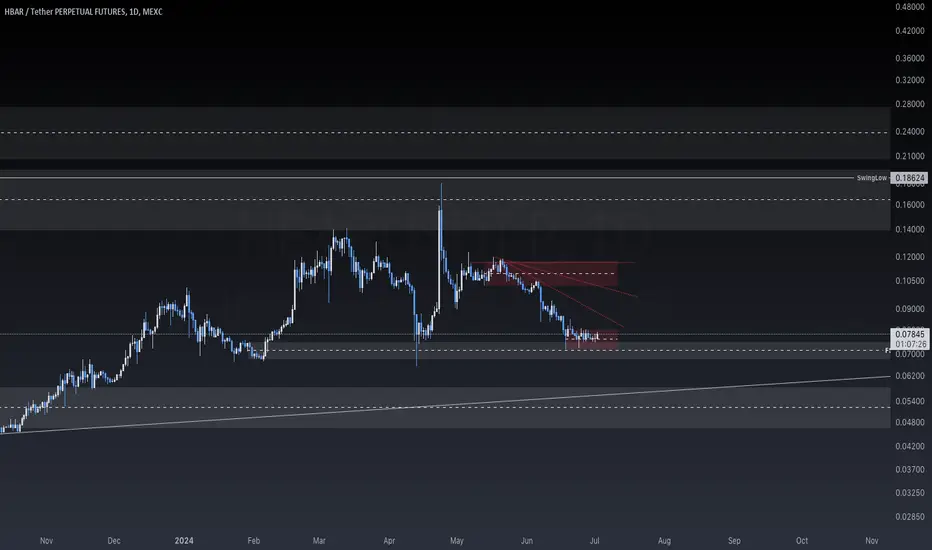
The price is moving in a descending channel on the 1-day frame and is sticking to it very well and is expected to break it upwards
We have a bounce from a major support area at the lower line of the channel at 0.04410
We have a downtrend on the RSI indicator which supports the rise
We have a trend to stabilize above the 100 moving average
Entry price 0.04972
First target 0.06127
Second target 0.07280
Third target 0.08400
HBARUSDT.P trade ideas

HBARUSDTHBAR ~ 1W
#HBAR Price again retested this key support. If you have Conviction on this Token, This is the right time to start accumulation.

HBAR Technical Analysis in a Weekly TimeframeHello everyone, I’m Cryptorphic.
I’ve been sharing insightful charts and analysis for the past seven years.
Follow me for:
~ Unbiased analyses on trending altcoins.
~ Identifying altcoins with 10x-50x potential.
~ Futures trade setups.
~ Daily updates on Bitcoin and Ethereum.
~ High time frame (HTF) market bottom and top calls.
~ Short-term market movements.
~ Charts supported by critical fundamentals.
Now, let’s dive into this chart analysis:
HBAR has been in a bearish trend for quite some time and is currently holding at the support trendline. The support range between $0.0290 and $0.0375 is crucial for a potential rebound.
Failure to hold this support level could have a further negative impact on the price in the long term.
On the other hand, a rebound from the current price or the support range could lead to a test of the resistance trendline near $0.0767. To reach its all-time high, HBAR would need a 14x-15x gain, which would be a significant challenge.
Key Levels:
- Initial Support: $0.0452.
- Crucial Support/Good Entry: $0.0290.
- Primary Resistance: $0.0767.
- RSI: Close to the oversold zone.
DYOR, NFA.
Please hit the like button to support my content and share your thoughts in the comment section. Feel free to request any chart analysis you’d like to see!
Thank you!
#PEACE

Critical Analysis: Is HBAR Set for a Major Breakout or BreakdownHedera Hashgraph (HBAR) has been under heavy selling pressure for some months, as indicated by the continuous drop on the daily chart. Since April 2024, the asset has continually made lower highs and lower lows, which is a classic bearish market pattern. The descending trendline (Red) indicates the current negative trend, which HBAR has struggled to break above. Recent price activity indicates an attempt to challenge this trendline, but the effort was swiftly greeted with resistance, causing the price to drop back to its present level of $0.0494.
In terms of support and resistance, HBAR faces several key levels that traders should keep an eye on. The immediate resistance is found at $0.0519, just above the current price. Should the price manage to overcome this resistance, the next significant hurdle is the resistance zone (Green) at $0.0585 - $0.0604, a level that previously acted as support in early August but now serves as a formidable resistance point. This zone not only aligns with the downward trendline but also represents a point where sellers have repeatedly stepped in to halt upward momentum.
On the downside, HBAR has an immediate support zone (Yellow) at $0.0458 - $0.0443 on the chart. This support is crucial as it represents the last line of defense before the price potentially drops to the $0.0399 area, where historical price action suggests buyers might re-enter the market. However, the overall low trading volume observed recently indicates a lack of strong buying interest, which could mean that sellers remain in control and could push the price lower.
The overall outlook for HBAR remains bearish. The ongoing decline, combined with the failure to break above major resistance levels and a lack of significant buying activity, indicates that more declines are possible. If the price fails to hold the support zone (Yellow), it may fall even further to $0.0399. On the other side, if bulls can push the price above $0.0519, the descending trendline and the resistance zone (Green), it may signify the start of a trend reversal, with the resistance zone (Purple) at $0.0780 -$0.0797 being the next target and if the momentum remains intact then the price could reach to the next levels marked on the chart. Traders should keep an eye on these levels to see what path HBAR may take next.

HBAR with the Adam & Eve patternTextbook Adam & Eve pattern here on HBAR. Looking for $0.076. Close down below the neckline invalidates pattern. Also, looks like we're putting in a C- wave up.

Hbar is ready to return!!HBAR is ready to continue its uptrend, provided it can maintain this uptrend line and not breach its demand area.

HBARUSDT 1WHBAR ~ 1W
#HBAR Price again retested this key support. If you have Conviction on this Token, This is the right time to start accumulation.

HBARUSD BUY (RRR 1:3,85)Hello,
Here's a concise update based on our latest technical analysis chart:
Liquidity Sweep
We've seen a liquidity sweep, where the price dipped to clear out stop-loss orders, gathering liquidity for a potential upward move.
Broken Downtrend
The downtrend has been broken, suggesting a possible shift in market sentiment from bearish to bullish.
Volume Increase
There's an increase in volume, indicating heightened trading activity and interest at these levels.
Identified Buy Zones
We've identified three key buy zones:
Buy Zone 0: New entry point based on current analysis.
Buy Zone 1: Above the downtrend break, signaling a potential entry for reversal trades.
Buy Zone 2: Above the weekly Fair Value Gap (FVG), providing another strategic entry point.
Fibonacci Retracement
The Fibonacci retracement levels (61.8% - 78.6%) are marked, often used to identify potential reversal points.
Rejection Point
A rejection at a specific level indicates strong resistance, useful for setting stop-loss orders and managing risk.
Target Price
A target price is identified, offering a potential exit point to capture gains from the expected upward move.

#HBAR/USDT tried to break the Diagonal trendline multiple times #HBAR/USDT tried to break the Diagonal trendline multiple times in 1-hour TF!
CRYPTOCAP:HBAR needs to break the Trendline to turn bullish. Wait for BO to long it. The local resistance level is PML $0.05842.
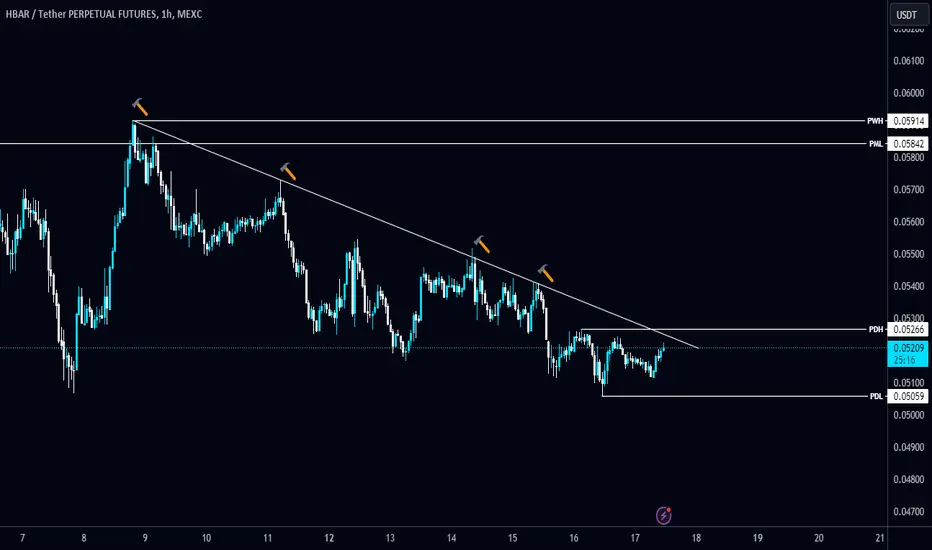
Is HBARUSDT Poised for a Bullish Breakout? Don’t Miss
Yello, Paradisers! Have you been keeping an eye on HBARUSDT? If not, now is the time! This one is setting up for a potentially explosive move, and you don’t want to be left behind.
💎#HBARUSD is currently nestled within a key demand zone around $0.0525, and it’s showing signs of a potential breakout. The price has been hugging a descending resistance, but it’s now edging closer to a critical juncture. If we see a break above this channel resistance, it could trigger significant bullish momentum.
💎However, if the momentum stalls and the price fails to hold this support, we might see a bullish rebound from the lower Bullish OB around $0.0506. Keep in mind, though if the price breaks below this level, it could invalidate the bullish setup and lead to a significant drop.
As always, make sure to implement sound trading strategies and set your stop-losses wisely. Keep a close eye on the market’s next moves, and stay tuned for more insights from us.
MyCryptoParadise
iFeel the success🌴

$HBAR | Allocation | Market Exec |Technical Confluences:
- Price action has bounced off a Support trendline and is in the range of a Demand Zone
- Price action is also close to an all-time low
Fundamental Confluences:
- HBAR is a Layer 1 blockchain which has potential for further adoption
- Recently in April, there was a big spike in CRYPTOCAP:HBAR price after an announcement that blockchain firms Archax and Ownera tokenized BlackRock's ICS UST Funds on Hedera
- Blackrock came out and clear the air that they are not involved with Hedera; the 2 firms were the ones who were involved in tokenizing it
- Although it is not a direct involvement by BlackRock, it gave HBAR Foundation alot of attention (potential moving forward)
________________________________
With the above fundamentals, I will allocate my first tranche of HBAR allocation for my Long-Term portfolio. I may trade on this pair with a tight SL level if it breaks below the Red Line shown.
Likely to hold onto this pair at least till it reaches the 161% Fibo Extension Supply Zone.
Remember, DYOR.
________________________________
Boosts 🚀, Follows ✌️, Shares 🙌 & Comments ✍️ are much appreciated!
If you have any ideas or charts, do share them in the 'Comments' section below and we can discuss our perspectives to improve or strengthen our strategies.
If you want something analyzed, do drop me a DM. :D
________________________________
Disclaimer: The above suggestion is an personal opinion in general and does not constitute as investment advice. Any decisions taken based on the above suggestion is purely your own risks. DYOR.

HBAR (Hedera Hashgraph): Falling WedgeTrade setup : Price remains in a downtrend. It broke below $0.06 support, which held in early July, and made another Lower Low of $0.045 support. It's now trading in a Falling Wedge pattern, which typically resolves in a bullish breakout and a trend reversal. We wait for such a breakout. Previously, price got a boost from news that BlackRock will leverage Hedera Blockchain to tokenize its money market fund.
Patterns : Falling Wedge Usually results in a bullish breakout. When price breaks the upper trend line the price is expected to trend higher. Emerging patterns (before a breakout occurs) can be traded by swing traders between the convergence lines; however, most traders should wait for a completed pattern with a breakout and then place a BUY order. Learn to trade chart patterns in Lesson 8.
Trend : Short-term trend is Strong Down, Medium-term trend is Strong Down and Long-term trend is Strong Down.
Momentum is Bearish but inflecting. MACD Line is still below MACD Signal Line but momentum may have bottomed since MACD Histogram bars are rising, which suggests that momentum could be nearing an upswing. Price is neither overbought nor oversold currently, based on RSI-14 levels (RSI > 30 and RSI < 70).
Support and Resistance : Nearest Support Zone is $0.045. Nearest Resistance Zone is $0.07, then $0.10.

HBAR Weekly Bear Flag Broken, Retest or Cont. Fib Targets?Bear flag trading is a technical analysis pattern used by traders to identify potential continuation of a downtrend in the financial markets. The pattern consists of two main components:
Flagpole: This is the initial sharp decline in price that creates a steep and rapid movement downward. It represents the strong selling pressure in the market.
Flag: Following the flagpole, the price enters a brief consolidation phase where it moves slightly upward or sideways within a parallel channel. This movement often takes the shape of a small rectangle or parallelogram that slopes against the direction of the previous decline (hence the "flag" shape).
Characteristics of a Bear Flag
Flagpole: A steep and strong decline in price.
Flag: A consolidation phase where the price moves in a small upward or sideways channel.
Volume: Typically, volume decreases during the formation of the flag and then increases again when the price breaks out of the flag pattern in the direction of the initial decline.
How Traders Use Bear Flag Patterns
Entry Point: Traders often enter a short position when the price breaks below the lower boundary of the flag, anticipating that the downtrend will continue.
Stop Loss: A stop-loss order is typically placed just above the upper boundary of the flag to limit potential losses if the pattern fails.
Profit Target: The profit target is usually set by measuring the length of the flagpole and projecting it downward from the breakout point of the flag.

Not looking good….Bad place the world is in, I fought in Afghanistan which seems like an entire life ago now. The way the Middle East is exploding and the lies and deceit from the American govt’ isn’t doing anyone any favors. Feel that this market dump is based on the turmoil created from a weak president backed by no one.

Hedera Crypto Set for Major Moves Based on 4H Chart AnalysisWhen examining BYBIT:HBARUSDT on the 4-hour chart, it's crucial to focus on the recent action and the technical indicators that provide insight into potential market movements. Over the last five periods, the closing prices have fluctuated slightly but consistently around the $0.0677 mark, reflecting a relatively stable market with minor volatility.
The 9 EMA (Exponential Moving Average) has shown a gradual decline, currently situated below the 20 EMA. This alignment indicates a bearish trend in the short term, suggesting that the recent price movements have been slightly negative. When the short-term EMA remains below the long-term EMA, it often signals continued downward pressure unless a significant reversal occurs.
MACD (Moving Average Convergence Divergence) values have shown a negative divergence with the MACD line remaining below the signal line. Although the histogram values have decreased in magnitude, they still reflect bearish momentum. This persistent negative divergence suggests that sellers maintain control, which could lead to further price declines unless bullish momentum is regained.
Meanwhile, the RSI (Relative Strength Index) has hovered around the mid-40s, slightly increasing towards the end of the observed periods. An RSI below 50 typically indicates that the market is experiencing more selling pressure than buying pressure. However, the recent increase in RSI could hint at a potential shift in momentum if it continues to rise and crosses above 50.
Key resistance levels to watch include $0.0682, $0.0687, and $0.0691. These levels represent potential points where selling pressure could increase, leading to a price pullback. Conversely, significant support levels are observed at $0.0675, $0.0661, and $0.0653. Should the price break below these supports, it could trigger further declines, whereas holding above these levels might indicate strong buying interest.
Given the current technical setup, traders might consider short trades if the price fails to break above the resistance at $0.0682, aiming for targets around the support levels of $0.0675 and $0.0661. On the other hand, a decisive move above $0.0682 could open the door for long trades, targeting the next resistance at $0.0687 and potentially higher to $0.0691 if bullish momentum strengthens.

HBAR to 0.14 (+55%)HBAR can move to 0.115 and then to 0.14, which would result in potential profits of 27% and 55% respectively. The stop loss is set at 0.06 (-33%). P.S. For traders operating on longer timeframes, there could be another target at 0.2, which would yield a profit of +122%.
Please note that this is a prediction and actual results may vary. Always invest responsibly.

30% UP or 30% DOWN Incoming!Currently trading at demand. If we get some buying pressure and start breaking previous candle highs, a 30% move to the upside is likely.
If we flip demand into supply, an almost equal move to the downside to the next support will become the most probable outcome.
Calculate Your Risk/Reward so you don't lose more than 1% of your account per trade.
Every day the charts provide new information. You have to adjust or get REKT.
Love it or hate it, hit that thumbs up and share your thoughts below!
This is not financial advice. This is for educational purposes only.

HBAR could have completed long-term ABC correctionBased on the Elliott Wave theory, it seems that HBARUSDT has been undergoing an ABC corrective pattern throughout the past two months. The correction has ended right at the previous supply area, which has transformed into a demand zone.
Therefore, it is reasonable to assume that buyers are starting to be active from the current price and we expect quite a rally from this coin. By the way, out buy signal has triggered, with precise stop loss and exit price.

HBAR LONGIt moves close to the bottom of its channel. It is very good for its price. We expect it to return to its upward trend in the next two months BITHUMB:HBARKRW BINANCE:HBARUSDT BITSTAMP:HBARUSD

|| HBARUSD || BREAKOUT PATTERN INCOMING!Current market sentiment has been fairly bullish resulting in a great week for the top 10 crypto assets, however, we are still to see a snowball effect onto assets outside of the T10.
Today I shall be discussing my perspective on the current Hbar market structure and why I feel it will be caught by the snowball to come.
At the time of writing this report, Hedera is sitting at 0.0737, which is also a strong level of resistance depicted by the fib retracement I have placed (38.2%)
Patterns: Let me start off with the defending bullish pennant we are currently in. This pattern although a good confluence alone, has been suppressed by the fib retracement 50% ($0.0720) which has in turn created a double bottom suppression breakout formation.
Both the pennant and double bottom patterns have targets set at 0.080, however, there is a level of resistance as my conservative target at 0.0785-93.
I expect price to break to the baseline of my DB formation at 0.0756 before completing the pennant formation by converting the pattern resistance into support before continuing. this action will add confluence to my projections.
Slightly bearish yet healthy alternative would be if price was to fall below 0.0720 (50% fib) to the golden ratio set at 0.0703-698. This movement would of course void the existing double bottom, however, would add additional confluence in the bullish pennant narrative.
Price range to watch over in the following days are between 0.0756 (resistance + baseline of DB) and 0.0720. A break from either levels will result in a fairly impulsive move to our conservative target (0.0785-93) or to our golden ratio (0.0703-698)
Thank you for your interest in my report. I truly hope you were able to receive some informative insights on the current Hbar market that is able to aid your pre-existing perspective on the Hbar price structure.
THIS IS NOT FINANCIAL ADVICE!

HBAR/USDTIts good for spot on Mid/Long term!
HBAR is relate to a wonderful project!
2 step is logical for buying according to DCA !
stoploss will be activated if daily close seen under the last step

HBAR - weekly levels and a few daily dabblingsSaw someone post on X about HBAR and remembered I should check on it and see the long term outlook of things.
Daily timeframe with a weekly / monthly outlook so come back to this one at the end of the year lol.
HBAR: I'm going all in on this dip.A solid demand zone for HBAR, and I'm keeping an eye out for a dip, especially with Bitcoin's current trend. If Bitcoin drops, HBAR follows. This could be a prime opportunity for a long.
