#HBAR (SPOT) entry range(0.0470 - 0.0520) T.(0.0970) SL (0.0453)entry range (0.0470 - 0.0520)
Target (0.0970)
SL .4H close below (0.0453)
************************************
#HBAR
#HBARUSDT
#HBARUSD
BINANCE:HBARUSDT
#swingtrade
#shortterminvestment
#ALTCOIN
#Cryptotading
#cryptoinvesting
#investment
##trading
#cryptocurrencytrading
#bitcoininvestments
#Investing_Coins
#Investingcoins
#Crypto_investing
#Cryptoinvesting
**** #Manta ,#OMNI, #DYM, #AI, #IO, #XAI , #ACE #NFP #RAD #WLD #ORDI #BLUR #SUI #Voxel #AEVO #VITE #APE #RDNT #FLUX #NMR #VANRY #HBAR ****
#bitcoin
#BTC
#BTCUSDT
HBARUSDT trade ideas

HBAR x ETC theoryBINANCE:HBARUSDT looks very similar to the old BINANCE:ETCUSDT chart… 😑
Based on this similarity, the target prices are $0.75 and $1.19, or ~$28 billion and $45 billion in market cap

HBAR D Update
Corrective price action suggests the downtrend is not over yet.
Lack of RSI divergence supports this idea.
I expect a lower low below the purple line.
A recovery above the purple line and descending trendline will be indicative of a reversal.

HBAR Long- Dragon into an IH&S Pattern
- Confirmation of accumulation and seller exhaustion
- All happening at a key level
- Hidden bullish divergence

HBAR Channel Bounce Again ?Based on the updated chart for Hedera Hashgraph (HBAR), the token is currently touching a strong horizontal support level around $0.0491, following repeated touches on this line over the past few months. The formation suggests that HBAR may be poised for a potential reversal toward the upper boundary of the ascending channel, aligning with the projected resistance around the $0.0669 mark. This resistance line is confirmed by previous price peaks and the upward trend of the channel, which has guided HBAR’s movement. The recent decline along the dotted resistance line within the channel has reinforced downward pressure; however, the touch at the bottom support zone suggests that HBAR could see a bounce soon. If this support holds, an upward move targeting $0.0669 is feasible, provided there is sufficient bullish volume to support the breakout.

HBARUSDTHBAR ~ 1W
#HBAR Price again retested this key support. If you have Conviction on this Token, This is the right time to start accumulation.

Long HBAREntry1: Low of the recent LTF range
SL: at the bottom of the range (risk to have it taken and go in our direction) - so.. better have a wider SL
TP: just above the range
Entry2: Low of the recent range
SL: under the range lows
TP: top of the channel where we might encounter strong resistance

HBAR/USD3 scenarios, depending on the price action.
Long @0.5 if the support line is tested
Short@0.57 if the resistance there is tested.
Long@0.57 if the resistance Is broken and the price retraces to the price

HBARUSDT - buy the bottomThe pattern was successfully broken on the 3-day frame
The currency is now at its bottom
I expect it to reach the March peak during this wave
Best regards Ceciliones🎯

HBAR is in nice entry zone!Hedera (HBAR) is one of the coins which I like because of their technology and a lot of other things that you can find on their network. Also they have a lot big companies like Ubisoft, Google and IBM as a part of the Hedera Governing Council. Price is now in good entry zone for those who would like to buy it. This is trade (investment) setup on larger timeframe. I am not looking to reach targets 2,3,4 and 5 very soon, that could be year(s). I will sell most of my capital on targets 3,4 and 5. Small portion will be sold on Targets 1 and 2.
Entry Zone: 0.040 – 0.049
Buy Zone: 0.0125-0,0203
Target 1: 0.24 – 0.26 (394%)
Target 2: 0.31 – 0.33 (546%)
Target 3: 0.42 – 0.44 (774%)
Target 4: 0.56 – 0.58 (1043%)
Target 5: 0.90 – 0.95 (1761%)

HBAR/USDT LONG TRADE IDEAHBAR/USDT is in bullish trend and according text books i have marked BOS and demand zone that caused BOS, this is the zone where we will look for long below the marked sell side liquidity. Clear chart given.

HBAR ready to make a new Higher High?Is #HBARUSDT ready to make a higher high?
Here’s how this trade could unfold:
When the daily candle closes above the resistance line at 0.0596, we will have an official higher high.
The first target (wave 1) is around the 200 EMA at 0.0729.
After a retest of the resistance line (wave 2), which will then become the support line, the next target (wave 3) is between the 1 and 1.6 Fibonacci levels at 0.0929 - 0.1115.
We may then see a retracement (wave 4) to the 0.382 Fibonacci level at 0.0994.
The final leg (wave 5) will push to a new high above the top of wave 3.
REMARKS:
• It is important to emphasize that any information or content you encounter here is not intended as financial advice. We want to make it clear that we are not authorized or qualified to provide personalized investment advice. Our content, including ideas, opinions, views, predictions, forecasts, commentaries, suggestions, or stock picks, should be viewed strictly as informational, entertaining, or educational material.
• We emphasize that you should not construe the information provided here as personal investment advice or as a recommendation to take specific investment actions. It is crucial to conduct your own research, consider your individual financial circumstances, and consult with a qualified financial professional before making any investment decisions.
• While we aim to provide accurate and reliable information, we cannot guarantee the absence of errors or inaccuracies. Therefore, it is recommended to independently verify any information provided and exercise your own judgment when using it for decision-making purposes.
• Please be aware that any actions you take based on the information found here are done so at your own risk. We disclaim any liability for the consequences of your actions or decisions stemming from the information presented.
• Our intention is to provide helpful information that can contribute to your overall understanding and assist you in making better-informed decisions. However, it is essential to exercise caution, seek professional advice, and take responsibility for your investment choices.
Cheers and have fun.
° Be Patient – Don’t panic – Trade Emotionless.
° Never lose a winning trade.

HBAR Looks bullishWarning: This is an analysis on a daily time frame. To enter a position, you need to enter a position in a valuable range and have a trading setup.
From where we placed the red arrow on the chart, it seems that the HBAR correction has started.
The correction seems to be a diametric that is over.
By maintaining the green range, it can move towards the targets.
The targets are marked on the chart.
Closing a daily candle below the invalidation level will violate the analysis.
For risk management, please don't forget stop loss and capital management
When we reach the first target, save some profit and then change the stop to entry
Comment if you have any questions
Thank You

#HBAR/USDT#HBAR
The price is moving in a descending channel on the 1-day frame and is sticking to it very well and is expected to break it upwards
We have a bounce from a major support area at the lower line of the channel at 0.04410
We have a downtrend on the RSI indicator which supports the rise
We have a trend to stabilize above the 100 moving average
Entry price 0.04972
First target 0.06127
Second target 0.07280
Third target 0.08400

HBARUSDTHBAR ~ 1W
#HBAR Price again retested this key support. If you have Conviction on this Token, This is the right time to start accumulation.

HBAR Technical Analysis in a Weekly TimeframeHello everyone, I’m Cryptorphic.
I’ve been sharing insightful charts and analysis for the past seven years.
Follow me for:
~ Unbiased analyses on trending altcoins.
~ Identifying altcoins with 10x-50x potential.
~ Futures trade setups.
~ Daily updates on Bitcoin and Ethereum.
~ High time frame (HTF) market bottom and top calls.
~ Short-term market movements.
~ Charts supported by critical fundamentals.
Now, let’s dive into this chart analysis:
HBAR has been in a bearish trend for quite some time and is currently holding at the support trendline. The support range between $0.0290 and $0.0375 is crucial for a potential rebound.
Failure to hold this support level could have a further negative impact on the price in the long term.
On the other hand, a rebound from the current price or the support range could lead to a test of the resistance trendline near $0.0767. To reach its all-time high, HBAR would need a 14x-15x gain, which would be a significant challenge.
Key Levels:
- Initial Support: $0.0452.
- Crucial Support/Good Entry: $0.0290.
- Primary Resistance: $0.0767.
- RSI: Close to the oversold zone.
DYOR, NFA.
Please hit the like button to support my content and share your thoughts in the comment section. Feel free to request any chart analysis you’d like to see!
Thank you!
#PEACE

Critical Analysis: Is HBAR Set for a Major Breakout or BreakdownHedera Hashgraph (HBAR) has been under heavy selling pressure for some months, as indicated by the continuous drop on the daily chart. Since April 2024, the asset has continually made lower highs and lower lows, which is a classic bearish market pattern. The descending trendline (Red) indicates the current negative trend, which HBAR has struggled to break above. Recent price activity indicates an attempt to challenge this trendline, but the effort was swiftly greeted with resistance, causing the price to drop back to its present level of $0.0494.
In terms of support and resistance, HBAR faces several key levels that traders should keep an eye on. The immediate resistance is found at $0.0519, just above the current price. Should the price manage to overcome this resistance, the next significant hurdle is the resistance zone (Green) at $0.0585 - $0.0604, a level that previously acted as support in early August but now serves as a formidable resistance point. This zone not only aligns with the downward trendline but also represents a point where sellers have repeatedly stepped in to halt upward momentum.
On the downside, HBAR has an immediate support zone (Yellow) at $0.0458 - $0.0443 on the chart. This support is crucial as it represents the last line of defense before the price potentially drops to the $0.0399 area, where historical price action suggests buyers might re-enter the market. However, the overall low trading volume observed recently indicates a lack of strong buying interest, which could mean that sellers remain in control and could push the price lower.
The overall outlook for HBAR remains bearish. The ongoing decline, combined with the failure to break above major resistance levels and a lack of significant buying activity, indicates that more declines are possible. If the price fails to hold the support zone (Yellow), it may fall even further to $0.0399. On the other side, if bulls can push the price above $0.0519, the descending trendline and the resistance zone (Green), it may signify the start of a trend reversal, with the resistance zone (Purple) at $0.0780 -$0.0797 being the next target and if the momentum remains intact then the price could reach to the next levels marked on the chart. Traders should keep an eye on these levels to see what path HBAR may take next.

HBAR with the Adam & Eve patternTextbook Adam & Eve pattern here on HBAR. Looking for $0.076. Close down below the neckline invalidates pattern. Also, looks like we're putting in a C- wave up.

Hbar is ready to return!!HBAR is ready to continue its uptrend, provided it can maintain this uptrend line and not breach its demand area.

HBARUSDT 1WHBAR ~ 1W
#HBAR Price again retested this key support. If you have Conviction on this Token, This is the right time to start accumulation.

HBARUSD BUY (RRR 1:3,85)Hello,
Here's a concise update based on our latest technical analysis chart:
Liquidity Sweep
We've seen a liquidity sweep, where the price dipped to clear out stop-loss orders, gathering liquidity for a potential upward move.
Broken Downtrend
The downtrend has been broken, suggesting a possible shift in market sentiment from bearish to bullish.
Volume Increase
There's an increase in volume, indicating heightened trading activity and interest at these levels.
Identified Buy Zones
We've identified three key buy zones:
Buy Zone 0: New entry point based on current analysis.
Buy Zone 1: Above the downtrend break, signaling a potential entry for reversal trades.
Buy Zone 2: Above the weekly Fair Value Gap (FVG), providing another strategic entry point.
Fibonacci Retracement
The Fibonacci retracement levels (61.8% - 78.6%) are marked, often used to identify potential reversal points.
Rejection Point
A rejection at a specific level indicates strong resistance, useful for setting stop-loss orders and managing risk.
Target Price
A target price is identified, offering a potential exit point to capture gains from the expected upward move.

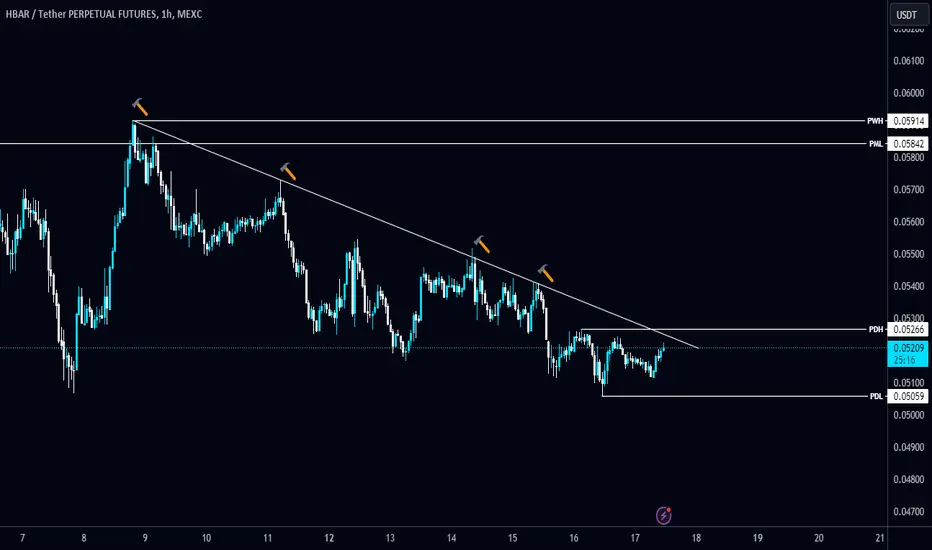
#HBAR/USDT tried to break the Diagonal trendline multiple times #HBAR/USDT tried to break the Diagonal trendline multiple times in 1-hour TF!
CRYPTOCAP:HBAR needs to break the Trendline to turn bullish. Wait for BO to long it. The local resistance level is PML $0.05842.
Is HBARUSDT Poised for a Bullish Breakout? Don’t Miss
Yello, Paradisers! Have you been keeping an eye on HBARUSDT? If not, now is the time! This one is setting up for a potentially explosive move, and you don’t want to be left behind.
💎#HBARUSD is currently nestled within a key demand zone around $0.0525, and it’s showing signs of a potential breakout. The price has been hugging a descending resistance, but it’s now edging closer to a critical juncture. If we see a break above this channel resistance, it could trigger significant bullish momentum.
💎However, if the momentum stalls and the price fails to hold this support, we might see a bullish rebound from the lower Bullish OB around $0.0506. Keep in mind, though if the price breaks below this level, it could invalidate the bullish setup and lead to a significant drop.
As always, make sure to implement sound trading strategies and set your stop-losses wisely. Keep a close eye on the market’s next moves, and stay tuned for more insights from us.
MyCryptoParadise
iFeel the success🌴
