HBAR could have completed long-term ABC correctionBased on the Elliott Wave theory, it seems that HBARUSDT has been undergoing an ABC corrective pattern throughout the past two months. The correction has ended right at the previous supply area, which has transformed into a demand zone.
Therefore, it is reasonable to assume that buyers are starting to be active from the current price and we expect quite a rally from this coin. By the way, out buy signal has triggered, with precise stop loss and exit price.
HBARUSDT trade ideas

HBAR LONGIt moves close to the bottom of its channel. It is very good for its price. We expect it to return to its upward trend in the next two months BITHUMB:HBARKRW BINANCE:HBARUSDT BITSTAMP:HBARUSD

|| HBARUSD || BREAKOUT PATTERN INCOMING!Current market sentiment has been fairly bullish resulting in a great week for the top 10 crypto assets, however, we are still to see a snowball effect onto assets outside of the T10.
Today I shall be discussing my perspective on the current Hbar market structure and why I feel it will be caught by the snowball to come.
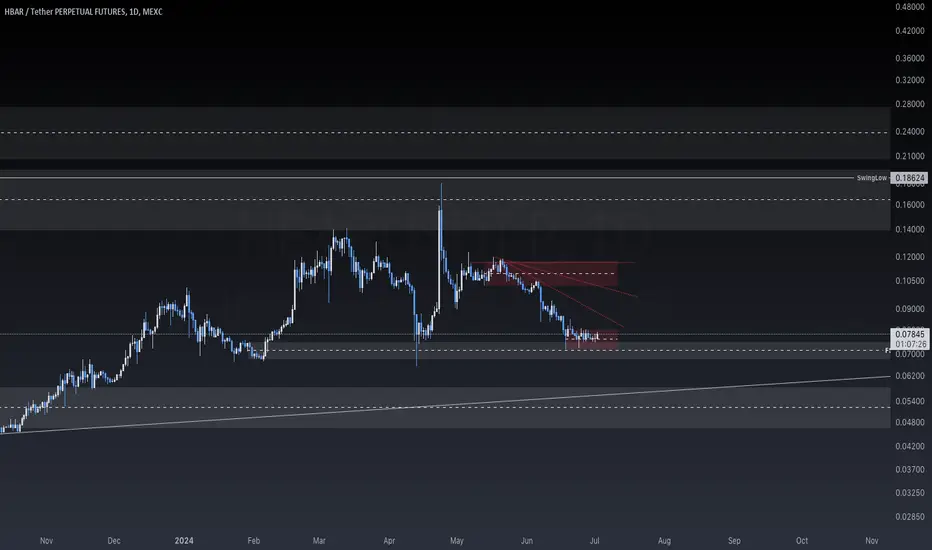
At the time of writing this report, Hedera is sitting at 0.0737, which is also a strong level of resistance depicted by the fib retracement I have placed (38.2%)
Patterns: Let me start off with the defending bullish pennant we are currently in. This pattern although a good confluence alone, has been suppressed by the fib retracement 50% ($0.0720) which has in turn created a double bottom suppression breakout formation.
Both the pennant and double bottom patterns have targets set at 0.080, however, there is a level of resistance as my conservative target at 0.0785-93.
I expect price to break to the baseline of my DB formation at 0.0756 before completing the pennant formation by converting the pattern resistance into support before continuing. this action will add confluence to my projections.
Slightly bearish yet healthy alternative would be if price was to fall below 0.0720 (50% fib) to the golden ratio set at 0.0703-698. This movement would of course void the existing double bottom, however, would add additional confluence in the bullish pennant narrative.
Price range to watch over in the following days are between 0.0756 (resistance + baseline of DB) and 0.0720. A break from either levels will result in a fairly impulsive move to our conservative target (0.0785-93) or to our golden ratio (0.0703-698)
Thank you for your interest in my report. I truly hope you were able to receive some informative insights on the current Hbar market that is able to aid your pre-existing perspective on the Hbar price structure.
THIS IS NOT FINANCIAL ADVICE!

HBAR/USDTIts good for spot on Mid/Long term!
HBAR is relate to a wonderful project!
2 step is logical for buying according to DCA !
stoploss will be activated if daily close seen under the last step

HBAR - weekly levels and a few daily dabblingsSaw someone post on X about HBAR and remembered I should check on it and see the long term outlook of things.
Daily timeframe with a weekly / monthly outlook so come back to this one at the end of the year lol.
HBAR: I'm going all in on this dip.A solid demand zone for HBAR, and I'm keeping an eye out for a dip, especially with Bitcoin's current trend. If Bitcoin drops, HBAR follows. This could be a prime opportunity for a long.

The time is drawing near for HBAR.After the amazing rally that we saw a few months ago, the price of HBAR has been decreasing steadily with the broader crypto market, allowing retail investors to stockpile the asset.
Enjoy the ride!

HBAR: Approaching SupportTrade setup : Price broke below $0.10 support and 200-day moving average, which signaled resumption of downtrend. Price got oversold (RSI < 30) as it reached $0.07 support and bounced up. However, it needs to break back above 200-day MA to signal resumption of Uptrend. Previously, price got a boost from news that BlackRock will leverage Hedera Blockchain to tokenize its money market fund.
Pattern : Price is Approaching Support , which is a level where it could pause or reverse its recent decline, at least temporarily. Support is often a level where price has bounced up in the past, or potentially prior Resistance level that was broken. (concept known as polarity). Once price breaks below support, it can move lower to the next support level. Learn to trade key levels in Lesson 7.
Trend : Short-term trend is Strong Down, Medium-term trend is Strong Down and Long-term trend is Down.
Momentum : Price is neither overbought nor oversold currently, based on RSI-14 levels (RSI > 30 and RSI < 70).
Support and Resistance : Nearest Support Zone is $0.07. Nearest Resistance Zone is $0.124, then $0.14.

Bullish continuation: this looks bullish AFDescription:
- 1-2, 1-2 setup, 2nd wave (leading diagonal).
After some research concluded that there are only 2 bullish scenario's, namely 1) straight into 3rd wave or 2) in B wave (ABC). For obvious reasons, a prolonged correction would be ideal. A deeper pullback for a wave C would bring the 1.618fib much higher.

👀short-mid term targets for $Hbar! 45%-100%+ possible Hello traders! I have been watching the overall crypto market for a while. Btc recently crashed down to $40k from 49k but it was very necessary move to cool down the market,adjust the RSI values and kick some weak hands out of trade! Btc feels stable above $40k .Of course there may be some successful attempts to go down below this level or not.Most importantly I am not focusing on Btc giant's short term tricks. It is all part of illusion or some would call it warm up run before the fireworks. Soon Btc will break above 50k and altcoins will flourish at that point!
Recently Hbar making significant progress all around.Very healthy correction on short and long term charts and weekly rsi is at strong 59 and chart looking like a golden statue👀 .It would be quite mistake to ignore this giant! If you are not familiar with the project please do some research! My personal assumption is that we going to see major move with this coin. It could be a lot more than what my prediction is but I need to keep it realistic!
Good Luck!

HBAR Super BullishHBAR/usdt this setup on 1D TimeFrame is super bullish because of its previous pump.
Must enter after getting tapped into the Demand Zone Marked.
Confluences are simple.
Market Structure Daily Demand Zone and making HH and HL.

HBAR/USDT Will It Bounce at the Crucial $0.0985 Demand Area?💎 HBAR is showing some notable activity, with a potential retest on the horizon at the demand area around $0.0985.
💎 The key question is whether it will bounce up from this level or break through it. Historically, HBAR has often bounced back upon reaching this area, suggesting it might repeat this pattern.
💎 For HBAR to continue its upward journey, it must overcome the resistance at $0.124. Failure to breach this resistance could send the price back down as it gathers momentum for another try.
💎 On the downside, if the demand area fails to support HBAR and it breaks through, we could see it move towards the Bullish Order Block (OB) area to gather significant momentum, similar to previous patterns. HBAR must maintain above the OB area, which is pivotal for its trajectory.
💎 The bullish scenario becomes invalid if HBAR closes a daily candle below the OB area at $0.0878. Such a move could signal further dips in the price.
MyCryptoParadise
iFeel the success🌴

$HBAR GOING UP !👨🏻💻 CRYPTOCAP:HBAR /USDT
#HBAR /USDT
A breakout from a falling wedge pattern has occurred and been retested successfully🧐
Target for the bullish move is around 10% from current levels🎯
BINANCE:HBARUSDT
#CryptoEase

$HBAR BULLISH ADAM & EVE PATTERNCRYPTOCAP:HBAR on TF1W looks bullish, currently we are retest EMA21 support and previously prices get boost to 100%++ after retest EMA21 support. besides that currently CRYPTOCAP:HBAR showing bullish ADAM & EVE chart pattern, hopefully this chart pattern will valid and price boost UP in couple weeks. #DYOR

HBAR idea | HbarUSDT key levels HBAR | HbarUSDT key levels
best time for hbar will be only above $0.1254/0.1707
closing/opening must be above $0.1254

HBARUSDT this is my idea about HBARUSDT pairs
you can watch everything clearly on the screen pairs
you can enter from entry points about 0.0998/0.0992
and stoplose point.

HBAR ( Hedera ) tm :1hHello traders.
I hope you doing well.
These areas are based on my personal strategy and I will share it with you.
Open a sell position on the supply area or open a buy position on the demand area.
Your entry point, stop loss, and target point are based on money management and the amount of money in your trading account.
But I promise you that by trading in the areas of my trading strategy, you will definitely make a profit, because these areas, although they seem simple, are my experience of 8 years of learning and trading.
I hope you will achieve maximum continuous profit with me by using supply and demand areas.
Good luck traders.
Mohammad Goodarzi

HBAR Elliot Wave Analysis HBAR, the most recent price action on CRYPTOCAP:HBAR is likely to have been a running flat with resolution now, or at the next Fibonacci level.

#HBARUSDTCRYPTOCAP:HBAR
Getting are entry for the bullish continuation, expecting more pump
#forex #forextrading #forexsignals #crypto #forexlifestyle #money #lifestyle #trade #stock #cash #iphone #daytrading #currencytrading #tradingonline #swingtrading #profit #forextips

Hedera (HBAR)On the above weekly chart price action has corrected over 90% since the sell signal (not shown). Today is great long opportunity. Why?
1) RSI and price action resistance breakout with support confirmation.
2) Multiple oscillators print bullish divergence.
3) Trend reversal. Higher highs higher lows replace lower highs lower lows.
4) The macro bull-flag confirmation prints the 50 cent target.
Is it possible price action falls further? Sure.
Is it probable? No.
Ww
Type: trade
Risk: <=6% of portfolio
Timeframe: Now, don’t sit on your hands.
Return: 8x

#HBAR/USDT LONG ENTRY#HBAR/USDT LONG ENTRY
Leverage: 3x
Entries: $0.11564
Take profit 1: $0.11931
Take profit 2: $0.12321
Take profit 3: $0.13747
Stop Loss: $0.10664
NOTE: This is just my prediction. Be sure to use STOPLOSS and remember that I am not a financial adviser. your money, your risk!
BINANCE:HBARUSDT.P
Thanks
The sroced.

HBARUSDT 2H#HBAR is moving inside a symmetrical triangle on the 2H timeframe. Wait for the breakout or breakdown and then enter. If it breaks the triangle to the upside:
$0.1149
$0.1226
If it breaks the triangle to the downside:
$0.1025
$0.0970

HBAR 30c incomingAfter the blackrock breakout and the ETH maxi FUD bringing us back to earth, she looks fully reset and ready to run.
Only a matter of time till the trade is complete to 28/30c, and as these are high retracements on the market cap chart, I am dipping.
One of the best assets in the space, the tech is unrivalled. Maybe not the biggest gains, but definitely one of the safest. Send it
