HBAR/USDT Break Alert!! Indicating Bullish Momentum for HBAR.💎HBAR has recently displayed noteworthy market dynamics, breaking out of the Adam and Eve pattern, signifying a reversal from bearish to bullish sentiment.
💎 Currently, the price is undergoing a retesting phase at the support level, which previously acted as resistance. This phase is crucial before any further upward movement, probability leading to reaching our target area.
💎 However, if HBAR fails to bounce during this retesting phase, or worse, breaks down below the support area, the price may revert to a downward trajectory, heading towards the demand area.
💎It's imperative for the price to bounce decisively from the demand area to resume its upward trajectory.
💎 Failure to do so, or a breakdown below the demand area, would raise concerns about continued downward movement. In such a scenario, the price could retreat further towards lower levels.
HBARUSDT trade ideas

HBAR breaks out 10.44% in the early hours.As I've posted previously, HBAR is in a massive cup & handle chart pattern on the daily chart, and this morning popped up a massive 10.44% in the early hours, but this is just the beginning of what I believe we are going to see over the next few weeks/months.
The gains in HBAR are going to be EPIC heading into summer, as crypto investors and trader's alike are going to realize just how undervalued HBAR is in the utility crypto sphere.
Good luck traders, and always use a stop.

HBAR/USDT In the key support area, Could HBAR Bounce or Broke ??💎 HBAR has recently become a focal point in the cryptocurrency market. Presently, HBAR is positioned at a crucial support area, previously acting as a resistance level.
💎 Historically, this zone has demonstrated considerable strength in preventing HBAR's decline, suggesting a likelihood of a rebound from this point. Such a bounce would potentially initiate a renewed upward trajectory, possibly propelling HBAR towards its target in the strong resistance area.
💎 However, should HBAR fail to maintain its stance above this support level, indicating a breakdown, it could spell a significant shift in market sentiment. A breach of this support could disrupt the existing bullish trend, potentially ushering in bearish momentum. In such a scenario, HBAR might experience a downward trajectory, with its next critical juncture being the demand area.
💎 The demand zone thus becomes pivotal for HBAR's recovery prospects. A strong response in this area, characterized by a bounce and a subsequent reclamation of price levels above the previous support, is essential. Failure to achieve this could cement a bearish trend, leading HBAR to extend its decline, potentially reaching even lower towards the strong demand area.


HBAR 1H BULLISH WAVEHBAR is swinging in range for past two weeks and it is ready to make some move from here, stop loss should be just below the daily close and targets should be 15-20%.

Hbar, how we see itHello Birdies,
We have a breakout on monthly and weekly. Lets wait for a retracement on the breakout level. We try to refine the entry as much as possible.
But dont miss the trade if you see price getting bullish from any level around price 0.95 take it.

HBAR/USDT Keep an eye in key area. Could HBAR Bounce from here ?💎 HBAR has recently experienced significant market developments. Positioned at a critical demand zone, HBAR needs to secure a bounce from this level to resume its upward trajectory.
💎 A positive indication would be observed in the daily close, with a bullish candle rejection, probability signaling HBAR's attempt to resume upward movement and reach our targeted strong resistance area.
💎 However, failure to sustain at this demand level could be concerning, as it would signify a breach of a crucial area. This could prompt a reversal to downward movement, with the next support level located at 0.057.
💎 To continue upward momentum, HBAR needs to bounce from the support area and reclaim the region above the demand area. In the absence of positive signals, a prolonged sideways movement may lead to HBAR losing support, initiating a downward movement towards the robust demand area.

HBARUSDTHBARUSDT has given the clean breakout of long term consolidation. And now the market is retesting the broken level. sellers seems to be exhausted.
if this breakout holds the next upside targets will be 0.14 followed by 0.18

#HBAR NEXT MOVEGet set for explosive growth with HBAR! Hedera Hashgraph's innovative technology and widespread adoption make it a standout in the crypto market. With lightning-fast transactions and solid partnerships, HBAR is primed for substantial gains. Don't miss out—ensure your bags are packed for big gains on this exciting journey!

HBar- Not ForgottenWe begin...
Looking for some tokens (old) below the bearish line for a long play..
Hbar is one of them looking at the Weekly time frame

HBAR NEW VOLUME TRENDThank you for reading this update.
HBAR seems to have entered a new volume trend that could get new confirmations in new time frames.
The data frame shows an interesting view of HBAR

HBAR Weekly Confirmed BreakoutHBAR Weekly Confirmed Breakout
Trade with minimum Risk & high returns
Cheers enjoy grow my community more
thanks in advance happy printing money
HBAR USDT#HBAR update:
After retesting the blue zone, it presents a favorable entry opportunity. Remember always use stop loss it is your friend. Everything is on the chart.

HBAR - are we early or late?With the "older" coins Im unsure. They had their time but will they have another bull run like in 2021? I doubt it but I am trying to make some gains.. Looking good now.
Sell orders at 0.5, 0.618, 0.702 and you?

6H HBAR golden pocketPrice in gulden pocket from bullish swing low
I want market structure conducive for bullish price movement.
0.15 Terminus on mind
If price breaks 10c low, then I am looking for shorts when price retraces to premiums.

HBAR looks greatEverything is so good except Bitcoin haha. Just discovered this one. Textbook accumulation pattern. I'm expecting it to hold the newly broken level.

HBAR breaking out from accumulation zoneHey guys, it's me, sometime I find the time to post a longer analysis even here. I post many quick others on socials.
But let's talk about HBAR: the main picture is the weekly where it appears clear price is breaking out from an accumulation zone which lasted 630 days. A classick Wyckoff accumulation pattern is happening, I will update with a possible trajectory once the breakout is confirmed or the retest is confirmed. Anyway on LTF the forecast is bullish (like anything else these days) even because volume was good. I will wait the end of the week to see how the candlestick closes because there's a bearish DIV on RSI.
I had an hold bag and I added but wonder how much this could go up, I think a 3 to 5x could be the maximum we'll get to be fair but I hoping is free, as long as you remain realistic!
About lower timeframes you can see here the support zone if this retracement completes
daily:
At 4H that liquidity gap that could be be filled or at least touched during the retracement is more visible.
4H:
On the long term I suggest buying if that gap is touched and price bounces back. If it doesn't I'll post updates.

HBARUSDT predictionAs someone new to the world of analysis, I've recently conducted an analysis on HBARUSDT within the one-hour timeframe. I'm reaching out to seek your expertise and feedback on my approach and findings.
Being a beginner in analysis, I'm eager to learn and improve my skills. Any insights or advice you could provide would be greatly appreciated.

HBARUSDT Bullish Flag Pattern!HBARUSDT Technical analysis update
HBAR formed a bullish flag pattern on the 1-hour chart. If the price exceeds the resistance line of the flag pattern, it could indicate potential upward movement in HBAR
Buy zone : Below $0.108
Stop loss : $0.100
Regards
Hexa

[HBARUSDT] - catch it before it's so lateLooks great for weekly chart.
Breaking round bottom pattern after a 2 yaers of accumulation make it go to the most important level ( 0.618 fib ).
Incase breakout making our target is 3$
Don't forget to support us with ur like, comment and follow for more updates🎯

HBAR bullishHBAR looking bullish
target 0.26
stop loss at 0.95
this is not financial advice.
good luck!

BINANCE:HBARUSDT - Double bottom is giving double profits. ---------------------------------------------------------------
Description
---------------------------------------------------------------
+ The double bottom pattern stands out as one of the most reliable indicators of a potential reversal in market sentiment. Its appearance often heralds a shift from a downtrend to an uptrend, making it a favored pattern among traders seeking opportunities for profitable reversals.
+ A meticulous analysis reveals a distinct and well-defined double bottom pattern, characterised by two consecutive troughs followed by a significant rebound. This pattern's adherence to the classic double bottom structure further enhances its reliability as a signal for a bullish reversal. Traders recognising the significance of this pattern would undoubtedly find this observation noteworthy, as it strengthens the case for an imminent uptrend.
+ With the double bottom pattern confirming its efficacy through a robust bounce-back, attention naturally turns towards identifying potential price targets. The next target for this trade is projected to be 0.1014, representing a significant milestone in the anticipated uptrend. Market participants tracking this trade closely would view this target as a key level to monitor, as its attainment could signal further bullish momentum in the asset's price trajectory.
---------------------------------------------------------------
VectorAlgo Trade Details
------------------------------
Entry Price: 0.0781
Stop Loss: 0.0671
------------------------------
Targets 1: 0.0817
Targets 2: 0.0854
Targets 3: 0.0927
Targets 4: 0.1014
------------------------------
Timeframe: 1D
Capital: 1-2% of trading capital
Leverage: 5-10x
---------------------------------------------------------------
Enhance, Trade, Grow
---------------------------------------------------------------
Agree or Disagree with the ideas ? lets discuss in the comments.
Like and follow us for more ideas.
Regards
VectorAlgo

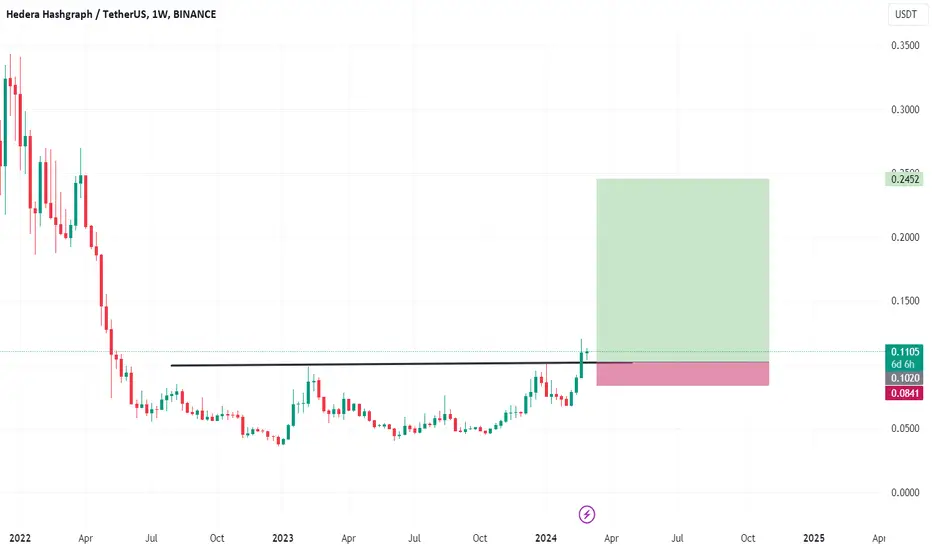
HBAR-Genuine break and 100% rise?BINANCE:HBARUSDT is a coin that I've been closely monitoring this year, awaiting a buy confirmation. As depicted on the chart, after experiencing a more than 90% drop from its peak, the price began consolidating and has now formed a clear resistance in the 0.10 zone. This significant resistance was finally breached yesterday, and if it proves to be genuine, we could anticipate a rise to the next resistance level, which is approximately at 0.2, indicating a potential 100% increase.
Today, the price is undergoing a normal correction, presenting a potential buying opportunity. Considering a stop loss of around 0.085, such a trade would offer a risk-to-reward ratio of 1:4.
