$HBAR SHOOOORT it!I certainly think it is at a completely insane level of overbuying.
Short it before BTC dump everything.
HBARUSDT trade ideas


Mock Up Price Action for HBAR I'll Be Tracking | Mid TermMock Up Price Action for HBAR I'll Be Tracking | Mid Term

Hbar 4 Hour Descending Triangle 🐻 Spotted this on the 4 hour chart cant fully determine if there is any validity to it. Anybody have some input?

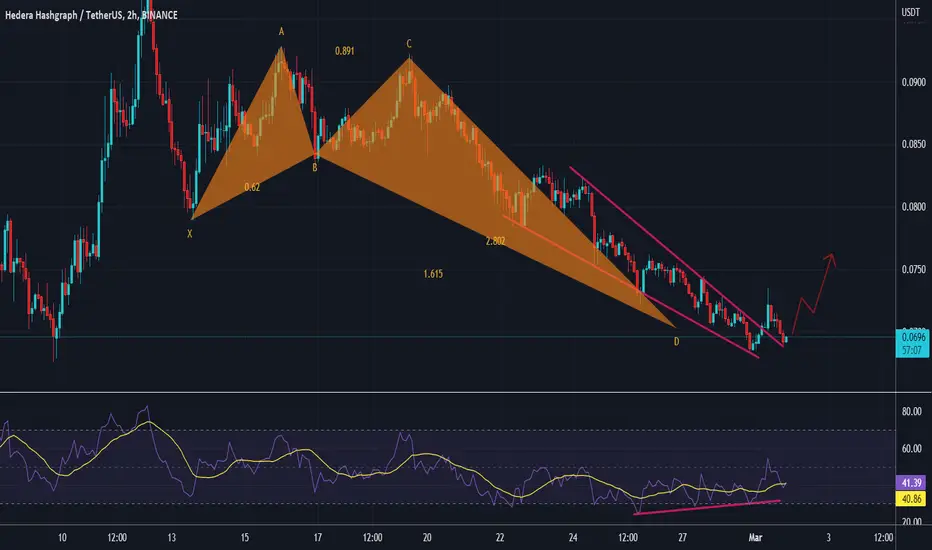
HBARUSDT long ideadentry point is match with 0.5 level and a support and resistance area.
also this is a consolidation area and im thinking price can rebalance here before drop more
Entry 0.065
R/R 2.7
⚠️
This is not an Financial advice and only my personal opinion

Mock Up Price Action for HBAR I'll Be Tracking | Medium TermMock Up Price Action for HBAR I'll Be Tracking | Medium Term

HBAR/USDT Keeping It SimpleHey, traders ✌️
Next one that caught our attention is HBAR coin with the market price below resistance and 100 EMA. On daily chart we see that price has formed a nice triangle formation where it has been bouncing from one side to another. Currently we see good chance for a breakdown from that lower side of triangle formation but there is also a probability of breakout to happen due to todays FOMC. So until the news we will be just watching!
If you like ideas provided by our team you can show us your support by liking and commenting.
Yours Sincerely,
Swallow Team 🔱
Disclamer:
We are not financial advisors. The content that we share on this website are for educational purposes and are our own personal opinions.

HBAR CLEAN MOVE HERE Hbar breaking the Downtrend and now trading in PENNAT wait for Breakout and then open a long Trade and collect 50% move
HAPPY TRADING

HBAR/USDT ( Congrats 26% down From our Entry )#HBAR/USDT Technical Analysis:-
As per my analysis of the HBAR/USDT chart, HBAR is currently trading at a support level of $0.058. However, it has experienced a significant drop of 26% from our previous level. I hope that you have saved money and earned profits.
Considering the global scenario, it does not seem favorable. Therefore, it is advisable to be prepared with your position and take short positions to secure your profits.
In my analysis, if HBAR manages to hold its current support level of $0.058, we might witness an upward rally. However, there is a possibility of another dump towards the $0.044 level.
If you plan to open a long position, it is recommended to set a stop-loss at $0.054. In the long term, HBAR seems bullish, so you can take advantage of every big dip to grab HBAR.
The support levels for HBAR/USDT are at $0.058 and $0.044, while the resistance levels are at $0.074 and $0.090.
If you find this content and analysis helpful, please like and share it. For the latest crypto real-time updates, do follow me.
Thank you.

HBAR ANALYSIS 15mAnalysis
HBAR/USDT/Perpetual/BYbit/15M
In this time frame, the price chart has an upward trend line and also witnesses the technical pattern
Bearish Flag
Are.
This pattern is capable of reversing the process.
If the price is lower than 0.236 fibonacci and its uptrend line, the price correction scenario will be activated and we will expect the price to be modified to 0.5 and 0.618 fibonacci, which is a support range for this penis.
Price goals:
0.06461 - 0.06279 - 0.06124

HBAR: Pullback in UptrendHedera Hashgraph (HBAR) technical analysis:
Trade setup : Price was rejected at $0.10 and broke out of Descending Triangle (bearish) below $0.08 support. Pullback to $0.06 support and 200-day moving average and could serve as an attractive swing entry area.
Trend : Downtrend on Short-Term basis, Neutral on Medium-Term basis and Uptrend on Long-Term basis.
Momentum is Bearish but inflecting. MACD Line is below MACD Signal Line and RSI is below 45 but momentum may have bottomed since MACD Histogram bars are rising, which suggests that momentum could be nearing another upswing.
Support and Resistance : Nearest Support Zone is $0.06, then $0.04. The nearest Resistance Zone is $0.08, then $0.10.

HBAR Short to ImbalanceThis has rallied a bit too much, and has hit a psychological number of 0.9786, just shy of TP's at 0.99 probably.
Shooting star 4h candle also.

HBAR/USDT 1D goes southThe HBAR token is headed for $0.06.
This is the 0.382 Fibonacci level.
Possible further sale of this cryptocurrency.
BYBIT:HBARUSDT.P

HBAR MC Vs HBAR PriceUse this relationship chart to analyze effects of additional coin dilution and dislocations in price/mc


HBAR LOOKING GOOD FOR A QUICK SCALPHBAR Double Bottom on 15 minutes time frame on 1 hour chart price is moving in descending channel

possible reversal scenariobullish crab pattern + RSI divergence + breakout of falling channek
PS : never risk more than 2% of your capital per trade
HBAR/USDT Analysis, LONG!HBAR has an upward divergence with RSI and it is in the demand zone. I expect the price to rise from this area.
I am Buying!

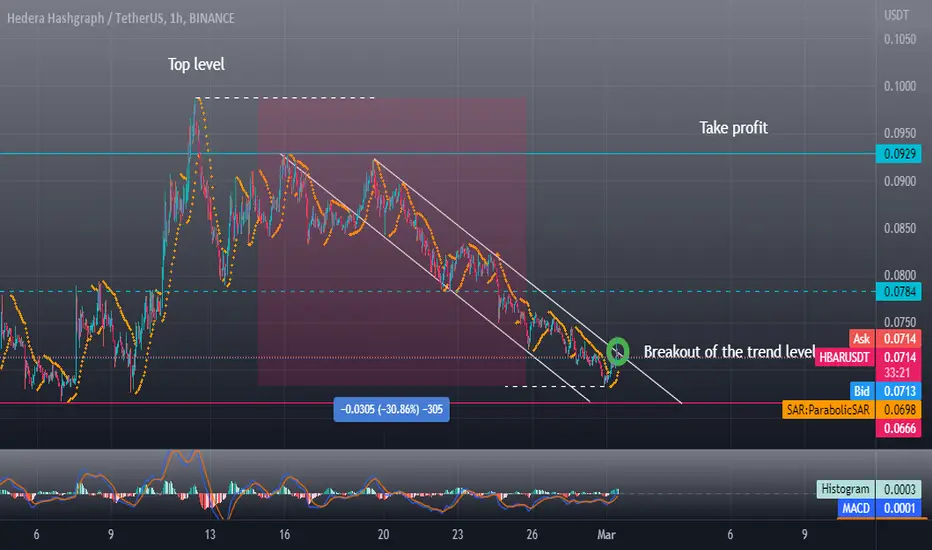
HederaCryptocurrency Hedera, after a strong movement and reaching a local maximum, made a correction of about 30%. The chart shows a descending channel and a breakout of the trend resistance level. Where the price is near the support level. This situation gives a signal about opening a long position. Moreover, the trend indicator Parabolic Sar began to show an uptrend. Regarding the MACD indicator, it is clearly seen that the asset has been going below the zero line for a long time and expresses the oversold market in the lower periods. Where buyers are most likely to appear. Moreover, according to the Bitcoin chart that sets the market trend, you can see that a new growth cycle has begun, which proportionally coincides with the last two cycles of growth and decline (This trading signal is on my page). Therefore, most likely we have a good entry point!
#HBAR/USDT Technical Analysis: Bullish Long-Term Outlook HBAR Technical Analysis: Bullish Long-Term Outlook Despite Short-Term Correction Expected:-
Based on the technical analysis, HBAR is currently trading at $0.072, representing a 100% gain from the recent bottom and a 170% increase from the previous low within the last two months. However, the chart indicates that $0.1 is a strong resistance level, and there is strong rejection from this level.
Furthermore, today marks the unlocking of 3 billion HBAR tokens, which could be perceived as negative news for current holders. There is a fear that those who have been holding these tokens for a long time may sell them in the market, resulting in a further decline in HBAR's price. Therefore, it is advisable to stay away from HBAR in the coming days.
As per the technical analysis, a 15-20% correction from the current level is expected, and HBAR may test the $0.05 level in the near future. However, in the long term, the outlook for HBAR is bullish, and it is recommended to accumulate it during significant dips.
The Fib retracement level shows that the 0.618 Fib retracement support is also at the $0.05 level, which implies that there could be a bounce from that point.
The upper side targets are considered to be the resistance levels, which are $0.1, $0.177, and $0.44. On the other hand, the support levels are $0.05 and $0.037.
If you appreciate my hard work and analysis, please like, share and comment. Kindly follow me for any latest updates. Thank you.

Short therm update for #HBARUSDTIt is a short-term roadmap for $HBAR in line with the calculation of the 2023 EW strategy, and technical analysis. 📈📉
#BTC $BTC $ETH #AVAX #FTT $FTM #Holo #Sol #XRP #MANA #ADA #Kripto #Crypto #Altcoins #USDT #USDTRY

HBAR Looking Short-Term BearishChart doesn´t look really good for bulls right now. Trendline and support broken, next major support sits at 0.63

HBAR Price Prediction As Bears Try To Shift The Momentum#HBAR Trading Price:- $0.077
According to the chart, HBAR is currently trading at a high resistance level of $0.77. Based on this, I expect to see a retracement from this level, which could potentially result in a 30% retracement from the red box resistance level.
In addition, there appears to be a strong inverse head and shoulder pattern forming on the weekly time frame, which is a bullish indicator for the long-term. However, it is important to note that this will only be valid if there is a breakout above the red neck line resistance area.
If the breakout is successful, the minimum target could potentially be a 128% increase, which would equate to around $0.2. However, it is important to exercise caution, as if the green box support is broken, there is the possibility of seeing another new low/bottom.
Key levels to keep an eye on include support at $0.055/$0.031 and resistance at $0.086/$0.2.
If you appreciate my analysis, please like and share it. Also, don't forget to follow me for more high-quality updates. Thank you.
