HBARUSDT trade ideas

HBAR LOOKING GOOD FOR A QUICK SCALPHBAR Double Bottom on 15 minutes time frame on 1 hour chart price is moving in descending channel

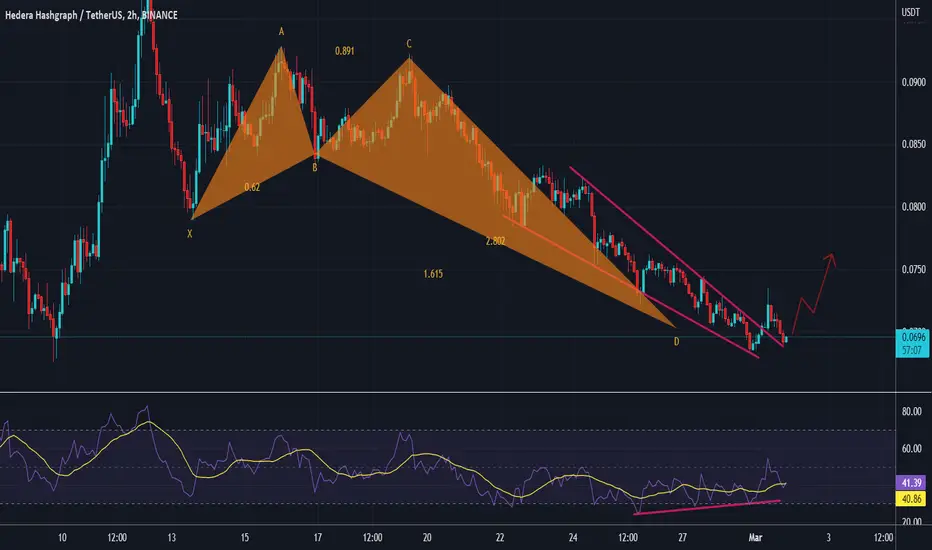
possible reversal scenariobullish crab pattern + RSI divergence + breakout of falling channek
PS : never risk more than 2% of your capital per trade
HBAR/USDT Analysis, LONG!HBAR has an upward divergence with RSI and it is in the demand zone. I expect the price to rise from this area.
I am Buying!

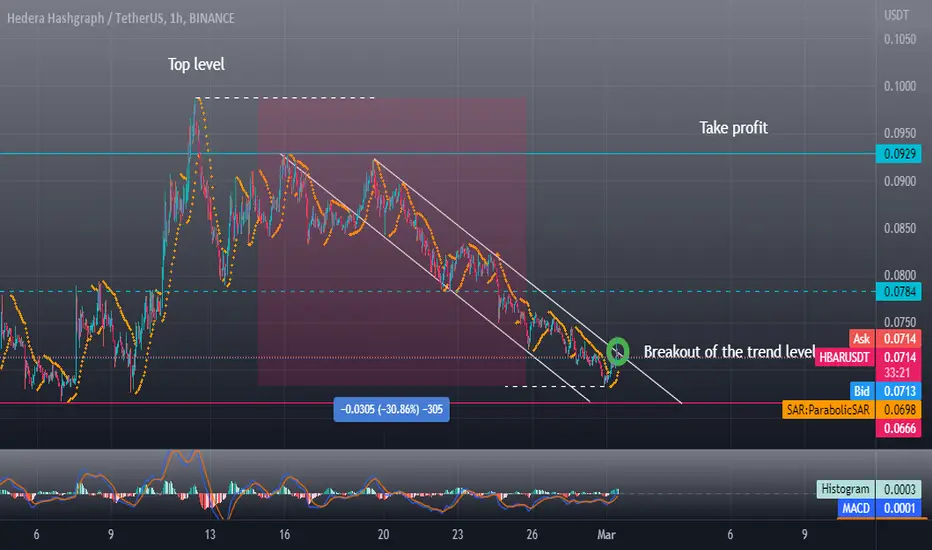
HederaCryptocurrency Hedera, after a strong movement and reaching a local maximum, made a correction of about 30%. The chart shows a descending channel and a breakout of the trend resistance level. Where the price is near the support level. This situation gives a signal about opening a long position. Moreover, the trend indicator Parabolic Sar began to show an uptrend. Regarding the MACD indicator, it is clearly seen that the asset has been going below the zero line for a long time and expresses the oversold market in the lower periods. Where buyers are most likely to appear. Moreover, according to the Bitcoin chart that sets the market trend, you can see that a new growth cycle has begun, which proportionally coincides with the last two cycles of growth and decline (This trading signal is on my page). Therefore, most likely we have a good entry point!
#HBAR/USDT Technical Analysis: Bullish Long-Term Outlook HBAR Technical Analysis: Bullish Long-Term Outlook Despite Short-Term Correction Expected:-
Based on the technical analysis, HBAR is currently trading at $0.072, representing a 100% gain from the recent bottom and a 170% increase from the previous low within the last two months. However, the chart indicates that $0.1 is a strong resistance level, and there is strong rejection from this level.
Furthermore, today marks the unlocking of 3 billion HBAR tokens, which could be perceived as negative news for current holders. There is a fear that those who have been holding these tokens for a long time may sell them in the market, resulting in a further decline in HBAR's price. Therefore, it is advisable to stay away from HBAR in the coming days.
As per the technical analysis, a 15-20% correction from the current level is expected, and HBAR may test the $0.05 level in the near future. However, in the long term, the outlook for HBAR is bullish, and it is recommended to accumulate it during significant dips.
The Fib retracement level shows that the 0.618 Fib retracement support is also at the $0.05 level, which implies that there could be a bounce from that point.
The upper side targets are considered to be the resistance levels, which are $0.1, $0.177, and $0.44. On the other hand, the support levels are $0.05 and $0.037.
If you appreciate my hard work and analysis, please like, share and comment. Kindly follow me for any latest updates. Thank you.

Short therm update for #HBARUSDTIt is a short-term roadmap for $HBAR in line with the calculation of the 2023 EW strategy, and technical analysis. 📈📉
#BTC $BTC $ETH #AVAX #FTT $FTM #Holo #Sol #XRP #MANA #ADA #Kripto #Crypto #Altcoins #USDT #USDTRY

HBAR Looking Short-Term BearishChart doesn´t look really good for bulls right now. Trendline and support broken, next major support sits at 0.63

HBAR Price Prediction As Bears Try To Shift The Momentum#HBAR Trading Price:- $0.077
According to the chart, HBAR is currently trading at a high resistance level of $0.77. Based on this, I expect to see a retracement from this level, which could potentially result in a 30% retracement from the red box resistance level.
In addition, there appears to be a strong inverse head and shoulder pattern forming on the weekly time frame, which is a bullish indicator for the long-term. However, it is important to note that this will only be valid if there is a breakout above the red neck line resistance area.
If the breakout is successful, the minimum target could potentially be a 128% increase, which would equate to around $0.2. However, it is important to exercise caution, as if the green box support is broken, there is the possibility of seeing another new low/bottom.
Key levels to keep an eye on include support at $0.055/$0.031 and resistance at $0.086/$0.2.
If you appreciate my analysis, please like and share it. Also, don't forget to follow me for more high-quality updates. Thank you.

Short-HBARUSDTBearish indications:
LLLH
Bounce from resistance.
Evening star/Bearish engulfer candle from resistance.
AB=CD pattern projection.
Trade Plan short @0.0799-0.0789
SL 0.0841
TP1:0.0737
TP2:0.0724

Fast long on HBARFast long on HBARUSDT. The idea that we brake small down trend and after test low will move up for generate new small up trend. Will see..

HBAR LONG loadingThe three long possibilities for HBARUSDT. Its taking off from either of the demand zones

hbar golden cross hours awayhbar has been looking toward higher targets with the 50 ma approaching the 200 it is just the catalyst that will push it


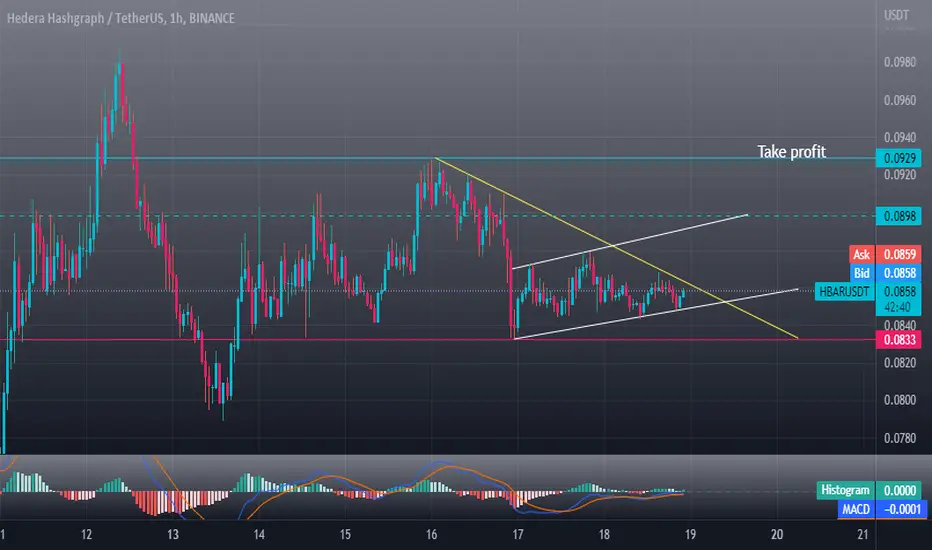
HederaCryptocurrency Hedera has shown tremendous growth during the rally earlier this year. And even when Bitcoin did its correction, this cryptocurrency was at its peak. Now, during the next exit of Bitcoin to the maximum, Hedera, on the contrary, accumulates the price near the support level. Also, now the price is under the trend resistance level and is preparing to make a breakdown. After which, most likely, we will see high volatility on growth in the short term.
$HBAR looks ready to rise$HBAR is getting strong reaction from 0.840 levels. MACD is about to give a buy signal in 4H. I am waiting for an uptrend with the RSI crossing the 50 level in 4H. My TP target is 0.1040

Keep Your Eyes on HBAR#HBAR appears to be heading towards a retest of its trendline in the next hour on the 1-hour timeframe, which could result in a potential bounce if everything goes as expected. However, it's important to keep an eye on the trendline as a break below it could signal a bearish trend.

A break of static resistance is not yet confirmedWe saw that the resistance of the $0.080 to $0.085 range was broken. Importantly, resistance has been placed above this level in the $0.10 range, temporarily blocking HBAR price from further growth.
Therefore, the strong negative reaction that has been observed in the past few days can cause the price to enter the range trend this week.
The resistance support levels drawn on the chart can be considered reactive and important ranges, which can be used for short-term trades in case of the formation of return patterns in the low times.
Also, as long as the bottom of the channel is not broken, there is a potential for the trend to remain bullish in the 4-hour timeframe. A break of static resistance is not yet confirmed and requires daily candles to stabilize above this level.

HBAR taking out ShortsA retest of Preliminary Supply may well be in order next; an ABC correction to fill whale shorts.
HBAR has also been heavily shorted, so shorts need to be cleared before the drop.

HBARUSDT IDEAHBARUSD HBARUSDT
✅ ✅ Risk warning, disclaimer: the above is a personal market judgment and analysis based on published information and historical chart data on The trading view,
And only some of these analyzes are my actual real trades.
I hope Traders consider I am Not responsible for your trades and investment decision.

HBAR 200%+ if we we hold .028c .104 is target within 90 daysNot financial advice.
Trade idea moving forward.
Try to make your buys as close to .028 as possible but DCA your buys
Staying over .028 we have a target of .104 moving forward for next 90 days.
So we have a good consolidation range here to still feel comfortable DCA into your buys
The trendline you see on the STOCH RSI is derived from the the monthly charts and currently we broke out of the monthly trend line for RsI and it's flat and ready for a move.
These targets come from a 3 month charts where .028 is lowest we should hypothetically go and as high as .13c but .10c is realistic.
#PIK
Patience is Key
#TLAW
Think Like A Whale

Bullish HBARNot much to write. All crypto is finishing impulses up which started month ago. After correction is is going to be another one. But do not think it is going for new ATH.

HBARUSDTHi friends
I think we have reached an important demand area and there is potential for further growth.
