The probability of a 120% growth in HBARUSDTThis currency has the potential and readiness for a good upward trend, and purchases can be made in stages. And profits of up to 120% can be made up to the set targets.
HBARUSDT trade ideas

HBAR Approaching Green Support Level 🚨 HBAR Approaching Green Support Level 🚨
HBAR is nearing a significant green support level. This area could provide a potential bounce and a good entry point for a long position. Wait for confirmation of support before entering the trade.
📈 Technical Overview:
Support Level: Green zone.
Potential Entry: Long position upon confirmation of support at the green zone.
HBARUSDT 1D#HBAR has broken above the falling wedge pattern on the daily chart and now is facing the EMA100. In case of a breakout, the targets are:
🎯 $0.23313
🎯 $0.26658
🎯 $0.30002
🎯 $0.34762
⚠️ Use a tight stop-loss.

HBAR/USDT Analysis: Joining the Longs!
We previously shared a setup for this coin, which played out nicely (link attached below). At this point, the trend has broken to the upside across almost all higher timeframes.
Below the current price, we have two strong volume zones at $0.189–$0.18 and $0.174–$0.165. If the price pulls back into these areas, we’ll be looking to join the long side.

HBAR I Monthly CLS, KL - FVG I Model 1, TP1 - 50% CLSHey, Market Warriors, here is another outlook on this instrument
If you’ve been following me, you already know every setup you see is built around a CLS range, a Key Level, Liquidity and a specific execution model.
If you haven't followed me yet, start now.
My trading system is completely mechanical — designed to remove emotions, opinions, and impulsive decisions. No messy diagonal lines. No random drawings. Just clarity, structure, and execution.
🧩 What is CLS?
CLS is real smart money — the combined power of major investment banks and central banks moving over 6.5 trillion dollars a day. Understanding their operations is key to markets.
✅ Understanding the behaviour of CLS allows you to position yourself with the giants during the market manipulations — leading to buying lows and selling highs - cleaner entries, clearer exits, and consistent profits.
🛡️ Models 1 and 2:
From my posts, you can learn two core execution models.
They are the backbone of how I trade and how my students are trained.
📍 Model 1
is right after the manipulation of the CLS candle when CIOD occurs, and we are targeting 50% of the CLS range. H4 CLS ranges supported by HTF go straight to the opposing range.
📍 Model 2
occurs in the specific market sequence when CLS smart money needs to re-accumulate more positions, and we are looking to find a key level around 61.8 fib retracement and target the opposing side of the range.
👍 Hit like if you find this analysis helpful, and don't hesitate to comment with your opinions, charts or any questions.
Disclosure: I am part of Trade Nation's Influencer program and receive a monthly fee for using their TradingView charts in my analysis.
⚔️ Listen Carefully:
Analysis is not trading. Right now, this platform is full of gurus" trying to sell you dreams based on analysis with arrows while they don't even have the skill to trade themselves.
If you’re ever thinking about buying a Trading Course or Signals from anyone. Always demand a verified track record. It takes less than five minutes to connect 3rd third-party verification tool and link to the widget to his signature.
"Adapt what is useful, reject what is useless, and add what is specifically your own."
— David Perk aka Dave FX Hunter ⚔️

HBAR at Critical Resistance — Will the Downtrend Continue?The high time frame structure for HBAR remains clearly bearish. Price action has been following a consistent pattern of lower highs and lower lows. The last major swing high formed when price tapped into the point of control and 0.618 Fibonacci retracement—exactly where HBAR is now
Key Points:
- HBAR is testing the same confluence zone (Point of Control + 0.618 Fibonacci) where the last macro lower high was established.
- Current price action shows no daily candle closes above resistance and volume remains below average.
HBAR is trading at a major resistance zone, showing striking similarities to the previous macro lower high that led to a breakd

$HBAR Near Key Resistance: Will the Bull Flag Explode?CRYPTOCAP:HBAR is trading within a bull flag on the 2-day chart, holding just below a key resistance zone that was previously support. The 100 EMA is also acting as a dynamic barrier here.
A breakout above $0.188 with strong volume could trigger the next bullish leg.
But if resistance holds, a short-term pullback might follow.
DYOR, NFA

Hbar Scalp short to $0.172Time sensitive
Just hopped into HBAR short. Anticipating further fall down to $0.172 now leading into new york session.
Daily Trend is bullish but correcting a bit to the downside.

HBAR/USDT HEAD AND SHOULDER PATTERN [BULLISH]Chart pattern HBAR/USDT showing head and shoulder pattern which mean bullish pattern. currently now on going for retest.

#HBAR Current Setup Showing Warning Signs | What's Next?Yello Paradisers! Is #HBAR teasing one last move up before everything collapses? Let’s break down what this suspicious structure on #Hedera is telling us:
💎#HBAR is currently trading at $0.183, sitting just beneath a heavy resistance zone around $0.190–$0.200. Price has been unfolding inside a clear Ending Diagonal structure—one of the most deceptive patterns in technical analysis. Wave 5 is still technically in play, but momentum indicators and volume behavior are telling a different story.
💎Volume has been steadily declining even as the price has been climbing, which is never a good sign this deep into a wedge pattern. On top of that, the RSI is pushing into overbought territory, showing that buyers are pushing the market higher, but with weakening strength behind them.
💎The resistance zone above current price is absolutely key. If #HBARUSD manages to break above the red zone and sustain momentum above $0.200, this would invalidate the current bearish setup and could open the door for an impulsive extension toward $0.220 and even higher. However, that scenario currently remains the less likely one unless we see a clear and strong breakout above the zone backed by volume.
💎Until then, bears are in control of the probabilities. The market structure favors a reversal from the Ending Diagonal, and if that plays out, the move could unfold quickly. First, we’ll be watching how price reacts at $0.142, which is the first major support and likely target if the wedge breaks down. A confirmed close below that level would likely lead to a continuation of the drop, with the next strong support zone near $0.125. This area has acted as a solid demand level previously and is also the region where the Volume Profile starts to spike again.
Play it safe, respect the structure, and let the market come to you!
MyCryptoParadise
iFeel the success🌴

#HBARUSDT Analysis — Potential Reversal📈 #HBARUSDT Analysis — Potential Reversal Underway
Published: April 23, 2025
Timeframe: 1D | Exchange: Binance
🔍 Technical Overview:
HBAR has been in a prolonged downtrend within a falling wedge pattern — a bullish reversal structure — which seems to have broken to the upside recently.
📌 Pattern Detected:
✅ Falling Wedge Breakout
This is typically a sign of trend exhaustion and early momentum shift.
🔻 Panic Level (Invalidation Zone):
📉 $0.15548 → Breakdown below this key horizontal support will invalidate the current bullish setup and may trigger a deeper dump zone toward: ⚠️ $0.12147 – High-risk capitulation area.
🎯 Trade Setup:
🟩 Entry Zone: $0.18172 (Current market price)
🟥 Stop Loss: $0.15548
🟦 Risk: ~12.95%
🟩 Take Profit Targets:
• TP1: $0.27908 (+56.24%)
• TP2: $0.39163 (Major Resistance - Full Target Zone)
🧠 Strategy Insight:
HBAR is reacting well from oversold levels, supported by wedge breakout and bullish momentum.
If BTC maintains stability, mid-cap alts like HBAR can rally sharply.
Favoring partial TP strategy to secure gains in a volatile market.
🗣 What’s next?
If we hold above $0.18 and flip $0.20 zone into support, we might start seeing higher highs formation. Key confirmation would come from reclaiming the $0.279 zone.
💬 Are we back in the early accumulation phase? HBAR bulls need to hold this breakout. Watching for confirmation above $0.20.
Please keep in mind that this is not financial advice and the purpose of these charts is to provide an idea of coin movement, not buy or sell signals. The cryptocurrency market is highly volatile and not suitable for everyone, so be aware of the potential risks before making any investment decisions. The information presented here is a personal effort and is subject to success or failure, and we welcome constructive criticism.
Good luck to all.
🙏we ask Allah reconcile and repay🙏

HBAR Falling Wedge / Bull Pennant + RSI breakout (1D)BINANCE:HBARUSDT has spent months correcting after a strong rally and is now compressing within a falling wedge — which could also be interpreted as a bull pennant.
Two Potential Scenarios
• Falling Wedge – A classic reversal setup with bullish RSI divergence and declining volume. Measured target: ~$0.335.*
• Bull Pennant – A continuation pattern formed after the late-2024 impulse. Measured target: ~$0.525.*
Early Bullish Signs
• Declining volume as the pattern developed could signal waning seller strength.
• RSI breaking out of a multi-month downtrend, and retesting the resistance as support, can be a leading signal of a subsequent price breakout.
Key Levels
• $0.050 – Multi-year demand zone.
• $0.120 – Current support + HVN* + previous S/R + 0.786 Fib.
• $0.180 – Resistance + HVN + previous S/R + 0.618 Fib.
• $0.280 – HVN + prior swing high + likely resistance.
• $0.320–$0.460 – Monthly supply zone (in place since March 2021).
• $0.335 – Falling wedge measured target (depending on breakout timing)**.
• $0.360–$0.400 – Daily sell-side order block, expect resistance.
• $0.525 – Bull pennant target (depending on breakout timing)**.
* Wedge and pennant targets are measured from the breakout point, so the actual target will vary the longer we spend within the pattern.
** HVN: High Volume Node — zones of concentrated past trading activity, reinforcing S/R relevance.
⚠️ Until a clean breakout occurs, CRYPTOCAP:HBAR remains in a compression phase and a No-Trade Zone.

HBARUSDT short selling set up
DISCLAIMER:
what I share here is just personal research, all based on my hobby and love of speculation intelligence.
The data I share does not come from financial advice.
Use controlled risk, not an invitation to buy and sell certain assets, because it all comes back to each individual.

HBAR Analysis (April 17, 2025)HBAR Analysis (April 17, 2025)
Current Price:
As of April 17, 2025, Hedera Hashgraph (HBAR) is trading at approximately $0.1617, reflecting a 1.76% increase over the past 24 hours.
⸻
📊 Technical Analysis
Price Action & Patterns:
• HBAR recently tested a key support level at $0.12516 on April 7 and has since rebounded, indicating potential bullish momentum.
• The emergence of a bullish engulfing pattern on the weekly chart suggests a possible trend reversal after a correction period.
Indicators:
• Moving Averages: Price is currently moving within a falling trend channel, signaling caution for medium-term traders.
• MACD & RSI: Improving momentum is likely, but traders should monitor these indicators closely for confirmation.
⸻
🧭 Fundamental Analysis
Adoption & Ecosystem:
• HBAR continues to gain adoption in enterprise applications, thanks to its high throughput and low fees.
Institutional Interest:
• A recent Nasdaq filing for a Spot HBAR ETF could attract institutional investment and increase liquidity.
⸻
📈 2025 Price Forecast
• Short-Term (Apr–Jun): Expected to trade between $0.13829 – $0.2073, with an average of $0.149652.
• Mid–Long Term: Projections vary from $0.25 up to $0.78, depending on adoption and market sentiment.
⸻
✅ Summary
HBAR shows early signs of a bullish reversal supported by price action and growing institutional interest. However, caution is advised due to the ongoing medium-term downtrend. Key resistance and support levels should be monitored.

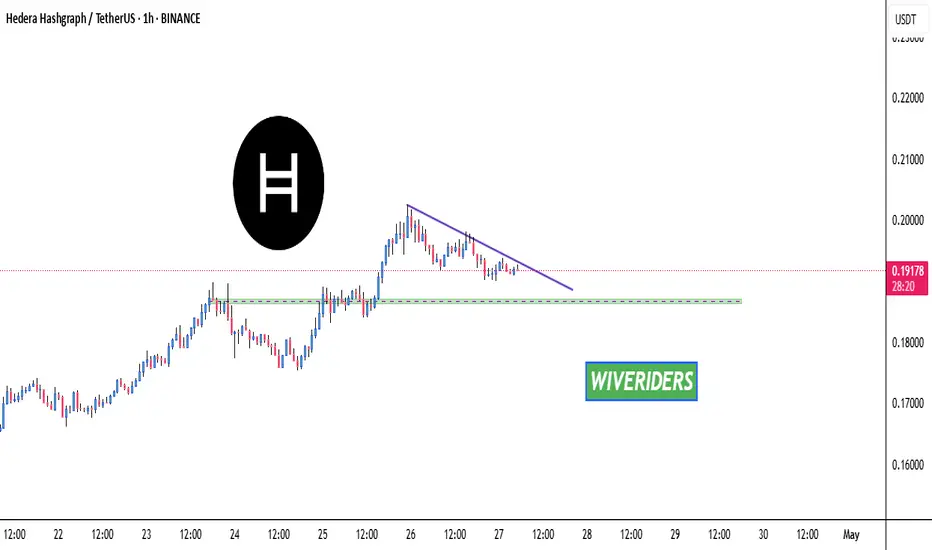
#HBAR/USDT Analysis📊 #HBAR/USDT Analysis 📊
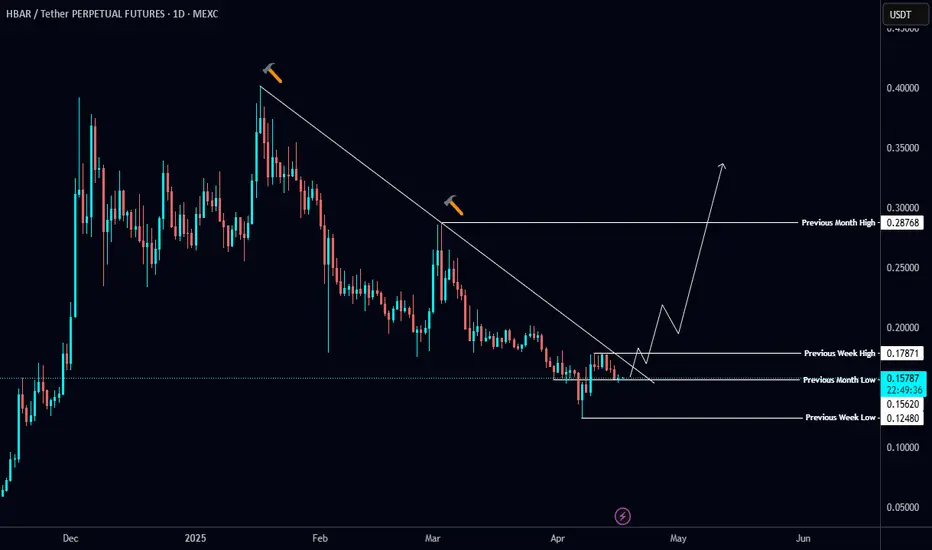
CRYPTOCAP:HBAR is holding PML $0.1562 as strong support on the Daily TF 🛡️
📈 Key Levels:
Resistance: PMH $0.28768
Support: PML $0.1562
💡 #HBARUSDT needs to break above the Trendline and retest it to confirm a bullish shift. Until then—watch and wait.
HBAR/USDT Analysis – A Solid Reversal PointThis coin has a strong volume zone between $0.155–$0.1485, where signs of a large player have been observed multiple times.
On a broader scale, we’ve already broken the short trend, so we may now continue moving toward new highs.
We’re considering a long position upon a test and reaction from the mentioned zone, with an initial target of $0.17.
This post is not financial advice.

$HBAR – Awaiting TriggerTechnically solid setup for BINANCE:HBARUSDT :
🔸 Consolidation after Nov-Dec rally at key Fibonacci support.
🔸 Local accumulation above daily OB suggests reversal strength.
🔸 Bottom structure forming, awaiting confirmation.
📈 Trade Plan:
Long entry upon strong reclaim above $0.20.
Targeting $0.28–$0.30 with momentum.
🛑 Invalidation: Drop below $0.18 with strong impulse.

HBARBYBIT:HBARUSDT.P is currently ranging. As seen on the chart, there is HTF lq stored market with the horizontal lines, I would be looking for a sweep of the lows which will fill the 4H breaker block.

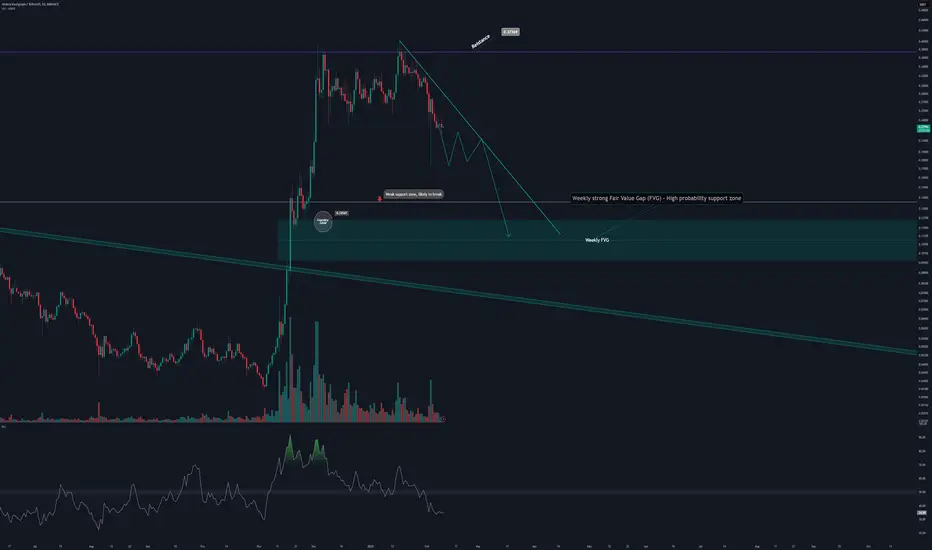
HBARUSDT Approaching Key Weekly Zone with Potential Reversal SetBINANCE:HBARUSDT HBARUSDT is approaching a weak support zone, which shows a higher probability of breaking due to insufficient strength. Below this lies a weekly strong Fair Value Gap (FVG), which is a critical level for potential price reversal and continuation of the bullish trend.
If the price enters this weekly FVG zone, it could signal a high-probability buying opportunity for traders anticipating a rebound. On the other hand, failure to hold this zone could lead to further downside.
Keep an eye on price action near the key levels for confirmation of potential entries. Always ensure to have clear stop-loss levels and realistic profit targets in place.
Best regards,
Happy trading!
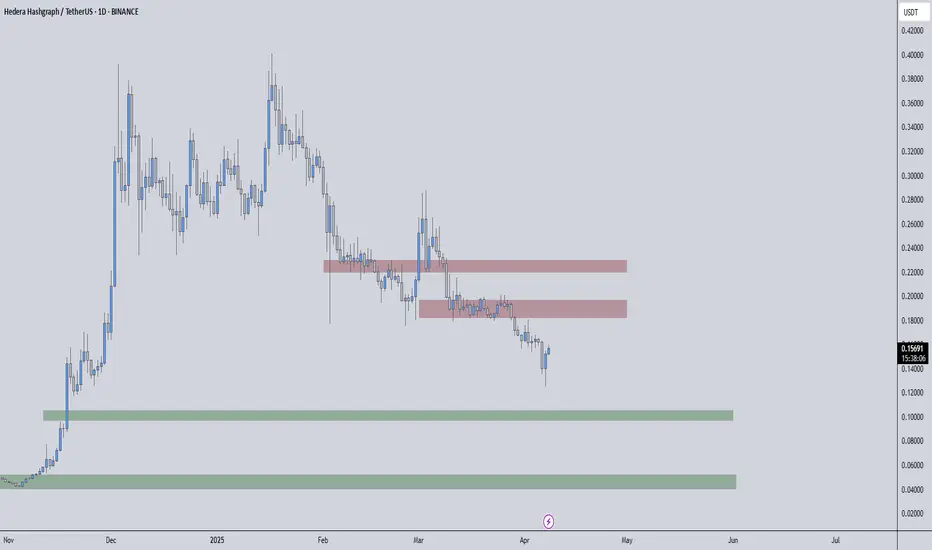
Strategic Key Zones – Trade with Confidence and PrecisionHBARUSDT is currently in a crucial setup where the red boxes represent solid resistance zones. These areas have historically proven to be significant barriers for upward moves, marking where selling pressure intensifies.
Key Market Observations
• Red Boxes as Resistance:
• These levels are where the market traditionally sees strong selling pressure, setting clear ceilings on price advances.
• Green Boxes as Support Indicators:
• The first green box tends to provide temporary support, offering a cushion in case of pullbacks.
• The second green box, however, holds the potential to be a game changer—if the price retests and holds here, it could signal a strong base for a bullish reversal.
Trading Approach
• Confirmation is Crucial:
• Always wait for lower time frame signals along with clear confirmation—through volume patterns and CDV indicators—before making any entries.
• This disciplined method ensures that you trade only when the market validates the setup.
• Risk Management is Key:
• Trade with precision and protect your capital by acting on confirmed signals rather than emotions.
• Adjust your positions based on whether the resistance holds or if a breakout occurs, and never overexpose your portfolio to any single move.
Why Follow This Analysis?
I operate with a level of expertise and professionalism that sets me apart in this market. Every level is carefully analyzed, and my high success rate is a direct result of these proven strategies. Most traders struggle because they act on guesses, but my approach is built on decades of refined experience and data-driven confirmation. If you’re serious about trading, you need to follow insights that work—insights that have been time-tested and consistently deliver results.
Trust the process, stay disciplined, and always trade with precision. Follow these updates closely and trade smartly to ensure that you stay ahead of the market trends.
📌I keep my charts clean and simple because I believe clarity leads to better decisions.
📌My approach is built on years of experience and a solid track record. I don’t claim to know it all but I’m confident in my ability to spot high-probability setups.
📌If you would like to learn how to use the heatmap, cumulative volume delta and volume footprint techniques that I use below to determine very accurate demand regions, you can send me a private message. I help anyone who wants it completely free of charge.
🔑I have a long list of my proven technique below:
🎯 ZENUSDT.P: Patience & Profitability | %230 Reaction from the Sniper Entry
🐶 DOGEUSDT.P: Next Move
🎨 RENDERUSDT.P: Opportunity of the Month
💎 ETHUSDT.P: Where to Retrace
🟢 BNBUSDT.P: Potential Surge
📊 BTC Dominance: Reaction Zone
🌊 WAVESUSDT.P: Demand Zone Potential
🟣 UNIUSDT.P: Long-Term Trade
🔵 XRPUSDT.P: Entry Zones
🔗 LINKUSDT.P: Follow The River
📈 BTCUSDT.P: Two Key Demand Zones
🟩 POLUSDT: Bullish Momentum
🌟 PENDLEUSDT.P: Where Opportunity Meets Precision
🔥 BTCUSDT.P: Liquidation of Highly Leveraged Longs
🌊 SOLUSDT.P: SOL's Dip - Your Opportunity
🐸 1000PEPEUSDT.P: Prime Bounce Zone Unlocked
🚀 ETHUSDT.P: Set to Explode - Don't Miss This Game Changer
🤖 IQUSDT: Smart Plan
⚡️ PONDUSDT: A Trade Not Taken Is Better Than a Losing One
💼 STMXUSDT: 2 Buying Areas
🐢 TURBOUSDT: Buy Zones and Buyer Presence
🌍 ICPUSDT.P: Massive Upside Potential | Check the Trade Update For Seeing Results
🟠 IDEXUSDT: Spot Buy Area | %26 Profit if You Trade with MSB
📌 USUALUSDT: Buyers Are Active + %70 Profit in Total
🌟 FORTHUSDT: Sniper Entry +%26 Reaction
🐳 QKCUSDT: Sniper Entry +%57 Reaction
📊 BTC.D: Retest of Key Area Highly Likely
📊 XNOUSDT %80 Reaction with a Simple Blue Box!
📊 BELUSDT Amazing %120 Reaction!
I stopped adding to the list because it's kinda tiring to add 5-10 charts in every move but you can check my profile and see that it goes on..
HBAR Analysis (12H)After the bearish CH, supply zones have formed on the chart.
Currently, the price is consuming an OB. Each time this OB has been consumed, lower highs have been formed. Additionally, the number of touches on this OB has been high, meaning many orders from this OB have been absorbed.
It is expected that the price will eventually reach the lower demand zone and then react strongly to the upside.
The closure of a daily candle below the invalidation level will invalidate this analysis.
For risk management, please don't forget stop loss and capital management
When we reach the first target, save some profit and then change the stop to entry
Comment if you have any questions
Thank You

HBAR: Dare enough to long? #cleanchart #SnR #SnD#NFA
#mychartjournal
#amateursince2019
Analysed and boxed in W1 chart. D1 to check small candle and refined box's line.
In this analysis, it shows strong support and demand at the bottom box to go long (scalping?)
If you like my analysis, please "like". Thankyou and happy trading!

Hedera Hashgraph: 23% Drop to Monthly Support, Target 0.15Hello and greetings to all the crypto enthusiasts, ✌
All previous targets were nailed ✅! Now, let’s dive into a full analysis of the upcoming price potential for Hedera Hashgraph 🔍📈.
Hedera Hashgraph is forming a new parallel channel, with an expected decline of at least 23%, bringing the price to the monthly support level. A retest of this support is likely, providing a potential entry point. My price target is set at 0.15 following this phase.📚🙌
🧨 Our team's main opinion is: 🧨
Hedera Hashgraph is set to drop 23%, reaching monthly support, with a potential retest and a target of 0.15.📚🎇
Give me some energy !!
✨We invest hours crafting valuable ideas, and your support means everything—feel free to ask questions in the comments! 😊💬
Cheers, Mad Whale. 🐋
