Strategic Key Zones – Trade with Confidence and PrecisionHBARUSDT is currently in a crucial setup where the red boxes represent solid resistance zones. These areas have historically proven to be significant barriers for upward moves, marking where selling pressure intensifies.
Key Market Observations
• Red Boxes as Resistance:
• These levels are where the market traditionally sees strong selling pressure, setting clear ceilings on price advances.
• Green Boxes as Support Indicators:
• The first green box tends to provide temporary support, offering a cushion in case of pullbacks.
• The second green box, however, holds the potential to be a game changer—if the price retests and holds here, it could signal a strong base for a bullish reversal.
Trading Approach
• Confirmation is Crucial:
• Always wait for lower time frame signals along with clear confirmation—through volume patterns and CDV indicators—before making any entries.
• This disciplined method ensures that you trade only when the market validates the setup.
• Risk Management is Key:
• Trade with precision and protect your capital by acting on confirmed signals rather than emotions.
• Adjust your positions based on whether the resistance holds or if a breakout occurs, and never overexpose your portfolio to any single move.
Why Follow This Analysis?
I operate with a level of expertise and professionalism that sets me apart in this market. Every level is carefully analyzed, and my high success rate is a direct result of these proven strategies. Most traders struggle because they act on guesses, but my approach is built on decades of refined experience and data-driven confirmation. If you’re serious about trading, you need to follow insights that work—insights that have been time-tested and consistently deliver results.
Trust the process, stay disciplined, and always trade with precision. Follow these updates closely and trade smartly to ensure that you stay ahead of the market trends.
📌I keep my charts clean and simple because I believe clarity leads to better decisions.
📌My approach is built on years of experience and a solid track record. I don’t claim to know it all but I’m confident in my ability to spot high-probability setups.
📌If you would like to learn how to use the heatmap, cumulative volume delta and volume footprint techniques that I use below to determine very accurate demand regions, you can send me a private message. I help anyone who wants it completely free of charge.
🔑I have a long list of my proven technique below:
🎯 ZENUSDT.P: Patience & Profitability | %230 Reaction from the Sniper Entry
🐶 DOGEUSDT.P: Next Move
🎨 RENDERUSDT.P: Opportunity of the Month
💎 ETHUSDT.P: Where to Retrace
🟢 BNBUSDT.P: Potential Surge
📊 BTC Dominance: Reaction Zone
🌊 WAVESUSDT.P: Demand Zone Potential
🟣 UNIUSDT.P: Long-Term Trade
🔵 XRPUSDT.P: Entry Zones
🔗 LINKUSDT.P: Follow The River
📈 BTCUSDT.P: Two Key Demand Zones
🟩 POLUSDT: Bullish Momentum
🌟 PENDLEUSDT.P: Where Opportunity Meets Precision
🔥 BTCUSDT.P: Liquidation of Highly Leveraged Longs
🌊 SOLUSDT.P: SOL's Dip - Your Opportunity
🐸 1000PEPEUSDT.P: Prime Bounce Zone Unlocked
🚀 ETHUSDT.P: Set to Explode - Don't Miss This Game Changer
🤖 IQUSDT: Smart Plan
⚡️ PONDUSDT: A Trade Not Taken Is Better Than a Losing One
💼 STMXUSDT: 2 Buying Areas
🐢 TURBOUSDT: Buy Zones and Buyer Presence
🌍 ICPUSDT.P: Massive Upside Potential | Check the Trade Update For Seeing Results
🟠 IDEXUSDT: Spot Buy Area | %26 Profit if You Trade with MSB
📌 USUALUSDT: Buyers Are Active + %70 Profit in Total
🌟 FORTHUSDT: Sniper Entry +%26 Reaction
🐳 QKCUSDT: Sniper Entry +%57 Reaction
📊 BTC.D: Retest of Key Area Highly Likely
📊 XNOUSDT %80 Reaction with a Simple Blue Box!
📊 BELUSDT Amazing %120 Reaction!
I stopped adding to the list because it's kinda tiring to add 5-10 charts in every move but you can check my profile and see that it goes on..
HBARUSDT trade ideas
HBAR Analysis (12H)After the bearish CH, supply zones have formed on the chart.
Currently, the price is consuming an OB. Each time this OB has been consumed, lower highs have been formed. Additionally, the number of touches on this OB has been high, meaning many orders from this OB have been absorbed.
It is expected that the price will eventually reach the lower demand zone and then react strongly to the upside.
The closure of a daily candle below the invalidation level will invalidate this analysis.
For risk management, please don't forget stop loss and capital management
When we reach the first target, save some profit and then change the stop to entry
Comment if you have any questions
Thank You

HBAR: Dare enough to long? #cleanchart #SnR #SnD#NFA
#mychartjournal
#amateursince2019
Analysed and boxed in W1 chart. D1 to check small candle and refined box's line.
In this analysis, it shows strong support and demand at the bottom box to go long (scalping?)
If you like my analysis, please "like". Thankyou and happy trading!

Hedera Hashgraph: 23% Drop to Monthly Support, Target 0.15Hello and greetings to all the crypto enthusiasts, ✌
All previous targets were nailed ✅! Now, let’s dive into a full analysis of the upcoming price potential for Hedera Hashgraph 🔍📈.
Hedera Hashgraph is forming a new parallel channel, with an expected decline of at least 23%, bringing the price to the monthly support level. A retest of this support is likely, providing a potential entry point. My price target is set at 0.15 following this phase.📚🙌
🧨 Our team's main opinion is: 🧨
Hedera Hashgraph is set to drop 23%, reaching monthly support, with a potential retest and a target of 0.15.📚🎇
Give me some energy !!
✨We invest hours crafting valuable ideas, and your support means everything—feel free to ask questions in the comments! 😊💬
Cheers, Mad Whale. 🐋

HBAR: Double BottomI expect HBAR to be bullish from here, if btc allows it, it will also run the double bottom pattern and may see $0.18 levels, but I recommend taking profits at the first resistance. not investment advice

HBAR/USDT Long Setup🟢 HBAR/USDT Long Setup 🟢
🔹 Entry: 0.181
🔹 Take Profit: 0.273
🔹 Stop Loss: 0.16
🔹 Risk/Reward: ~4.3R
🎯 Idea:
HBAR is sitting at a key support level, showing signs of accumulation with multiple daily candle wicks rejecting the lower zones. The EMAs are stacked bearishly, but price is consolidating at a long-term demand zone, increasing the probability of a breakout.
⚡️ Bullish Triggers:
1️⃣ Multiple rejections of the 0.18 zone suggest strong demand.
2️⃣ Volume profile hints at absorption—sellers are getting exhausted.
3️⃣ A move above 0.196 could trigger momentum buyers, confirming the uptrend.
⚠️ Bearish Risks:
If BTC dumps, alts will likely follow.
Breakdown below 0.17 invalidates the setup.
Lack of volume could result in a slow grind rather than a clean breakout.
📌 Plan:
If price gains strength above 0.196, I might look to add more.
If we struggle to hold above 0.20, I’ll watch for weakness and consider trailing SL.
A clean break of 0.22 could accelerate the move towards TP.
Fingers crossed! Let's see how this plays out. 🚀

HBARUSDT 4DHBAR ~ 4D Analysis
#HBAR The next goal is very clear, this will re -test this support. buy gradually from here with a short -term target of at least 15%+

HBAR Bulls Nowhere in Sight – Where’s the Bottom?HBAR had an incredible bull run from November 2024 to mid-January 2025, rallying for 74 days and gaining +865%, moving from $0.0416 to a high of $0.40139. However, since then, the market has reversed, entering a 73 day downtrend and dropping -58% from its peak.
Now, the big question is: where is HBAR heading next? Let’s break down the key resistance and support levels and map out potential high-probability trade setups.
Current Market Structure – Bears in Control
HBAR is trading at $0.16765, just below a key low at $0.17721, which it must reclaim to show any bullish strength. Several critical resistance levels lie ahead:
🔴 $0.18 - $0.20 Zone: Previously strong support, now acting as resistance
🔴 Weekly Level at $0.18375 – A significant resistance zone
🔴 Monthly Open at $0.21352 – Bulls must reclaim this to regain momentum
🔴 Weekly 21 EMA at $0.20 & 21 SMA at $0.2348 – Price is trading below both, a bearish sign
🔴 200 EMA/SMA Lost – Another bearish indicator
🔴 0.618 Fibonacci Retracement at $0.17904 – This level was lost, further confirming the bearish trend
📉 Conclusion: As long as price remains under $0.18-$0.20, the trend remains bearish, and there is no sign of reversal yet.
Where Could HBAR Go Next? Finding the Next Support Levels
If HBAR fails to reclaim the key resistance levels, price could continue dropping toward the next major support zone. Here’s where the next support zone is:
🟢 0.786 Fibonacci Retracement at $0.1186 – A key potential target
🟢 Weekly Support at $0.1259 – Close to the 0.786 Fib level, adding confluence
🟢 Monthly Support at $0.1145 – Further strengthening this zone
🟢 Log Scale 0.5 Fib Retracement at $0.12923 – From the full bull run, adding another layer of support
🟢 21 Monthly EMA at $0.132 & 21 Monthly SMA at $0.1079 – These levels align perfectly with the other supports
🟢 Fib Channel Lower Support (April 4th - 9th) – If price drops to $0.12 during this time window, it aligns with the lower channel support line
📉 Conclusion: A strong support zone lies between $0.132 - $0.1079, where buyers could step in for a potential bounce.
Potential Trade Setups
📌 Long Setup (High Probability Reversal Zone)
Entry: DCA around $0.12
Stop Loss: Below $0.098
Target: $0.166
Potential Gain: +40%
R:R Ratio: 2:1 or better
🔹 If price regains $0.18-$0.20, we can look for long opportunities.
📌 Short Setup (For Those Already Shorting from Higher Levels)
Take Profit Target: Between $0.14 - $0.12
Stop Loss: Above $0.20
Market Outlook
With HBAR currently in a bearish trend, we have clearly defined key support and resistance zones and potential trade setups. The next few weeks will be crucial, as price either reclaims $0.18-$0.20 (bullish case) or drops further toward $0.12 (where a strong bounce could happen).
📢 Patience is key! Let the setup come to you and don’t force trades. Always manage risk properly.
What are your thoughts on HBAR’s next move? Leave a comment below! 🚀

HBAR - IS it a buy?HBAR after a long time came to its old OB and hence the move precedented! Observe for scalps as the draw showed!

HBARHBAR
March 26, 2025
7:35 AM
From a tech perspective, looks like we’re heading into the final leg ( W5 ) targeting around $0.7795, if we’re measuring it through W3 + W4. Also spotting some bullish divergence showing up on the HTF, which adds to the bias.
A couple of solid confluences here too: on the D1 TF, HBAR just bounced off the 200 MA, which is a pretty key support, and it’s also sitting right inside a daily OB. Looks like buyers are stepping in.
Q: So is it good for buying on spot?
Yeah, HBAR is a solid crypto project. I actually shared my thesis on it — you can check it out on my channel, just scroll up a bit.
Q: Is it good to long on futures?
That really depends on your style. If you're a swing trader, then maybe — but personally, I don't think HBAR is ideal for swing longs or even day trades right now. The price action on LTF is pretty choppy, and it’s not the kind of setup that suits everyone. We all have different risk tolerance levels, so make sure it aligns with yours.

HBAR next impulse down The overall chart leans bearish with no signs of a reversal yet.
Momentum analysis indicates that HBAR is likely to continue its downtrend.
TP 0.11584
SL 0.19912

Trading Idea (HBAR/USDT, 1H Chart, 23rd of MarchChart Analysis:
➤ 1) The price is still struggling below the major EMAs (20/50/100/200), indicating bearish pressure.
➤ 2) RSI is mumbling around the midline, showing a slight bullish pull but lacking strong momentum.
➤ 3) The recent small upward move hasn't broken the trend, and the EMAs are still positioned in a bearish sequence.
➤ 4) Volume remains relatively low, suggesting that buyers are not stepping in aggressively yet.
🐻 Bearish Scenario (Fakeout):
Probability: 60%:
If the price pushes above the EMA 50 (around 0.185) and gets rejected at EMA 100 or 200, we might see a sharp pullback.
💡 Entry for short: 0.187 - 0.189
✂️ Stop Loss: 0.192
🏁 Take Profit:
➣ 0.180 - TP 1
➣ 0.175 - TP 2
🐂 Bullish Scenario (Reversal):
Probability: 40%
If the price consolidates above the EMA 200 (around 0.190) with volume increasing, it could indicate a trend reversal.
💡 Entry for long: 0.192 - 0.194
✂️ Stop Loss: 0.188
🏁 Take Profit:
➣ 0.200 - TP 1
➣ 0.210 - TP 2
🚨 Stay awake, this setup is valid for the next 12 hrs. or until NY session. This is not a trading advice.

HBARUSDT Bull FlagHBARUSDT is currently forming a promising bull flag pattern on the daily chart.
Bullish Scenario:
If you're not in the trade yet, you can consider entering now for a potential long-term position, or wait for a confirmed breakout followed by a retest for added confirmation.
Bearish Scenario:
If the price breaks down from the bull flag, the next major support lies around the 800 SMA on the 8H, 12H, and daily timeframes.
!!! REMINDER !!!
Always pay attention to the signals when you're in a profitable trade. Secure your gains and consider re-entering on the next pullback.
Be Patient - Don't Panic - Trade Emotionless

HBAR ANALYSIS📊 #HBAR Analysis
✅There is a formation of Descending triangle pattern on weekly chart. Also #HBAR is trading around its low level. If the price sustains here and give a bullish move then we could expect a bullish move otherwise we would see more dip.
👀Current Price: $0.18230
⚡️What to do ?
👀Keep an eye on #HBAR price action and volume. We can trade according to the chart and make some profits⚡️⚡️
#HBAR #Cryptocurrency #TechnicalAnalysis #DYOR

Lingrid | HBARUSDT consolidation Before the ExtensionBINANCE:HBARUSDT price is currently consolidating below the psychological level at 0.2000. On the daily timeframe, it's evident that the price continues to test the support zone around 0.1700, indicating a potential breakdown of that zone and further downward movement. Additionally, the formation of an ABC corrective move suggests that the C wave may complete around the 0.1000 support level. As a result, I anticipate the market will break below this support and continue moving lower. My goal is support zone around 0.1600
Traders, If you liked this educational post🎓, give it a boost 🚀 and drop a comment 📣

HBARUSDTHBAR going long with a strategy of shark( 3 insiders bar) on the daily means we can't break the line 0.17276 and we are going on uptrend and no more downside
0.15$ Is a Next Support Area 📉 The Price Is About To Breakdown The 0.184$ Support Toward a 0.15$ Area
👉 The Zone of 0.15$ Is an Interesting Point For Buy HBAR, Will Update This Post After Reaches That Area

HBAR AnalysisSummary:
HBAR (Hedera Hashgraph) is the native cryptocurrency of the Hedera network, utilizing Hashgraph technology instead of a traditional blockchain. It is known for its high speed, low transaction fees, strong security, and energy efficiency. HBAR is widely used for smart contracts, fast payments, and enterprise-level decentralized applications (dApps).
Technical Analysis:
HBAR has shown strong resistance during recent market downturns and is currently in a consolidation phase. It has formed a well-structured setup suitable for both long and short trades.
The price is currently forming a Descending Triangle, maintaining a flat support level while making lower highs.
• After breaking the trigger level, it could move up toward the triangle’s resistance.
• There is a possibility of a trading range forming, but if the price confirms a breakout above the triangle, a bullish move may begin.
• If the price loses support and breaks downward, we could see a continuation of the bearish wave.
This setup provides clear trading opportunities depending on the direction of the breakout.

Swing Trading Plan for HBARUSD (Spot/Low Lev)Key Price Levels
The chart is annotated with color-coded horizontal zones for clarity, marking the entry, take-profit, and stop-loss levels:
Entry / DCA Range:
Price: 0.15036 to 0.17172
Color: Pink
Description: This is the primary zone to initiate a long position. You can enter at 0.15036 and scale in (using Dollar-Cost Averaging) if the price dips higher within this range, up to 0.17172.
Take-Profit Levels:
TP1:
Price: 0.22000 to 0.24000
Color: Light Green
Description: The first profit-taking zone, ideal for securing initial gains after an upward move from the entry.
TP2:
Price: 0.26000 to 0.28000
Color: Light Cyan
Description: The second target, representing a higher resistance area for partial profit-taking.
TP3:
Price: 0.32000 to 0.34000
Color: Light Yellow
Description: The final target, aligning with historical resistance and the maximum expected upside for this trade.
Stop-Loss:
Price: Below 0.11727 (range extends to 0.11500)
Color: Red
Description: This is the hard stop-loss level. A daily candle closing below 0.11727 signals an exit, with the range down to 0.11500 acting as a critical support zone.
Trading Strategy
Entry: Enter a long position within the 0.15036 to 0.17172 range. Consider adding to your position if the price moves toward the upper end of this zone to average your entry cost.
Take-Profit:
Take partial profits at TP1 (0.22000–0.24000).
Secure additional profits at TP2 (0.26000–0.28000).
Exit fully or take final profits at TP3 (0.32000–0.34000).
Stop-Loss: Place a hard stop-loss below 0.11727. Confirm the exit only if the daily candle closes below this level to avoid premature stop-outs from intraday volatility.
Trade Duration: This swing trade is expected to unfold over several weeks to months, depending on how quickly the price reaches the TP3 range.

HBAR LONGwe can see range on daily chart. We are now on the lower band where we can look for long setups. Little specaultive trade can be seen on chart.
What give the confidence in this trade?
if you look OBV is incresing specialy from prevous low the OBV value is much higher!
Tha means we have strong buying presure.
Have a nice day and Be safe ;)

$HBAR about to exploudhbar massive pump here 🔥
waiting for breakout here!
giga bullish🔥
Goodluck !
Dyor!

HBAR Update: Golden Pocket & Demand Zone WatchHey traders! 👋
Let’s dive into HBAR (Hedera), one of the most exciting projects right now. 🇺🇸 With the massive potential of this American-based company, combined with the growing buzz around the possibility of Trump’s presidency and the recent ETF approval, HBAR is definitely a coin to keep on your radar. 🚀
1️⃣ Impressive Price Surge – HBAR recently saw a significant rally, showing just how much potential this project has. The momentum is real, but the question is: Can we hold these gains?
2️⃣ Golden Pocket Support – As of now, we’re seeing price action holding at the Golden Pocket on the Fibonacci retracement. This is a critical support level, and if it holds, we might see a bounce from here to push higher. 🔄
3️⃣ Demand Zone Fill – However, there’s another scenario. We could see a deeper retracement into the demand zone, which would bring us down to the 0.786 Fibonacci level. This could be a great opportunity to buy at a better price if you’re looking to enter.
So, what’s your move? Will the Golden Pocket hold, or are we heading for a deeper retracement? 💭
Let’s hear your thoughts! Drop them in the comments below, and don’t forget to follow for more updates on HBAR and other key altcoins.
Happy trading, everyone! 💰📈
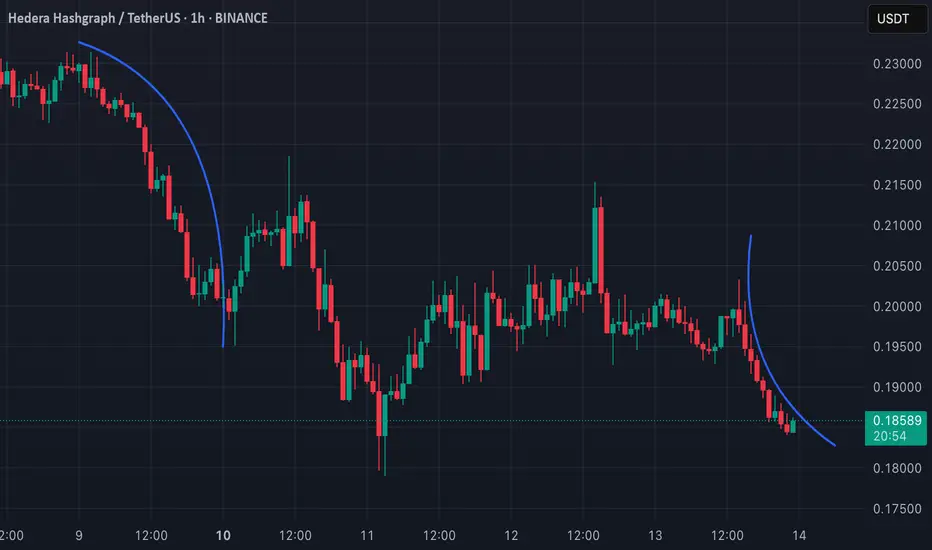
O kurwa! Curvature in Technical Analysis: What Does It Tell Us?Curvature in TA is trading approach where curved lines are used instead of traditional straight trendlines. Curved lines help to visualize how trends evolve and can provide insights into potential reversals or trend continuations.
One of the known methods that utilize curvature is the MIDAS (Market Interpretation/Data Analysis System). This system was developed by physicist Paul Levine in 1995 and uses curved support and resistance lines based on Volume-Weighted Average Price (VWAP). The curves adapt dynamically as price and volume change, helping to identify trend shifts and potential reversals.
💡 Why should we use Curvature?
Dynamic Support and Resistance: Curved lines adapt to price changes, unlike static horizontal lines.
Reversal Signals: They can signal potential trend shifts earlier than traditional methods.
Better Trend Visualization: They are particularly useful for parabolic or exponential price movements.
📊 Applying Curvature to HBAR (1H TF)
There are two curves on my chart. Both of them shows a curvature pattern forming on the 1-hour timeframe.
L: The curve on left side indicates a strong downward move, and the price appears to be following this curve closely.
R: On the other hand I have drawn curve on the right side, which is alligned as downward curve as well, but it has different angle.
This post is meant to test my theory on real life example.
🔑 Key Points:
Breaks away from the curvature could indicate a potential trend reversal or consolidation.
Combining this analysis with volume and momentum indicators can improve accuracy when predicting possible bounce or breakdown scenarios. Let's see how it works!