HEI/USDT - Higher !!showing strong bullish price action, consistently printing higher highs and higher lows with aggressive buyer pressure. The structure indicates sustained momentum, and the current consolidation above recent support suggests strength.
marked the green box as a buy zone starting from the current mark
Related pairs

HEIUSDT Forming Falling WedgeHEIUSDT is currently showing a textbook falling wedge pattern—a bullish reversal setup that often precedes sharp upside breakouts. This formation is defined by converging downward-sloping trendlines, signaling weakening selling pressure and the potential for a trend reversal. As HEI trades closer to
HEI/USDT – Bullish Breakout Confirmed, More Upside Ahead?
Date: July 19, 2025
HEI/USDT has just broken out of a prolonged accumulation phase with strong volume confirmation. The price is showing strength as it reclaims key moving averages and breaches horizontal resistance, suggesting a potential shift in trend.
🔍 Technical Overview:
Current Price: $0.

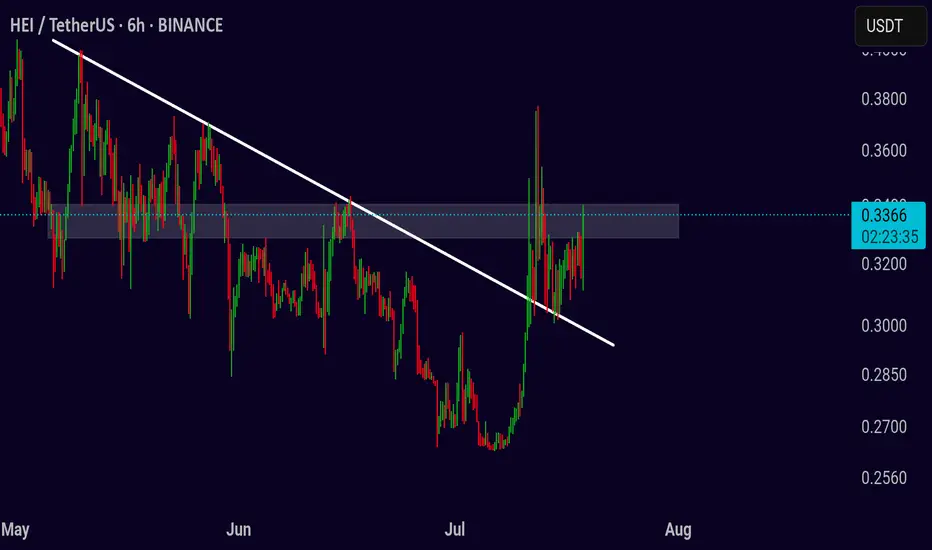
Breakout Strategy for HEI/USDT: Key Resistance TestedBreakout Strategy for HEI/USDT: Key Resistance Tested
The HEI/USDT chart is currently consolidating under a clear descending trendline, signaling a potential breakout. As price approaches this key resistance, the market is poised for a critical move. Will HEI break higher or continue lower? Let’s b
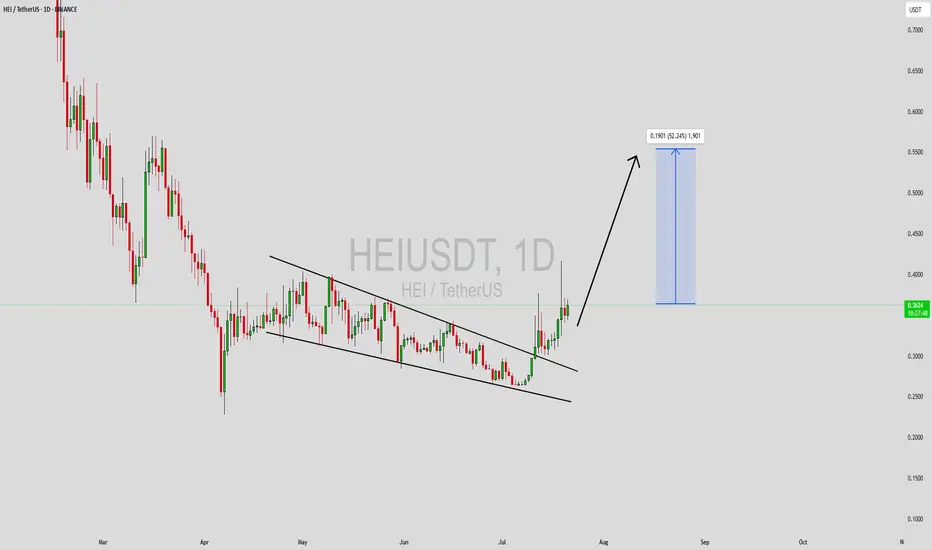
$HEIUSDT Bullish Setup.$HEI/USDT has broken out of a long-term downtrend on the daily chart.
After a successful retest, it’s showing bullish momentum with a potential 170% upside toward the $0.8000 zone.
DYOR, NFA

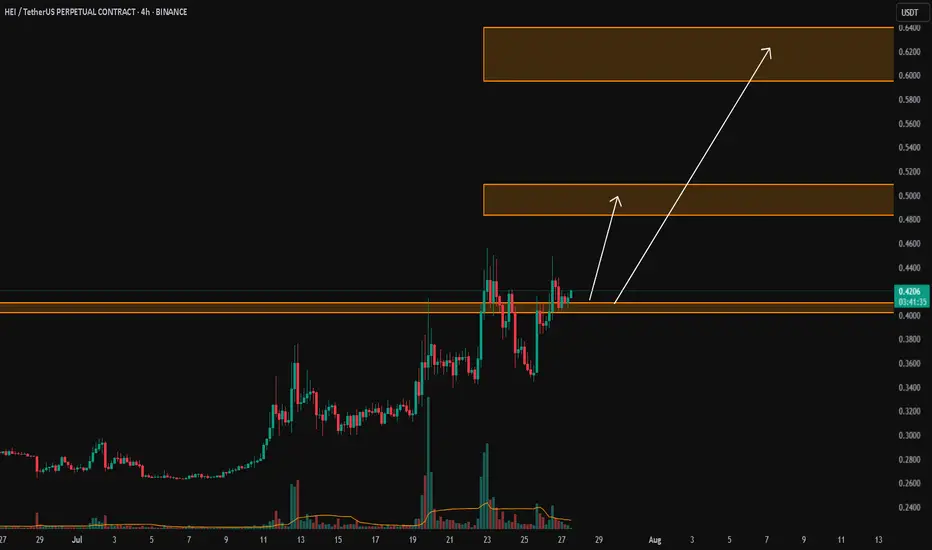
HEI/USDTKey Level Zone: 0.4020 - 0.4100
LMT v2.0 detected.
The setup looks promising—price previously trended upward with rising volume and momentum, then retested this zone cleanly. This presents an excellent reward-to-risk opportunity if momentum continues to align.
Introducing LMT (Levels & Momentum Tr
Heima Bullish Breakout, Easy 179% PP Short-Term (L-HL)The chart isn't giving us much so I will not go into technical analysis; but this is a bullish setup, one that has the potential to break-up just as Hyperlane did. If you are unaware, HYPERUSDT just grew ~200% in a matter of hours... The altcoins market is starting to heat up.
Here we have Heima, a

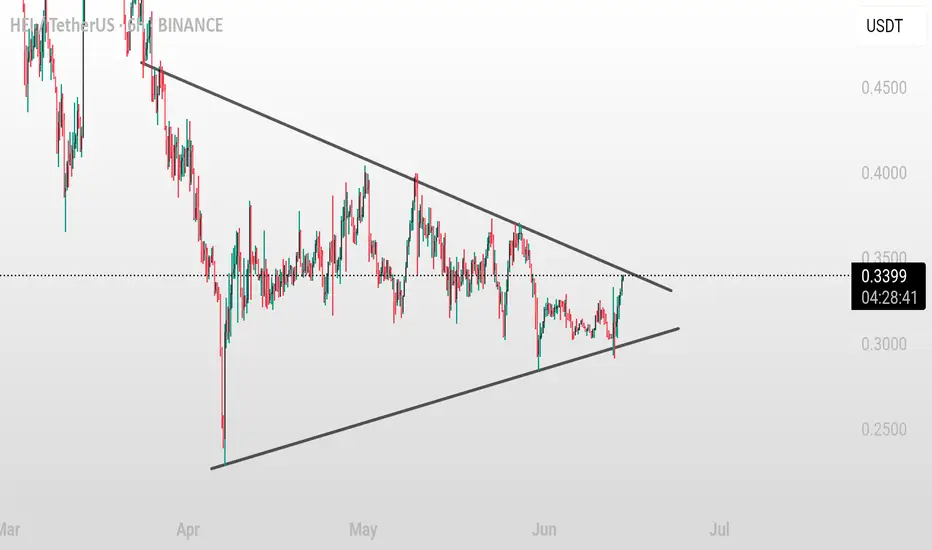
HEI/USDT – Symmetrical Triangle Squeeze Ahead of Big MovePair: HEI/USDT 💱
Timeframe: 6H ⏱️
Pattern: Symmetrical Triangle Consolidation 🔺
HEI has been coiling tightly inside a symmetrical triangle since April, with price nearing the apex. This setup usually precedes a strong breakout or breakdown. Momentum is building — a major move looks imminent 🔍🔥.
Bu
HEIUSDT Falling Wedge Pattern Targets 150%-160% Gains!HEIUSDT is currently forming a strong falling wedge pattern, a classic bullish reversal signal. The price has been consolidating within this wedge for some time, and we are now starting to see a breakout attempt with good supporting volume. This setup is gaining attention among investors who are loo

See all ideas
Summarizing what the indicators are suggesting.
Oscillators
Neutral
SellBuy
Strong sellStrong buy
Strong sellSellNeutralBuyStrong buy
Oscillators
Neutral
SellBuy
Strong sellStrong buy
Strong sellSellNeutralBuyStrong buy
Summary
Neutral
SellBuy
Strong sellStrong buy
Strong sellSellNeutralBuyStrong buy
Summary
Neutral
SellBuy
Strong sellStrong buy
Strong sellSellNeutralBuyStrong buy
Summary
Neutral
SellBuy
Strong sellStrong buy
Strong sellSellNeutralBuyStrong buy
Moving Averages
Neutral
SellBuy
Strong sellStrong buy
Strong sellSellNeutralBuyStrong buy
Moving Averages
Neutral
SellBuy
Strong sellStrong buy
Strong sellSellNeutralBuyStrong buy
Frequently Asked Questions
The current price of HEI / TetherUS (HEI) is 0.4150 USDT — it has risen 1.27% in the past 24 hours. Try placing this info into the context by checking out what coins are also gaining and losing at the moment and seeing HEI price chart.
HEI / TetherUS price has risen by 15.65% over the last week, its month performance shows a 46.08% increase, and as for the last year, HEI / TetherUS has decreased by −44.15%. See more dynamics on HEI price chart.
Keep track of coins' changes with our Crypto Coins Heatmap.
Keep track of coins' changes with our Crypto Coins Heatmap.
HEI / TetherUS (HEI) reached its highest price on Feb 13, 2025 — it amounted to 1.4900 USDT. Find more insights on the HEI price chart.
See the list of crypto gainers and choose what best fits your strategy.
See the list of crypto gainers and choose what best fits your strategy.
HEI / TetherUS (HEI) reached the lowest price of 0.2281 USDT on Apr 7, 2025. View more HEI / TetherUS dynamics on the price chart.
See the list of crypto losers to find unexpected opportunities.
See the list of crypto losers to find unexpected opportunities.
The safest choice when buying HEI is to go to a well-known crypto exchange. Some of the popular names are Binance, Coinbase, Kraken. But you'll have to find a reliable broker and create an account first. You can trade HEI right from TradingView charts — just choose a broker and connect to your account.
HEI / TetherUS (HEI) is just as reliable as any other crypto asset — this corner of the world market is highly volatile. Today, for instance, HEI / TetherUS is estimated as 8.09% volatile. The only thing it means is that you must prepare and examine all available information before making a decision. And if you're not sure about HEI / TetherUS, you can find more inspiration in our curated watchlists.
You can discuss HEI / TetherUS (HEI) with other users in our public chats, Minds or in the comments to Ideas.