$HFTUSDT Trade Setup 6H.TSX:HFT Trade Setup (6H)
• Entry: CMP
• Stop Loss: $0.0709
• Targets:
T1: $0.0929
T2: $0.1251
Bullish breakout with clean retest.
The setup looks strong if support holds.
DYOR, NFA
Related pairs

HFT/USDT NEXT LEGIn late June 2025, HFT surged over +250%, backed by strong buying interest and significant volume. Following that explosive move, the price has now corrected around 55%, currently consolidating at a key support/resistance flip zone a level that previously acted as resistance and now shows signs of h
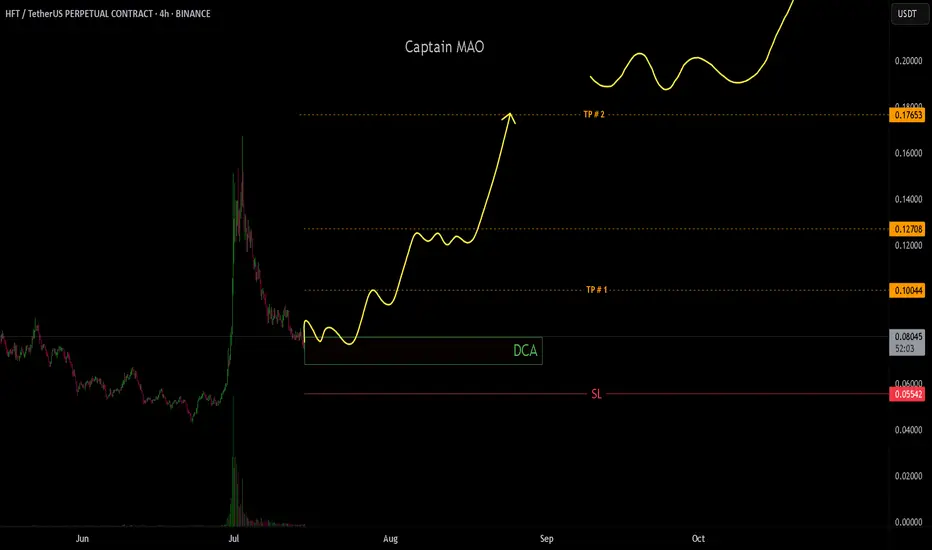
HFTUSDT UPDATE
Pattern: Falling Wedge Breakout
Current Price: \$0.0940
Target Price: \$0.1630
Target % Gain: 85.33%
Technical Analysis: HFT has broken out of a falling wedge on the 8H chart with strong bullish candles. Volume confirms the breakout, and the move above resistance suggests a potential rally toward

Phemex Analysis #93: Is it Time to Enter Hashflow (HFT)?Hashflow ( PHEMEX:HFTUSDT.P ) is a decentralized trading protocol designed to facilitate seamless, secure cross-chain asset swaps with zero slippage and protection against MEV (Maximal Extractable Value) exploits. Unlike traditional decentralized exchanges, Hashflow enables users to trade across v

Hashflow Hits Bottom... Notice The Waves... The Large Bull RunNotice the waves... It all starts in January 2023 with a strong advance. 243% total growth. Mid-February 2023 we have a price peak and this signals the start of a bearish trend. Notice the waves...
It all starts with a large wave. As the downtrend unravels, the waves become smaller. Then we have a

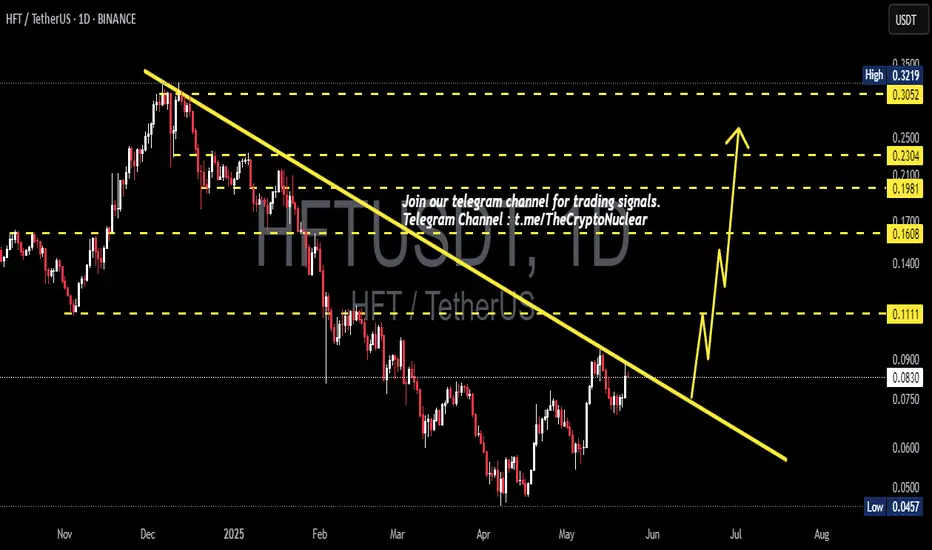
HFTUSDT Forming Falling WedgeHFTUSDT is currently displaying a textbook Falling Wedge Pattern, a classic signal that often points to an upcoming bullish reversal. This pattern is one of the most reliable in technical analysis, as it indicates that sellers are gradually losing momentum and buyers could soon step in to push price

HFTUSDT 1D AnalysisHFT ~ 1D Analysis
#HFT Buy after successfully breaking through this resistance line if you still have confidence in this coin with a short-term target of at least 10%+.
HFTUSDT | One of Today’s Top Volume Gainers – +380% in 24hHFTUSDT has exploded in volume today, surging nearly 380% as smart money piled in. When you spot a move like this, it demands attention—but winning traders wait for structure, not hype.
🔵 Why the Blue Boxes Matter
Key Support Zones: The blue boxes mark areas where buyers have historically stepped i


HFT 1W chartTSX:HFT 1W linear chart
I’m still holding my bag and I really like this Falling Wedge
Expecting a huge breakout soon

See all ideas
Summarizing what the indicators are suggesting.
Oscillators
Neutral
SellBuy
Strong sellStrong buy
Strong sellSellNeutralBuyStrong buy
Oscillators
Neutral
SellBuy
Strong sellStrong buy
Strong sellSellNeutralBuyStrong buy
Summary
Neutral
SellBuy
Strong sellStrong buy
Strong sellSellNeutralBuyStrong buy
Summary
Neutral
SellBuy
Strong sellStrong buy
Strong sellSellNeutralBuyStrong buy
Summary
Neutral
SellBuy
Strong sellStrong buy
Strong sellSellNeutralBuyStrong buy
Moving Averages
Neutral
SellBuy
Strong sellStrong buy
Strong sellSellNeutralBuyStrong buy
Moving Averages
Neutral
SellBuy
Strong sellStrong buy
Strong sellSellNeutralBuyStrong buy
Displays a symbol's price movements over previous years to identify recurring trends.
Frequently Asked Questions
The current price of HFT / TetherUS (HFT) is 0.0859 USDT — it has risen 3.66% in the past 24 hours. Try placing this info into the context by checking out what coins are also gaining and losing at the moment and seeing HFT price chart.
HFT / TetherUS price has risen by 11.72% over the last week, its month performance shows a 79.62% increase, and as for the last year, HFT / TetherUS has decreased by −56.02%. See more dynamics on HFT price chart.
Keep track of coins' changes with our Crypto Coins Heatmap.
Keep track of coins' changes with our Crypto Coins Heatmap.
HFT / TetherUS (HFT) reached its highest price on Nov 7, 2022 — it amounted to 35.0000 USDT. Find more insights on the HFT price chart.
See the list of crypto gainers and choose what best fits your strategy.
See the list of crypto gainers and choose what best fits your strategy.
HFT / TetherUS (HFT) reached the lowest price of 0.0431 USDT on Jun 22, 2025. View more HFT / TetherUS dynamics on the price chart.
See the list of crypto losers to find unexpected opportunities.
See the list of crypto losers to find unexpected opportunities.
The safest choice when buying HFT is to go to a well-known crypto exchange. Some of the popular names are Binance, Coinbase, Kraken. But you'll have to find a reliable broker and create an account first. You can trade HFT right from TradingView charts — just choose a broker and connect to your account.
Crypto markets are famous for their volatility, so one should study all the available stats before adding crypto assets to their portfolio. Very often it's technical analysis that comes in handy. We prepared technical ratings for HFT / TetherUS (HFT): today its technical analysis shows the buy signal, and according to the 1 week rating HFT shows the neutral signal. And you'd better dig deeper and study 1 month rating too — it's sell. Find inspiration in HFT / TetherUS trading ideas and keep track of what's moving crypto markets with our crypto news feed.
HFT / TetherUS (HFT) is just as reliable as any other crypto asset — this corner of the world market is highly volatile. Today, for instance, HFT / TetherUS is estimated as 19.37% volatile. The only thing it means is that you must prepare and examine all available information before making a decision. And if you're not sure about HFT / TetherUS, you can find more inspiration in our curated watchlists.
You can discuss HFT / TetherUS (HFT) with other users in our public chats, Minds or in the comments to Ideas.