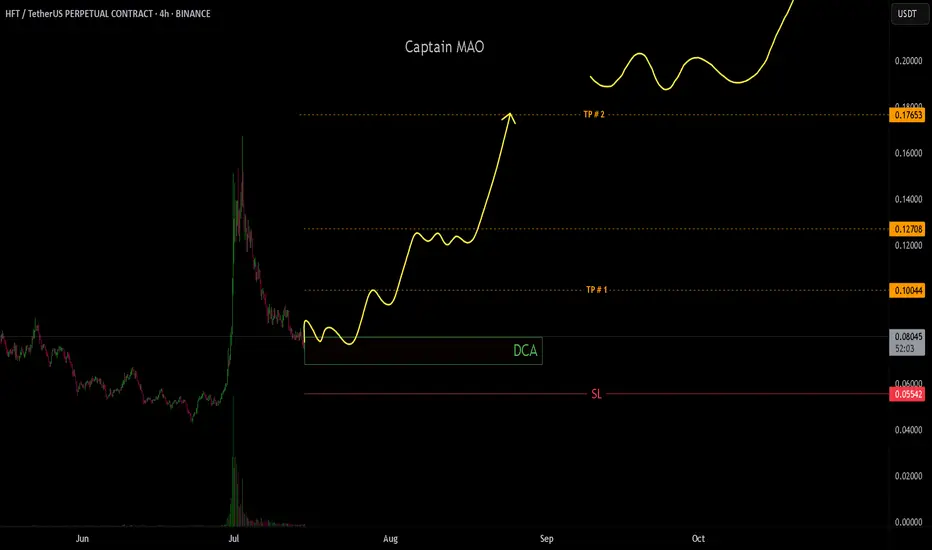
$HFTUSDT Trade Setup 6H.TSX:HFT Trade Setup (6H)
• Entry: CMP
• Stop Loss: $0.0709
• Targets:
T1: $0.0929
T2: $0.1251
Bullish breakout with clean retest.
The setup looks strong if support holds.
DYOR, NFA
HFTUSDT trade ideas

HFTUSDT UPDATE
Pattern: Falling Wedge Breakout
Current Price: \$0.0940
Target Price: \$0.1630
Target % Gain: 85.33%
Technical Analysis: HFT has broken out of a falling wedge on the 8H chart with strong bullish candles. Volume confirms the breakout, and the move above resistance suggests a potential rally toward the 85% target zone.
Time Frame: 8H

HFT/USDT NEXT LEGIn late June 2025, HFT surged over +250%, backed by strong buying interest and significant volume. Following that explosive move, the price has now corrected around 55%, currently consolidating at a key support/resistance flip zone a level that previously acted as resistance and now shows signs of holding as support.
Phemex Analysis #93: Is it Time to Enter Hashflow (HFT)?Hashflow ( PHEMEX:HFTUSDT.P ) is a decentralized trading protocol designed to facilitate seamless, secure cross-chain asset swaps with zero slippage and protection against MEV (Maximal Extractable Value) exploits. Unlike traditional decentralized exchanges, Hashflow enables users to trade across various blockchains without relying on external bridges or synthetic assets. Trades execute precisely at the quoted price without hidden commissions, enhancing transparency and efficiency.
Recently, HFT experienced an impressive bullish rally, surging approximately 190% within 48 hours, currently stabilizing around the $0.12 mark. This rapid appreciation naturally raises questions among traders: is now the ideal entry point, or is caution warranted following such sharp movements? To assist traders in making informed decisions, let's examine a few potential scenarios closely.
Possible Scenarios
1. Bullish Continuation (Positive Scenario)
Currently, the HFT price faces significant resistance around $0.15. A bullish continuation scenario involves HFT consolidating briefly above the $0.10 support area, gathering strength before making another attempt at breaking through the critical $0.15 resistance.
Pro Tips:
Entry Strategy: Consider carefully entering positions only after a confirmed breakout above the resistance at $0.15, accompanied by strong volume.
Profit-Taking Targets: Short-term profit-taking levels to monitor closely are at $0.156, $0.17, and $0.21.
Risk Management: Implement a clear stop-loss strategy slightly below the $0.10 area to mitigate potential downside risk.
2. The Hype Is Over (Bearish Scenario)
Given the broader market consolidation, there's a realistic risk that recent bullish momentum may fade quickly. If the price falls decisively below the $0.10 support, this scenario could trigger further declines towards key support levels such as $0.067, or even back down to $0.05.
Pro Tips:
Stay Cautious: Traders should remain on the sidelines if prices fall below $0.10 with increased selling volume, as it could indicate a broader sell-off.
Long-Term Accumulation: For long-term investors interested in HFT, wait patiently for price stabilization at or near support areas ($0.067 and $0.05) before gradually accumulating positions.
3. Consolidation between $0.10–$0.15 (Neutral Scenario)
A third possibility involves HFT price remaining range-bound, consolidating between the immediate support at $0.10 and resistance at $0.15. Such consolidation would represent market indecision as traders and investors await further market cues.
Pro Tips:
Range Trading: Employ range-trading techniques to profit from short-term price fluctuations between these clearly defined boundaries.
Observe Breakout Signals: Closely watch volume patterns, as increased volume accompanying a breakout from either end of the range could signify the next significant directional move.
Conclusion
Hashflow (HFT) has recently demonstrated significant volatility, creating multiple opportunities and risks for traders. By closely monitoring the outlined scenarios—particularly the critical levels of $0.10 and $0.15—and employing strategic risk management, traders can confidently position themselves to optimize potential returns. Always prioritize clear confirmation of market signals and adapt your strategies according to the unfolding price action.
🔥 Tips:
Armed Your Trading Arsenal with advanced tools like multiple watchlists, basket orders, and real-time strategy adjustments at Phemex. Our USDT-based scaled orders give you precise control over your risk, while iceberg orders provide stealthy execution.
Disclaimer: This is NOT financial or investment advice. Please conduct your own research (DYOR). Phemex is not responsible, directly or indirectly, for any damage or loss incurred or claimed to be caused by or in association with the use of or reliance on any content, goods, or services mentioned in this article.

Hashflow Hits Bottom... Notice The Waves... The Large Bull RunNotice the waves... It all starts in January 2023 with a strong advance. 243% total growth. Mid-February 2023 we have a price peak and this signals the start of a bearish trend. Notice the waves...
It all starts with a large wave. As the downtrend unravels, the waves become smaller. Then we have a medium wave and finally a small wave.
As the market hits bottom, you guessed it, 7-April 2025, there is a very strong increase in trading volume. This uptick in volume signals that the bottom is in. Once the bottom is in we can prepare for a change of trend. Long-term growth.
Now we will have the same dynamics but in reverse. First a small wave... The initial bullish breakout. Then a medium wave and finally a large wave which is the end and the bull run.
Namaste.

HFTUSDT Forming Falling WedgeHFTUSDT is currently displaying a textbook Falling Wedge Pattern, a classic signal that often points to an upcoming bullish reversal. This pattern is one of the most reliable in technical analysis, as it indicates that sellers are gradually losing momentum and buyers could soon step in to push prices higher. With good volume backing up this setup, traders are growing more confident that a breakout is on the horizon, which could fuel a strong upward rally.
The potential gain for HFTUSDT based on this pattern is estimated between 90% to 100%+, making it an attractive opportunity for swing traders and investors looking for high-risk, high-reward plays. The steady uptick in volume suggests that smart money is already accumulating positions before the anticipated breakout. When combined with the bullish pattern, this sets the stage for a price surge once the resistance line of the wedge is convincingly broken.
This setup comes at a time when the crypto market sentiment is gradually improving, with traders seeking altcoins that can outperform in the next bullish wave. HFTUSDT’s clear technical structure and growing investor interest place it among the top coins to watch closely. A confirmed breakout with strong daily closes above the wedge resistance could open the door to quick gains, rewarding early entrants who position themselves strategically.
It’s always wise to monitor volume and price action carefully when trading a Falling Wedge Pattern like this. Waiting for a confirmed breakout with increased volume can help reduce the risk of false signals and maximize profit potential. Keep HFTUSDT on your radar if you’re aiming to catch a move with solid technical backing and high potential upside.
✅ Show your support by hitting the like button and
✅ Leaving a comment below! (What is You opinion about this Coin)
Your feedback and engagement keep me inspired to share more insightful market analysis with you!

HFTUSDT 1D AnalysisHFT ~ 1D Analysis
#HFT Buy after successfully breaking through this resistance line if you still have confidence in this coin with a short-term target of at least 10%+.
HFTUSDT | One of Today’s Top Volume Gainers – +380% in 24hHFTUSDT has exploded in volume today, surging nearly 380% as smart money piled in. When you spot a move like this, it demands attention—but winning traders wait for structure, not hype.
🔵 Why the Blue Boxes Matter
Key Support Zones: The blue boxes mark areas where buyers have historically stepped in. If price dips back into these zones and holds, it often leads to meaningful bounces.
Buyer Commitment: Given today’s massive volume spike, those support levels carry extra weight. You want to see price respect these areas before considering longs.
🎯 Trading the Setup
Enter on Confirmation
• Wait for a touch of the blue box, then watch for a clean higher‑low on a lower timeframe (5m–15m).
• Look for CDV supporting the move—if cumulative delta volume confirms buyers are in control, that’s your green light.
Adapt if It Fails
• I will not insist on a bullish bias if HFTUSDT breaks below these boxes without giving a clean upward break in the low time frame—I won’t even evaluate longs.
• If price instead breaks above with volume and retests the blue box as support, I’ll shift in and target the next resistance.
Smart Risk Management
• Place your stop just below the blue box. If it doesn’t hold, you exit quickly.
• This isn’t about holding forever—capture the reaction, lock in gains, and let the market breathe.
💬 Why You Can Trust This Analysis
I share only the highest‑probability setups, backed by a track record you can verify on my profile. Most traders miss these clear signals; they chase noise while we trade with precision. When volume spikes + structure aligns, opportunity knocks—make sure you’re ready to answer.
📌I keep my charts clean and simple because I believe clarity leads to better decisions.
📌My approach is built on years of experience and a solid track record. I don’t claim to know it all but I’m confident in my ability to spot high-probability setups.
📌If you would like to learn how to use the heatmap, cumulative volume delta and volume footprint techniques that I use below to determine very accurate demand regions, you can send me a private message. I help anyone who wants it completely free of charge.
🔑I have a long list of my proven technique below:
🎯 ZENUSDT.P: Patience & Profitability | %230 Reaction from the Sniper Entry
🐶 DOGEUSDT.P: Next Move
🎨 RENDERUSDT.P: Opportunity of the Month
💎 ETHUSDT.P: Where to Retrace
🟢 BNBUSDT.P: Potential Surge
📊 BTC Dominance: Reaction Zone
🌊 WAVESUSDT.P: Demand Zone Potential
🟣 UNIUSDT.P: Long-Term Trade
🔵 XRPUSDT.P: Entry Zones
🔗 LINKUSDT.P: Follow The River
📈 BTCUSDT.P: Two Key Demand Zones
🟩 POLUSDT: Bullish Momentum
🌟 PENDLEUSDT.P: Where Opportunity Meets Precision
🔥 BTCUSDT.P: Liquidation of Highly Leveraged Longs
🌊 SOLUSDT.P: SOL's Dip - Your Opportunity
🐸 1000PEPEUSDT.P: Prime Bounce Zone Unlocked
🚀 ETHUSDT.P: Set to Explode - Don't Miss This Game Changer
🤖 IQUSDT: Smart Plan
⚡️ PONDUSDT: A Trade Not Taken Is Better Than a Losing One
💼 STMXUSDT: 2 Buying Areas
🐢 TURBOUSDT: Buy Zones and Buyer Presence
🌍 ICPUSDT.P: Massive Upside Potential | Check the Trade Update For Seeing Results
🟠 IDEXUSDT: Spot Buy Area | %26 Profit if You Trade with MSB
📌 USUALUSDT: Buyers Are Active + %70 Profit in Total
🌟 FORTHUSDT: Sniper Entry +%26 Reaction
🐳 QKCUSDT: Sniper Entry +%57 Reaction
📊 BTC.D: Retest of Key Area Highly Likely
📊 XNOUSDT %80 Reaction with a Simple Blue Box!
📊 BELUSDT Amazing %120 Reaction!
I stopped adding to the list because it's kinda tiring to add 5-10 charts in every move but you can check my profile and see that it goes on..


HFT 1W chartTSX:HFT 1W linear chart
I’m still holding my bag and I really like this Falling Wedge
Expecting a huge breakout soon

HFTUSDT Elliott Waves AnalysisHello friends.
Please support my work by clicking the LIKE button👍(If you liked).
Everything on the chart.
Entry zone: market and lower
Targets: 0.4 - 0.65 - 0.95
after first target reached move ur stop to breakeven
Stop: ~0.13 (depending of ur risk).
RR: 1 to 9
ALWAYS follow ur RM
risk is justified
It's not financial advice.
DYOR!

23.12.2024: HFT/USDT – Bullish Setup coming or More Down!?📉🚀 Bullish or Bearish on HFT/USDT? Let’s break it down!
Key Levels:
🔼 Resistance:
$0.30–$0.40: Tough resistance zone and below key EMAs. Breaking this could start a strong move up.
🔽 Support:
$0.195: Critical support right now. Losing this could send us back to $0.10–$0.15 (ouch!).
What’s Happening?
HFT is trading below all major EMAs, so the overall trend is bearish. BUT there’s bullish RSI divergence – price is dropping, RSI is climbing, meaning we should be looking at a possible bounce.
On top of that, tier 1 and tier 2 players have an average entry around $0.40, and I doubt big market makers will exit at a loss. They will push the price higher to make some profit, so I’m bullish in the long term.
Target:
I believe HFT should go above $1+, especially since market makers won’t settle for less profit. $1+ aligns with profit zones and psychological levels. Until then, I’d stay bullish if we reclaim $0.40 and hold support.
Sentiment:
Right now, I’d say 60/40 bullish long term, but short term depends on holding $0.198.
What’s your opinion – are you bullish too? Let’s discuss! 🚀💎

HFTUSDT Long Setup / 2x-3x LeverageBINANCE:HFTUSDT
📈Which side you pick?
Bull or Bear
Low-risk status: 3x-4x Leverage
Mid-risk status: 5x-8x Leverage
(For beginners, I suggest low risk status)
👾Note: The setup is active but expect the uncertain phase as well. also movement lines drawn to predict future price reactions are relative and approximate.
➡️Entry Area:
Yellow zone
⚡️TP:
0.2912
0.3038
0.319
🔴SL:
0.2670
🧐The Alternate scenario:
If the price stabilizes against the direction of the position, below or above the trigger zone, the setup will be canceled.

HFT looks bullish (1D)It looks like our large diametric wave F is over and now price has entered wave E.
By maintaining the green range, it can move towards the targets.
Closing a daily candle below the invalidation level will violate this analysis
For risk management, please don't forget stop loss and capital management
Comment if you have any questions
Thank You

#HFT/USDT#HFT
The price is moving in a descending channel on the 4-hour frame
And it is sticking to it well
We have a bounce from the lower limit of the descending channel and we are now touching this support at a price of 0.1379
We have an upward trend on the RSI indicator that is about to be broken, which supports the rise
We have a trend to stabilize above the moving average 100
Entry price 0.1500
First target 0.1663
Second target 0.1793
Third target 0.1967

HFTUSDTHFT ~ 3D
#HFT trying to break out this descending pattern. Wait for this descending pattern to be successfully broken, and you can make purchases gradually. If you have Conviction on this coin.

#HFT (SPOT) entry range (0.1200- 0.1590) T.(0.3950) SL(0.1113)BINANCE:HFTUSDT
entry range (0.1200- 0.1590)
Target1 (0.2430)- Target2 (0.3060)- Target3 (0.3950)
3 Extra Targets(optional) in chart, if you like to continue in the trade with making stoploss very high.
SL .1D close below (0.1113)
*** collect the coin slowly in the entry range ***
**** #Manta ,#OMNI, #DYM, #AI, #IO, #XAI , #ACE #NFP #RAD #WLD #ORDI #BLUR #SUI #Voxel #AEVO #VITE #APE #RDNT #FLUX #NMR #VANRY #TRB #HBAR #DGB #XEC #ERN #ALT #IO #ACA #HIVE #ASTR #ARDR #PIXEL #LTO #AERGO #SCRT #ATA #HOOK #FLOW #KSM #HFT ****

HFT Looks BullishSince HFT was listed, it appears to be forming a bearish diametric.
Now it looks like wave E of this diametric is ending.
By maintaining the green range, it can move towards the targets.
The targets are clear on the chart.
Closing a daily candle below the invalidation level will violate this analysis
For risk management, please don't forget stop loss and capital management
Comment if you have any questions
Thank You

HFT Update⚠ It's not Financial Advice!
Hashflow ( TSX:HFT ) Overview and Potential
Hashflow is an innovative decentralized finance (DeFi) platform that aims to enhance the trading experience by providing seamless cross-chain liquidity and efficient trading solutions. With the increasing demand for decentralized trading protocols, Hashflow is well-positioned to capture market share due to its unique features.
Fundamentals:
Cross-Chain Liquidity: Hashflow leverages its unique technology to allow users to trade assets across different blockchains without relying on centralized exchanges, addressing a critical gap in the DeFi ecosystem.
User Experience: The platform is designed to provide a user-friendly interface that simplifies complex trading processes, thus attracting both novice and experienced traders.
Security and Efficiency: Hashflow prioritizes security through decentralized protocols, ensuring user assets are safe during transactions.
Token Unlocks:
Recent token unlocks for TSX:HFT are expected to increase liquidity and incentivize user participation in the platform. This can lead to an increase in trading volume and bolster overall platform growth. Furthermore, as more tokens become available, they could enhance governance participation and community involvement, driving the long-term sustainability of the ecosystem.
In conclusion, with its innovative solutions and upcoming token unlock events, Hashflow ( TSX:HFT ) has significant potential to become a key player in the DeFi space, attracting a diverse user base and establishing a robust market presence.
Feel free to adjust any part of it or let me know if you’d like more specific details!


HFT +500% tradeHow we can see upcoming +500% trade on BINANCE:HFTUSDT
Possible Targets and explanation idea
➡️IAP model In play. We can come back and sweep lower low from Dec 2023
➡️Dec 2023 was a perfect test 0.86 lvl
➡️Under 0.86 lvl now Buy line on Take Profit indicator
➡️Marked main stop losses which will be like a fuel for main target -0.27 zone and -0.618
Hope you enjoyed the content I created, You can support with your likes and comments this idea so more people can watch!
✅Disclaimer: Please be aware of the risks involved in trading. This idea was made for educational purposes only not for financial Investment Purposes.
---
• Look at my ideas about interesting altcoins in the related section down below ↓
• For more ideas please hit "Like" and "Follow"!

Alikze »» HFT | Support at the bottom of the descending channel🔍 Technical analysis: Support at the bottom of the descending channel
- It is moving in a downward channel in the daily and 12H time frames.
- Currently, there is demand in the area of the bottom of the descending channel and the beginning of the movement.
- Therefore, if this demand continues in the range of the green box, it can continue its growth up to 0.195 first.
- In addition, if it stabilizes at the top of the range, it will succeed so that the supply range and channel ceiling have an upward trend.
💎 Alternative scenario: if it cannot maintain the green box area and the bottom of the channel, this correction can continue up to the range of 0.0977.
»»»«««»»»«««»»»«««
Please support this idea with a LIKE and COMMENT if you find it useful and Click "Follow" on our profile if you'd like these trade ideas delivered straight to your email in the future.
Thanks for your continued support.
Best Regards,❤️
Alikze.
»»»«««»»»«««»»»«««
BINANCE:HFTUSDT

Long idea on HFT ( high risk) ok, I need to describe the damn thing, I came in, I just believe in the high season now (I will duplicate the description in coins that I will take)
