Tech shares in Hong Kong rallying....Comparing the 3067 ETF and the top 2 tech stocks of HK, Tencent and Alibaba, we can see that Tencent has broke out of its resistance zone and is rallying higher. Now, Alibaba and the ETF is playing catch up....
I have previously said that if you have limited funds, does not like or dunno how to ana
Key stats
About BLACKROCK ASSET MGMT NORTH ASIA LTD ISHARES HANG SENG TECH HKD ETF
Home page
Inception date
Sep 14, 2020
Replication method
Physical
Dividend treatment
Distributes
Income tax type
Ordinary Income
Primary advisor
BlackRock Asset Management North Asia Ltd.
ISIN
HK0000651213
The iShares Hang Seng TECH ETF seeks to track the investment results of an index composed of 30 Hong Kong-listed companies in the technology sector or with tech-enabled businesses.
Related funds
Classification
What's in the fund
Exposure type
Technology Services
Electronic Technology
Retail Trade
Consumer Durables
Stock breakdown by region
Top 10 holdings

IShares Hang Seng Tech ETF The reason I like this ETF is the exposure to the HK Tech sectors , some companies I like but may not like enough to initiate a position in them. It's share price has been hovering at the 5.77 to the 8 dollar mark , a little boring and definitely in no time to accumulate.
Refer to the list of Hol


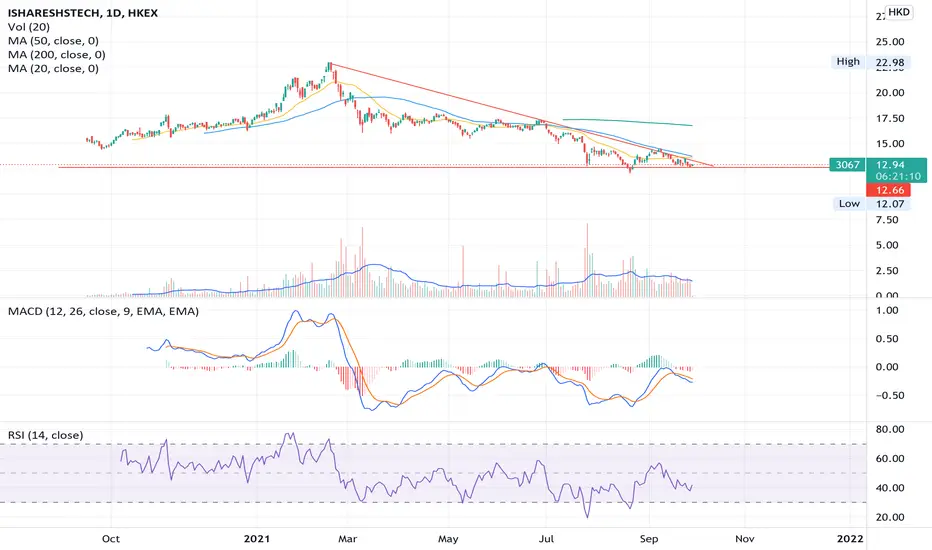
Accumulating more of 3067 ETFLooking a the weekly chart of 3067 ETF , we can see that it was down by more than 70% from its peak of 22 dollars in 22.02.21. Two years later, it has offered me a good buying opportunity.
If you see the components of this ETF, there are way too many companies that I personally would love to buy

HKEX: Possible lows in placeThere are enough evidence on the chart to show that lows may be in place.
Looking at @700(10Cents) and other Chinese stocks, it provides more evidence that we are due for a strong rally now. Time to go in.

Simple use of EMAA clear indicator of using 1 hour and 4 hour time frame with EMA has now shown a confirmation that the Chinese technology is heading back for a longer term rebound after a year of iron first.
Has the iron fist relax when the china has declared that it will only be safe after the end of year? Only t

3067 11 October 2021bullish
Please be advised that the information presented on TradingView is provided to Vantage (‘Vantage Global Limited’, ‘we’) by a third-party provider (‘Everest Fortune Group’). Please be reminded that you are solely responsible for the trading decisions on your account. There is a very high de

hk tech finding a bottom?etf might be forming a base but needs to breakthrough. would still be careful with individual names depending on their regulatory position/problems.
HK TECH ETF - Nasdaq of AsiaThis is a new ETF and you can find out more about it here .
I am excited as some of the Holdings I am already invested while others I am still awaiting a good entry to get in. This ETF will be timely for me as I see a shift of tech companies growing more aggressively in China compared to the FANG

See all ideas
Summarizing what the indicators are suggesting.
Oscillators
Neutral
SellBuy
Strong sellStrong buy
Strong sellSellNeutralBuyStrong buy
Oscillators
Neutral
SellBuy
Strong sellStrong buy
Strong sellSellNeutralBuyStrong buy
Summary
Neutral
SellBuy
Strong sellStrong buy
Strong sellSellNeutralBuyStrong buy
Summary
Neutral
SellBuy
Strong sellStrong buy
Strong sellSellNeutralBuyStrong buy
Summary
Neutral
SellBuy
Strong sellStrong buy
Strong sellSellNeutralBuyStrong buy
Moving Averages
Neutral
SellBuy
Strong sellStrong buy
Strong sellSellNeutralBuyStrong buy
Moving Averages
Neutral
SellBuy
Strong sellStrong buy
Strong sellSellNeutralBuyStrong buy
Displays a symbol's price movements over previous years to identify recurring trends.
Frequently Asked Questions
An exchange-traded fund (ETF) is a collection of assets (stocks, bonds, commodities, etc.) that track an underlying index and can be bought on an exchange like individual stocks.
3067 trades at 11.52 HKD today, its price has fallen −1.20% in the past 24 hours. Track more dynamics on 3067 price chart.
3067 net asset value is 11.69 today — it's risen 6.12% over the past month. NAV represents the total value of the fund's assets less liabilities and serves as a gauge of the fund's performance.
3067 assets under management is 21.74 B HKD. AUM is an important metric as it reflects the fund's size and can serve as a gauge of how successful the fund is in attracting investors, which, in its turn, can influence decision-making.
3067 price has risen by 2.86% over the last month, and its yearly performance shows a 63.40% increase. See more dynamics on 3067 price chart.
NAV returns, another gauge of an ETF dynamics, have risen by 6.12% over the last month, showed a 6.59% increase in three-month performance and has increased by 66.98% in a year.
NAV returns, another gauge of an ETF dynamics, have risen by 6.12% over the last month, showed a 6.59% increase in three-month performance and has increased by 66.98% in a year.
3067 fund flows account for 8.84 B HKD (1 year). Many traders use this metric to get insight into investors' sentiment and evaluate whether it's time to buy or sell the fund.
Since ETFs work like an individual stock, they can be bought and sold on exchanges (e.g. NASDAQ, NYSE, EURONEXT). As it happens with stocks, you need to select a brokerage to access trading. Explore our list of available brokers to find the one to help execute your strategies. Don't forget to do your research before getting to trading. Explore ETFs metrics in our ETF screener to find a reliable opportunity.
3067 invests in stocks. See more details in our Analysis section.
3067 expense ratio is 0.25%. It's an important metric for helping traders understand the fund's operating costs relative to assets and how expensive it would be to hold the fund.
No, 3067 isn't leveraged, meaning it doesn't use borrowings or financial derivatives to magnify the performance of the underlying assets or index it follows.
In some ways, ETFs are safe investments, but in a broader sense, they're not safer than any other asset, so it's crucial to analyze a fund before investing. But if your research gives a vague answer, you can always refer to technical analysis.
Today, 3067 technical analysis shows the neutral rating and its 1-week rating is buy. Since market conditions are prone to changes, it's worth looking a bit further into the future — according to the 1-month rating 3067 shows the strong buy signal. See more of 3067 technicals for a more comprehensive analysis.
Today, 3067 technical analysis shows the neutral rating and its 1-week rating is buy. Since market conditions are prone to changes, it's worth looking a bit further into the future — according to the 1-month rating 3067 shows the strong buy signal. See more of 3067 technicals for a more comprehensive analysis.
Yes, 3067 pays dividends to its holders with the dividend yield of 0.51%.
3067 trades at a premium (0.25%).
Premium/discount to NAV expresses the difference between the ETF’s price and its NAV value. A positive percentage indicates a premium, meaning the ETF trades at a higher price than the calculated NAV. Conversely, a negative percentage indicates a discount, suggesting the ETF trades at a lower price than NAV.
Premium/discount to NAV expresses the difference between the ETF’s price and its NAV value. A positive percentage indicates a premium, meaning the ETF trades at a higher price than the calculated NAV. Conversely, a negative percentage indicates a discount, suggesting the ETF trades at a lower price than NAV.
3067 shares are issued by BlackRock, Inc.
3067 follows the Hang Seng Tech Index. ETFs usually track some benchmark seeking to replicate its performance and guide asset selection and objectives.
The fund started trading on Sep 14, 2020.
The fund's management style is passive, meaning it's aiming to replicate the performance of the underlying index by holding assets in the same proportions as the index. The goal is to match the index's returns.