QQQ Trading Opportunity! BUY!
My dear friends,
QQQ looks like it will make a good move, and here are the details:
The market is trading on 509.27 pivot level.
Bias - Bullish
Technical Indicators: Supper Trend generates a clear long signal while Pivot Point HL is currently determining the overall Bullish trend of the market.
Goal - 514.96
About Used Indicators:
Pivot points are a great way to identify areas of support and resistance, but they work best when combined with other kinds of technical analysis
Disclosure: I am part of Trade Nation's Influencer program and receive a monthly fee for using their TradingView charts in my analysis.
———————————
WISH YOU ALL LUCK
3455 trade ideas

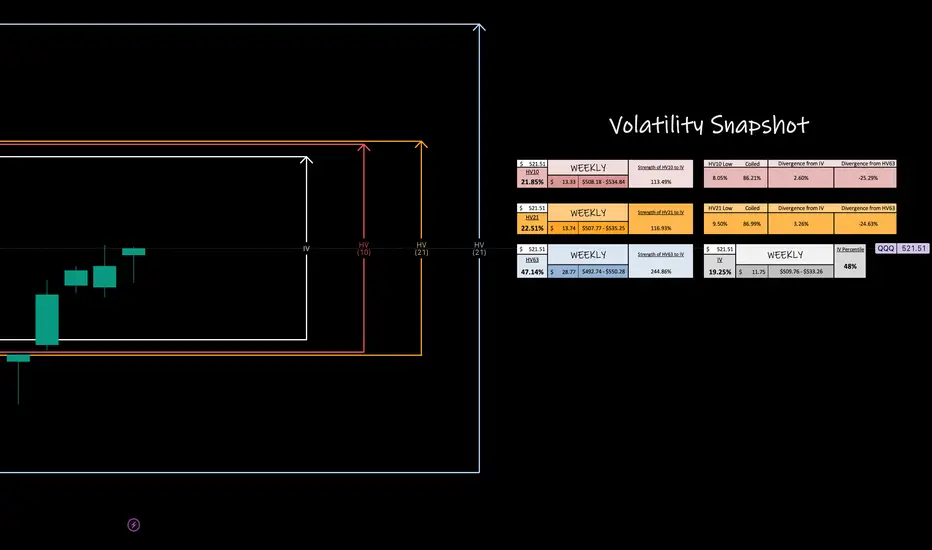
QQQ Weekly PotentialVolatility, expressed through standard deviation, quantifies market elasticity and presents a level of probability and precision that humbles us all.
This week with NASDAQ:QQQ we see that the shorter term trending volatility is resonating like SP:SPX and AMEX:SPY just under our monthly values. Range seems to be expanding allowing for cheaper premium capture per move happening. With any luck, we reflect and increase in volatility with up to quarterly means.
BOOST the post, drop a follow and comment, BUT don't forget to circle back at the end of the week to revisit and observe how our trending markets preformed!
QQQ What Next? SELL!
My dear followers,
I analysed this chart on QQQ and concluded the following:
The market is trading on 521.53 pivot level.
Bias - Bearish
Technical Indicators: Both Super Trend & Pivot HL indicate a highly probable Bearish continuation.
Target - 492.15
Safe Stop Loss - 535.10
About Used Indicators:
A super-trend indicator is plotted on either above or below the closing price to signal a buy or sell. The indicator changes color, based on whether or not you should be buying. If the super-trend indicator moves below the closing price, the indicator turns green, and it signals an entry point or points to buy.
Disclosure: I am part of Trade Nation's Influencer program and receive a monthly fee for using their TradingView charts in my analysis.
———————————
WISH YOU ALL LUCK

$QQQ Needs this pullback to happen!NASDAQ:QQQ a healthy pullback to fill the GAP and retest the 100/200DMA here going into next week.
A break through these MA's would be very bearish.

$QQQ to $538 then one more leg down?Despite the bearish move in QQQ today, I still think there's another move higher.
I think it's likely that we go and retest the ATHs at $538 (so another 5% or so up) and then we find resistance there and start one last move down to $318-$383.
Only after we see another leg down, do we see new highs. Marked off support levels to the downside.
Invalidation of the idea would be flipping $538 as support.

Smart Entry into the Wheel Using a Credit Put Spread on QQQSmart Entry into the Wheel Strategy Using a Credit Put Spread on QQQ
⚠️ ⚠️ Warning and Disclaimer⚠️⚠️:
This strategy is a trading concept and not financial advice. All traders must conduct their own research and accept full responsibility for the risks involved. While NASDAQ:QQQ is considered a high-quality ETF, options trading always carries the potential for capital loss.
Market Context & Strategic Outlook
Assuming the weekly gap in QQQ gets filled, we may see a temporary correction to around $488 , followed by a quick recovery and potential consolidation near $500 , assuming no new negative catalysts. While I remain skeptical of the market staying perfectly stable, this scenario provides an opportunity for a strategically structured option play with reasonable reward and manageable risk.
If you're planning to acquire 100 shares of QQQ or have the buying power to do so, this strategy can offer a smart and flexible way to enter a long-term position while generating short-term income.
Strategy Concept: Credit Put Spread as Wheel Entry
Prerequisites:
Buying Power: $50,000+
Ideal Market Conditions: Short-term weakness followed by stabilization
Expiration: ~7 Days to Expiry (DTE), depending on volatility and setup
Option Positions Initial Credit Put Spread
Sell QQQ $500 Put
Buy QQQ $498 Put
Net Delta: Less than 0.03
Note: Short strike must be at $500 to set the stage for assignment and wheel initiation.
Management Phases
Stage 1: Entry via Credit Put Spread
- Sell the vertical spread with the intention of owning QQQ.
- If QQQ falls below $500 , close or roll the long $498 put to a lower strike with delta < 0.15.
- Upon expiration:
Let the short put assign, or
Buy the 100 shares outright and close the short leg before the market closes.
Model Virtualization
Alternative (managing risk with rolling down the long put)
Model Virtualization
Goal: Own QQQ at a slightly discounted price, with reduced initial cost due to premium received.
Stage 2: Transition to Covered Call
- After assignment or manual purchase, sell a covered call:
Target DTE ≈ 7 days
Delta ≈ -0.45
Strike price must be ≥ $500
If not available, sell the short call at $500 strike.
Model Virtualization
This generates weekly income while holding the shares, allowing the strategy to compound returns.
Stage 3: Exit or Continue Wheel
- If the call expires worthless, repeat the covered call sale weekly.
- If assigned early, welcome it as it accelerates capital rotation.
- You may also manually unwind the position on expiration if near max profit or market conditions shift.
Model Virtualization
Strategic Rationale
This strategy is a more dynamic and risk-managed version of the traditional Wheel. Rather than starting with a fully cash-secured put, we use a credit put spread for entry, offering a buffer against a steep drop with lower upfront margin.
Why Not Just Sell the Put?
A credit put spread offers:
Defined risk
Lower buying power requirement
Better capital efficiency if the price declines sharply
When NOT to Use This Strategy
If QQQ is expected to trade in a narrow range with minimal volatility, avoid this approach. Instead, consider:
Butterfly or Iron Condor setups with DTE ~12 days
Calendar spreads to benefit from sideways action
Risk and Reward Assessment
Risk and Reward Assessment, Outcome Scenarios
Scenario 1: Price stays above $500
Outcome: Credit put spread expires worthless
Estimated Profit: ~$150
ROI: Approx. 0.3% on $50,000 buying power
Note: No shares are acquired; premium is kept
Scenario 2: Price drops below $500 but recovers
Outcome: Assigned 100 shares, enter covered call phase
Estimated Profit (3 weeks total): ~$800–$1,200
ROI: Approx. 2%
Note: Ideal wheel cycle if managed properly
Scenario 3: Price drops and stays low
Outcome: Maximum loss on the credit put spread
Estimated Profit: -$160
Note: This occurs if the spread expires in-the-money and is unmanaged
This strategy aims not to harvest credit, but to secure a better entry into a long-term equity position.
Caution on Risk
While QQQ is a fundamentally strong ETF, a sharp decline could lock your capital or increase unrealized losses. Liquidity risk which needs that cash for other purposes is the biggest concern.
Mitigation Tip: Consider using a collar strategy (buying protective puts) to hedge against large drawdowns post-assignment.
Stop Loss?
For long-term investors in QQQ, a traditional stop-loss is less critical. But if you're more tactical or capital-sensitive, protecting the downside with a collar is a reasonable move.
Final Thoughts
This approach offers a sophisticated entry into the "Wheel" strategy, additionally, it balances risk, reward, and capital efficiency. Whether the market pulls back or holds steady, you’re either:
Earning premium while staying in cash, or
Entering a high-quality equity position at a better price and generating income weekly.
Thank you for reading. Wish you a successful options trading!

QQQ about to FLUSH?! Let's talk about it!I'm not saying it's over but you have to admit it does feel like we are going to see a decent size pullback...2-6% over the next few weeks on the NASDAQ:QQQ AMEX:SPY
- TVC:VIX back over 20
- US20Y hit 52 week high
- USDJPY starting to creep towards April lows
- $491.54 GAP to fill on NASDAQ:QQQ
- $447.58 Bigger GAP to fill on NASDAQ:QQQ
- Credit starting to become and issue
- Banks/ Credit companies tanked today
There is bullish pieces as well but we do look extended here and a healthy 2-6% would be welcomed...A break of $475 level spells trouble on QQQ.
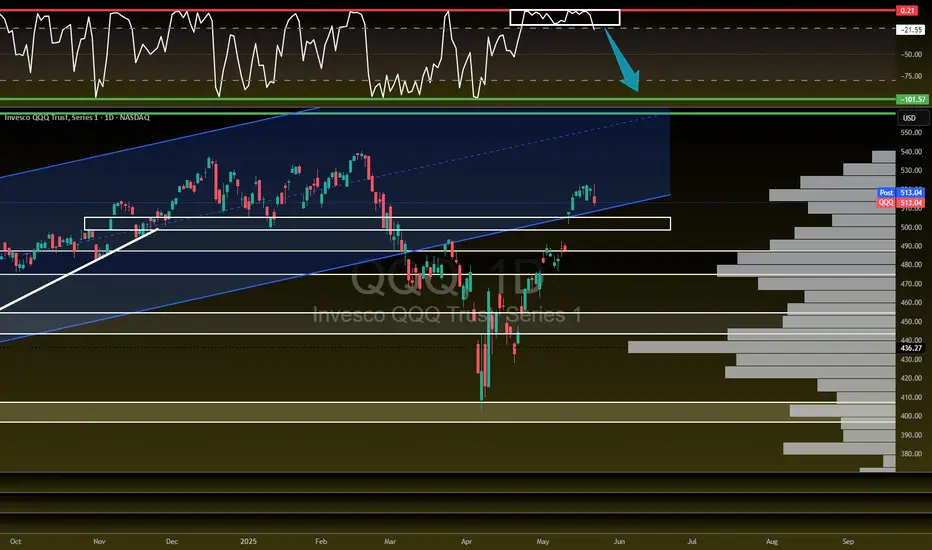
$QQQ is due for a pullback! GAP fill inboundNASDAQ:QQQ is due for a pullback!
- Slamming into $522ish Volume shelf
- At the red barrier and needs to peel off
- GAP fill down to $491.54
- Strong volume but can't push through $522 resistance

THIS TIME IT'S DIFFERENT!🔥 THIS TIME IT'S DIFFERENT! 🔥
Can you see the shift?! VOLUME IS HERE—AND IT'S MASSIVE. 💪💰
Unlike those weak, fleeting rallies that got crushed under waves of red, this one is packed with bullish buyers and offside hedge funds READY TO SEND IT HIGHER. 🚀📈
Not to mention the last time we had this level of above average volume for this long was in October 2023 when we were coming out of a bear market and it was only the beginning of our ascent higher!
I'm not saying we can't have a pullback soon...I'm just simply saying the volume is here and it looks like dips will indeed be shallow.
ATH retest INBOUND!
Are you positioned for the move? 👀
AMEX:SPY NASDAQ:QQQ

$QQQ // May 19 2026 // Analysis & Targets for Day TradersNASDAQ:QQQ // May 19 2026 // Analysis & Targets for Day Traders

QQQ: Bearish Continuation & Short Trade
QQQ
- Classic bearish pattern
- Our team expects retracement
SUGGESTED TRADE:
Swing Trade
Sell QQQ
Entry - 521.53
Stop - 536.96
Take - 476.43
Our Risk - 1%
Start protection of your profits from lower levels
Disclosure: I am part of Trade Nation's Influencer program and receive a monthly fee for using their TradingView charts in my analysis.
❤️ Please, support our work with like & comment! ❤️

Pullback before higher ? Just looking at a break under from previous lows now that we are back over it right now. 515-505

$QQQ // May 16 2026 // Analysis & Targets for Day TradersNASDAQ:QQQ // May 16 2026 // Analysis & Targets for Day Traders
This is for the May 16th 2025 contract

QQQ Bearish Ideal Butterfly Pattern.Okay, so the idea is, what are the odds of butterfly QQQ taking a nosedive from 500 ?
My guess? Pretty high.

Long Position on QQQ – 16th May 2025 AnalysisTrading Idea: Long Position on QQQ – 16th May 2025
This chart illustrates a long position on QQQ, in the Daily Time Frame. Overall, the market structure is bullish. It is expected to retest 493 to 500, before going further high. Also, if any liquidity is targeted, then 475 should be the spot.
Analysis:
• Market Structure: The overall market structure is Bullish. Since it has given good breakout above recent high above 20 EMA (i.e. on 25th March 2025), it is the expectation that the market will retest this level, near 493 to 500.
• Liquidity Target: It is also expected that big players can target liquidity near 475 level, which was the recent breakout level.
• Trend Change: Anything below 475, could be considered in weakness in trend and possibly slow down the recovery to all time high.
Trade plan1:
• Entry: Near 500
• Stop Loss: 490
• Take Profit: Around 530
• Risk-Reward: 1:4
Trade plan2:
• Entry: Near $480
• Stop Loss: Near $470
• Take Profit: Around $530
• Risk-Reward: 1:5
Disclaimer:
The information provided in this chart is for educational and informational purposes only and should not be considered as investment advice. Trading and investing involve substantial risk and are not suitable for every investor. You should carefully consider your financial situation and consult with a financial advisor before making any investment decisions. The creator of this chart does not guarantee any specific outcome or profit and is not responsible for any losses incurred as a result of using this information. Past performance is not indicative of future results. Use this information at your own risk. This chart has been created for my own improvement in Trading and Investment Analysis. Please do your own analysis before any investments.

$QQQ Over $523.5 for a retest of Highs. Lower High Setup?As you can see on the notes in the chart, several 5 counts lead to sell offs in the last Quarter. Will this trend continue or will we run it to a 9 Count again? 3 Days left. Watch these levels as I have a possible selloff to May open Price. This would effectively follow my 10D chart forecast of new lows in the next 30-40 trading days, if not 20 for significant damage either way. I will continue to update as we go.

$QQQ Analysis, Key Levels & Targets for Day Traders // May 15 25NASDAQ:QQQ Analysis, Key Levels & Targets for Day Traders // May 15 25
Let's go, we had PPI in premarket w// Powell... Today's range looks fun.

Magnificent Seven: Still Magnificent? Or Diverging for Good?The Nasdaq 100 has bounced, but under the surface, the “Magnificent Seven” are no longer marching in sync.
And this divergence matters, especially if you’re trading QQQ or using it as a momentum proxy.
⚔️ Leadership Rotation in Real Time
- Nvidia (NVDA): Still a beast. Making fresh highs, clear institutional momentum.
- Microsoft (MSFT): Quiet strength — not flashy, but technically clean.
- Meta, Amazon: Holding up, consolidating after major runs.
- Apple (AAPL) and Tesla (TSLA): Weak links. AAPL can't find a bid. TSLA is stuck below major resistance.
Trading QQQ directly?
Consider weighting your thesis by what’s working under the hood.
- QQQ reclaimed the 200-day MA with the May 12's gap echoing the broader S&P move.
- Look for a retest of the resistance and the previous high of 540
- Play breakouts with confirmation, or mean-reverting pullbacks.
🧠 Final Take
The Magnificent Seven are splitting into two camps: those still driving the rally, and those dragging it.

What Makes a Chart Tradable – Part TwoIn the previous post , we explored the foundations of technical trading. We examined how market behavior can appear structured even when it results from randomness, how bias affects interpretation and how volatility persistence helps explain why certain moves tend to cluster rather than appear in isolation. This post builds on that foundation by focusing on how to recognize meaningful movement and determine whether a chart structure is tradable.
Technical charts often present a wide range of setups, patterns, and interpretations. But a core distinction must be made between coincidental formations and actual price behavior driven by imbalance. Not all movements are equal, and recognizing the difference between random fluctuation and purposeful structure is essential.
A common assumption in technical analysis is that certain patterns or shapes inherently provide a specific outcome. This assumption is problematic without a defined context. The ability to recognize a flag or wedge does not imply statistical validity. For a price movement to be tradable, there should be characteristics that suggest underlying buying or selling pressure.
Unusual Movement
To determine whether a price move is meaningful, it must be assessed in relation to what is typical for that market. All assets have their own average range, pace and rhythm. When price breaks from that baseline through unusually strong or sustained movement, it can signal momentum or imbalance.
What makes these moves relevant is not their size alone, but the fact that they differ from normal behavior. This kind of shift may reflect changes in supply and demand or a reaction to new information. Such movements could mark a change in behavior and can serve as reference points. Their value lies in being statistically uncommon, which may suggest that market conditions have changed.
Pullbacks as Rebalance
Following strong directional movement, price tends to enter a state of reversion or pause. This is known as a pullback, a controlled retracement .It is not merely a pause. It reflects a psychological reset and the temporary rebalancing of order flow in response to imbalance.
Not all pullbacks are viable. For a setup to be considered tradable, the retracement must occur in the context of a meaningful prior move. When the underlying trend is intact and the pullback is controlled, the structure can offer a more reliable opportunity.
The Role of Standardization
Trading should be based on discretion. It involves interpretation, context and deliberate decision-making. But without structure, it risks becoming inconsistent and reactive.
Therefore movement and momentum should be measurable. What appears meaningful must be evaluated relative to the asset’s own historical behavior, not assumed based on surface-level appearance. Without a reference, the evaluation may lack foundation.
Measurement supports model building. Standardization supports disciplined execution. A trader might believe a move is strong based on visual cues or pattern familiarity, but if it lacks historical context or fails to meet defined criteria, that evaluation could be flawed.
Framework and Models
There are categories of tools that can be incorporated to support standardization. The choice is not fixed and should be based on personal preference, methods and research. Example:
Volatility Measure: Could be used to confirm when price moves outside a volatility-based envelope, indicating movement beyond the average range.
Momentum Measure: Could be used to confirm whether current price action is faster or stronger compared to recent historical behavior.
Such models are used to define context, not to predict outcomes. They help standardize analysis and filter out questionable movements and patterns.
Conclusion
The textbook patterns often referenced on their own do not create edge. Tradable charts are those where meaningful movement, defined by momentum, imbalance and structure, can be observed and evaluated using standardized methods. The purpose is not precision but repeatability. Discretionary trading is built on contextual evaluation supported by consistency and objective tools.

Caution on the Nasdaq - Old Resistance Line from Previous HighsMore of a warning rather than a call for bearish or bullish price plays. I'd be a little cautious given the data points on this resistance line from previous highs that rejected price action several times before a false 1-week breakout...

SPY/QQQ ES/NQ 14 Mayo 2025QQQ SpotGamma Chart Analysis – May 14, 2025
📊 Key Context
This chart shows the options-derived levels for QQQ using SpotGamma’s tools. It combines key gamma levels (Call Walls, Put Walls), liquidity zones, and potential reversal targets.
🧱 Major Resistance Zones
Level Description
525 🔔 Call Wall (Maximum) – Strongest resistance, potential reversal zone.
520 ⚠️ Call Wall (2) – Price might stall here. Likely target or short entry.
518.42 🎯 RB Head – Reversal Block Head; strong confluence for decision-making.
517 🛑 Call Wall (1) – Minor resistance, price may hesitate here.
📌 Area marked in red: "Possible Selling or Target Zone" – Ideal spot for profit-taking if long, or potential short if momentum shifts.
🛡️ Support & Demand Zones
Level Description
516 🟡 Put Wall (2) – Minor support zone.
515-514.9 🟨 RB Bottom / Put Wall (1) – High probability buy zone.
510 🔵 Put Wall (3) – Strong support level, possible bounce point.
🟡 Yellow box zone is highlighted as a "Possible Buy/Sell Zone" – high activity expected due to overlapping gamma levels.
🔀 Scenarios Outlined
Bullish Path: Break above 518.42 → target 520 → possible extension to 525.
Bearish Path: Rejection at 518.42 or 520 → pullback to 515 or 510 for possible bounce.
Neutral to Reversal: Consolidation between 514-518 likely leads to explosive breakout or breakdown.

Bullseye! Moment of silence waking up to the precise beauty of Fibonacci ‘Price X Time’ Theory slapping’ heads on NASDAQ:QQQ
If you love Fibonacci mathematics in trading and are interesting exploring deeper level of retracement symmetry— give me BOOST to help me organically grow and drop a comment!

Tracking POSSIBLE Formation of Head and Shoulders on QQQIf there's one thing this chart makes clear it's that the next week or two will be make or break.
