Chinese Real Estate Large Cap IndexThis is an updated version of my previous "Evergrande + others" chart of Chinese real estate. Instead of including some smaller companies with longer price history, this focuses on large market cap companies. I weighted the prices against each other equally by their 42 day average, and then weighted
Next report date
—
Report period
—
EPS estimate
—
Revenue estimate
—
5.65 CNY
17.73 B CNY
68.21 B CNY
1.51 B
About SUN HUNG KAI PROPERTIES LTD
Sector
Industry
CEO
Ping Luen Kwok
Website
Headquarters
Hong Kong
Founded
1963
ISIN
HK0016000132
FIGI
BBG01GXJND56
Sun Hung Kai Properties Ltd. is an investment holding company, which engages in the development of property for sale and investment. It operates through the following segments: Property Sales, Property Rental, Hotel Operation, Telecommunications and Transport Infrastructure and Logistics, Data Centre Operations, and Other Businesses. The company was founded in 1963 and is headquartered in Hong Kong.
Related stocks

Chinese Real Estate Large Cap Custom Index v2Just a quick update of the last chart I posted, which had a bug. These stocks:
'0123'
'0083'
refer to Malaysian stocks, but these stocks:
'123'
'83'
are the symbols we want.
Here is the updated index for your usage:
'16'/0.3506+'688'/0.08518+'1109'/0.1433+'2202'/0.07858+'1113'/0.2549+'960'/0.21

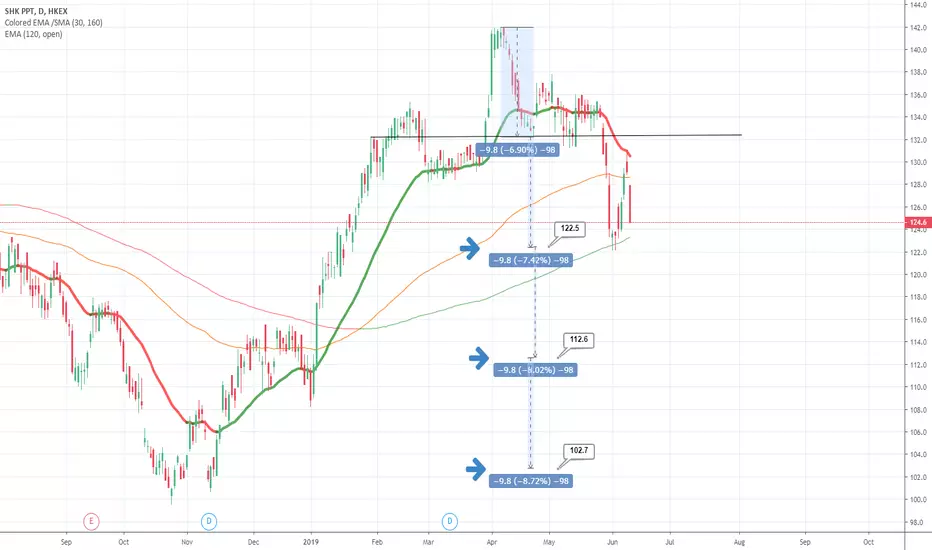
16 HK property Short!HK's is sick, so, put property.
16, by looking at pattern, it's about $10 per wave, see chart below.
Target $113, $103
See all ideas
Summarizing what the indicators are suggesting.
Neutral
SellBuy
Strong sellStrong buy
Strong sellSellNeutralBuyStrong buy
Neutral
SellBuy
Strong sellStrong buy
Strong sellSellNeutralBuyStrong buy
Neutral
SellBuy
Strong sellStrong buy
Strong sellSellNeutralBuyStrong buy
An aggregate view of professional's ratings.
Neutral
SellBuy
Strong sellStrong buy
Strong sellSellNeutralBuyStrong buy
Neutral
SellBuy
Strong sellStrong buy
Strong sellSellNeutralBuyStrong buy
Neutral
SellBuy
Strong sellStrong buy
Strong sellSellNeutralBuyStrong buy
Displays a symbol's price movements over previous years to identify recurring trends.
SUHJF4985613
Sun Hung Kai Properties (Capital Market) Ltd. 2.75% 13-MAY-2030Yield to maturity
4.63%
Maturity date
May 13, 2030
SUHJF4947058
Sun Hung Kai Properties (Capital Market) Ltd. 2.875% 21-JAN-2030Yield to maturity
4.59%
Maturity date
Jan 21, 2030
SUHJF4810675
Sun Hung Kai Properties (Capital Market) Ltd. 3.75% 25-FEB-2029Yield to maturity
4.38%
Maturity date
Feb 25, 2029
See all 80016 bonds
Frequently Asked Questions
The current price of 80016 is 84.20 CNY — it has decreased by −1.92% in the past 24 hours. Watch SUN HUNG KAI PROPERTIES LTD stock price performance more closely on the chart.
Depending on the exchange, the stock ticker may vary. For instance, on HKEX exchange SUN HUNG KAI PROPERTIES LTD stocks are traded under the ticker 80016.
80016 stock has risen by 0.18% compared to the previous week, the month change is a 1.20% rise, over the last year SUN HUNG KAI PROPERTIES LTD has showed a 33.97% increase.
We've gathered analysts' opinions on SUN HUNG KAI PROPERTIES LTD future price: according to them, 80016 price has a max estimate of 103.19 CNY and a min estimate of 82.21 CNY. Watch 80016 chart and read a more detailed SUN HUNG KAI PROPERTIES LTD stock forecast: see what analysts think of SUN HUNG KAI PROPERTIES LTD and suggest that you do with its stocks.
80016 reached its all-time high on Jun 21, 2023 with the price of 93.70 CNY, and its all-time low was 61.00 CNY and was reached on Jul 8, 2024. View more price dynamics on 80016 chart.
See other stocks reaching their highest and lowest prices.
See other stocks reaching their highest and lowest prices.
80016 stock is 1.96% volatile and has beta coefficient of 0.59. Track SUN HUNG KAI PROPERTIES LTD stock price on the chart and check out the list of the most volatile stocks — is SUN HUNG KAI PROPERTIES LTD there?
Today SUN HUNG KAI PROPERTIES LTD has the market capitalization of 243.75 B, it has increased by 1.50% over the last week.
Yes, you can track SUN HUNG KAI PROPERTIES LTD financials in yearly and quarterly reports right on TradingView.
SUN HUNG KAI PROPERTIES LTD is going to release the next earnings report on Sep 4, 2025. Keep track of upcoming events with our Earnings Calendar.
80016 earnings for the last half-year are 3.39 CNY per share, whereas the estimation was 3.29 CNY, resulting in a 3.14% surprise. The estimated earnings for the next half-year are 3.84 CNY per share. See more details about SUN HUNG KAI PROPERTIES LTD earnings.
SUN HUNG KAI PROPERTIES LTD revenue for the last half-year amounts to 37.52 B CNY, despite the estimated figure of 34.74 B CNY. In the next half-year revenue is expected to reach 47.80 B CNY.
80016 net income for the last half-year is 7.07 B CNY, while the previous report showed 9.22 B CNY of net income which accounts for −23.30% change. Track more SUN HUNG KAI PROPERTIES LTD financial stats to get the full picture.
SUN HUNG KAI PROPERTIES LTD dividend yield was 5.55% in 2024, and payout ratio reached 57.06%. The year before the numbers were 5.02% and 60.00% correspondingly. See high-dividend stocks and find more opportunities for your portfolio.
As of Aug 3, 2025, the company has 40 K employees. See our rating of the largest employees — is SUN HUNG KAI PROPERTIES LTD on this list?
EBITDA measures a company's operating performance, its growth signifies an improvement in the efficiency of a company. SUN HUNG KAI PROPERTIES LTD EBITDA is 31.28 B CNY, and current EBITDA margin is 43.08%. See more stats in SUN HUNG KAI PROPERTIES LTD financial statements.
Like other stocks, 80016 shares are traded on stock exchanges, e.g. Nasdaq, Nyse, Euronext, and the easiest way to buy them is through an online stock broker. To do this, you need to open an account and follow a broker's procedures, then start trading. You can trade SUN HUNG KAI PROPERTIES LTD stock right from TradingView charts — choose your broker and connect to your account.
Investing in stocks requires a comprehensive research: you should carefully study all the available data, e.g. company's financials, related news, and its technical analysis. So SUN HUNG KAI PROPERTIES LTD technincal analysis shows the buy rating today, and its 1 week rating is buy. Since market conditions are prone to changes, it's worth looking a bit further into the future — according to the 1 month rating SUN HUNG KAI PROPERTIES LTD stock shows the buy signal. See more of SUN HUNG KAI PROPERTIES LTD technicals for a more comprehensive analysis.
If you're still not sure, try looking for inspiration in our curated watchlists.
If you're still not sure, try looking for inspiration in our curated watchlists.