Buy 0883.hk CNOOC LIMITED @ HK $18.1Buy CNOOC here due to the following technical and fundamental reasons:
Technical
-50% Retracement of the last move up
- Support at 50 Day moving average at about $18.00
Fundamental
- 2014 Forward PE ratio of 5.5
- Growth in South China sea fields.
- Recent China govt policy support of the stock market
- Highly supportive dividend yield of 8%
- Strong balance sheet
- Still a very solid production growth outlook
Risks
- Extreme geopolitical tension may cause foreigners to be blocked out of trading Chinese equities, even if listed in Hong Kong (Like happened with Gazprom)
Target: HK $28 within 1 year
Stop: HK$ 15.00
Risk / Reward: 1:3
80883 trade ideas

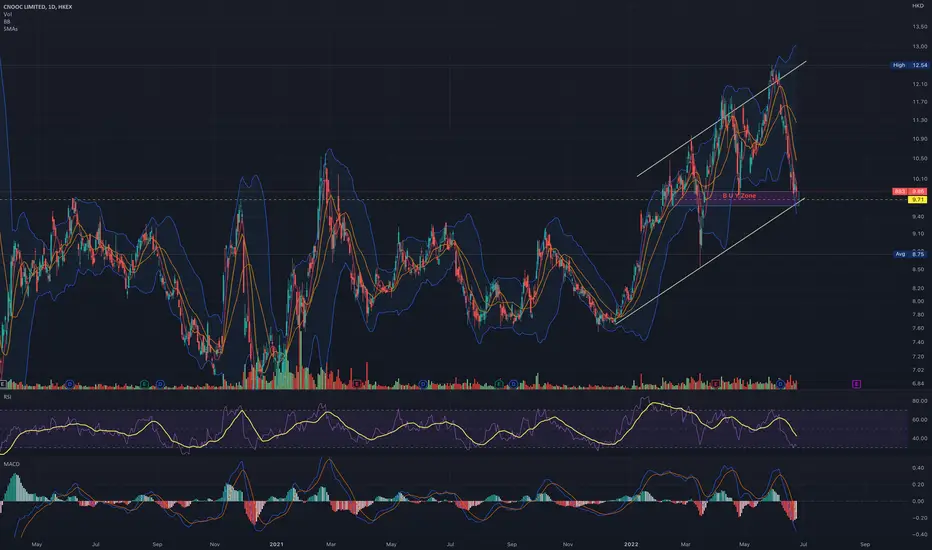
CNOOC Limited (1D): Bullish trendI believe CNOOC Limited is currently in price consolidation. After experiencing a downward journey lasting one and a half months, the stock has reached a strong support zone and is showing signs of reduced volume.
Entering at this level offers an attractive risk-to-reward ratio. If my analysis is correct, using the upper yellow line as an exit point would be the optimal strategy.
Feel free to share your thoughts! Wishing you success in your investments.

short position on ZWMy strategy is based on price action with the reading of certain indicators that I like while respecting all the values that define the stock maket

How To Pick The Best Stocks In The Market ?Learn to find the stocks with the best technical setup and see if they fit the criteria (8/8 full score). Of course these stocks should be in the top performing sectors and you should wait for short-term pullbacks to entry...

CNOOC is approaching support Prices are approaching support in line with our ascending trend line where we could see an upside above this level.

CNOOC is approaching support, potential bounce Prices are approaching support where we could see a bounce above this level.

Bad news are good news.Analysis:
A recent news "U.S. sanctions China’s CNOOC on drilling in disputed South China Sea." ---- Such news caused CNOOC (883) plummet for 20%.
Margin positions shall be all kicked off by such volatility .
Entry:
$7.6 a share could provide 10% dividends to stock holders, according to the record, so it would be a good pick.
Target:
We look for $8.6 (The median of Monday price) or $9.4 within a month, and hitting $12 within a year.

Watching The monthly chart All the moving averages are showing downwards momentum. 200 ma (Grey Line) is bullish that is due to historical rally from 2002 to 2011.Then we have a black sr line that shows resistance on four occasion starting from feb 2012 to sept 2014. Then it was broken on April 2018 and provided support but failed to make higher highs and formed a declining wedge. Break of the wedge on 2 March 2020 triggered a sell off till the Support rectangle. RSI is currently showing no divergence which tells that the downtrend does not show fear or greed but some fundamental catalyst existence.
Will only buy after break and confirmed back test of Black line.
thanks for reading. Appreciate comments and feedback

LONG 883 (CNOOC)Expecting bounce from extremely oversold weekly and daily levels. If stop breached, be prepared to catch new daily reversal on lower levels with a tight stop.

LONG 883 (CNOOC)Expecting bounce from extremely oversold weekly and daily levels. If stop breached, be prepared to catch new daily reversal on lower levels with a tight stop.
