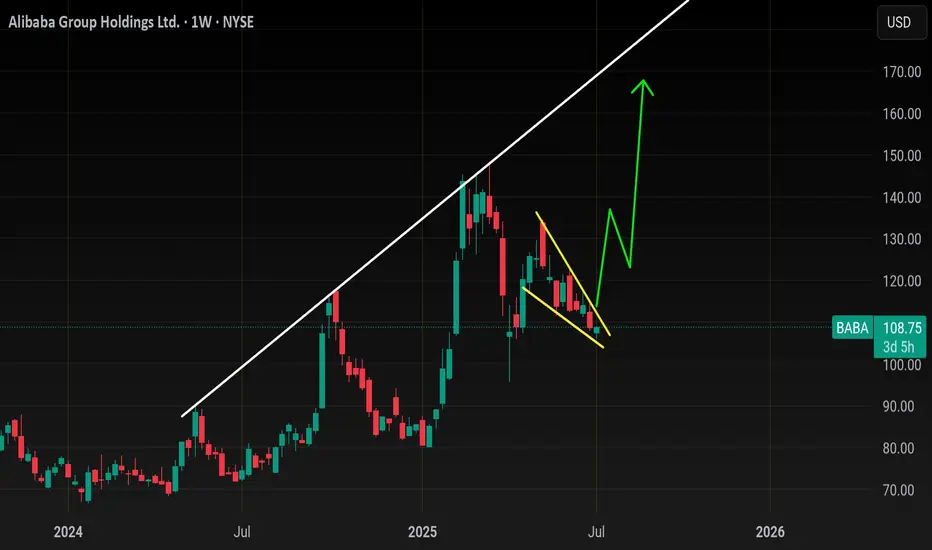
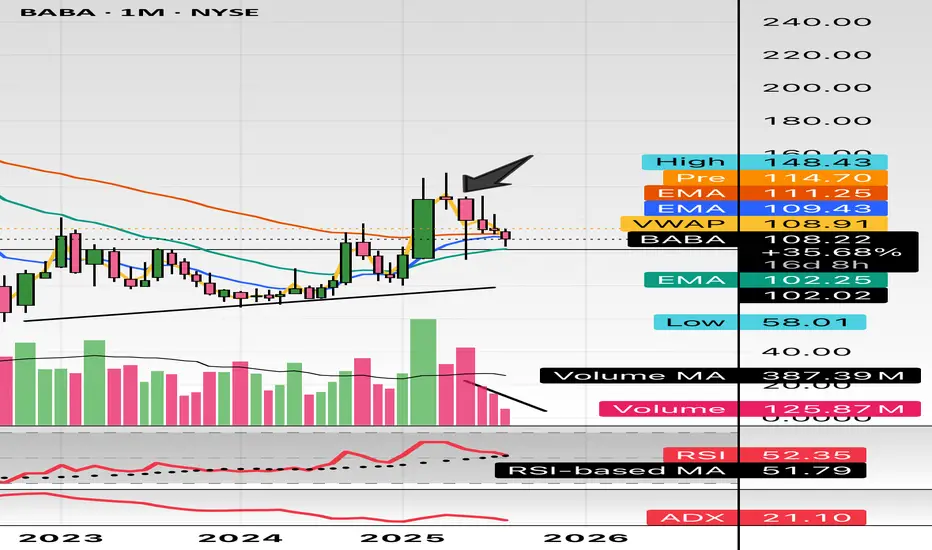
Alibaba - A remarkable reversal!🛒Alibaba ( NYSE:BABA ) reversed exactly here:
🔎Analysis summary:
Recently Alibaba has perfectly been respecting market structure. With the current bullish break and retest playing out, there is a very high chance that Alibaba will rally at least another +20%. But all of this chart behaviour j
Key facts today
Next report date
—
Report period
—
EPS estimate
—
Revenue estimate
—
7.0 CNY
130.37 B CNY
1.00 T CNY
16.56 B
About Alibaba Group Holdings Ltd.
Sector
Industry
CEO
Yong Ming Eddie Wu
Website
Headquarters
Hangzhou
Founded
1999
FIGI
BBG01GXJWZF6
Alibaba Group Holding Ltd. engages in providing technology infrastructure and marketing reach. It operates through the following business segments: China Commerce, International Commerce, Local Consumer Services, Cainiao, Cloud, Digital Media and Entertainment, and Innovation Initiatives and Others segments. The Core Commerce segment consists of platforms operating in retail and wholesale. The China Commerce segment includes China commerce retail and wholesale businesses. The International Commerce segment focuses on international commerce retail and wholesale businesses. The Local Consumer Services segment is involved in To-Home businesses, which include Ele.me, local services and delivery platform, and Taoxianda, and To-Destination segment businesses which include Amap, the provider of mobile digital map, navigation and real-time traffic information, and restaurant and local services guide platform. The Cainiao segment has Cainiao Network and offers domestic and international one-stop-shop logistics services and supply chain management solution. The Cloud segment includes Alibaba Cloud and DingTalk. The company was founded by Chung Tsai and Yun Ma on June 28, 1999 and is headquartered in Hangzhou, China.
Related stocks

BabaPrice has formed a pretty big bullish wedge here.
In the next 2weeks I expect baba to push back up and close gap at 115..
From there we could pullback to retest falling wedge or push higher ..
This wedge should push baba back to close gap at 160 minimum
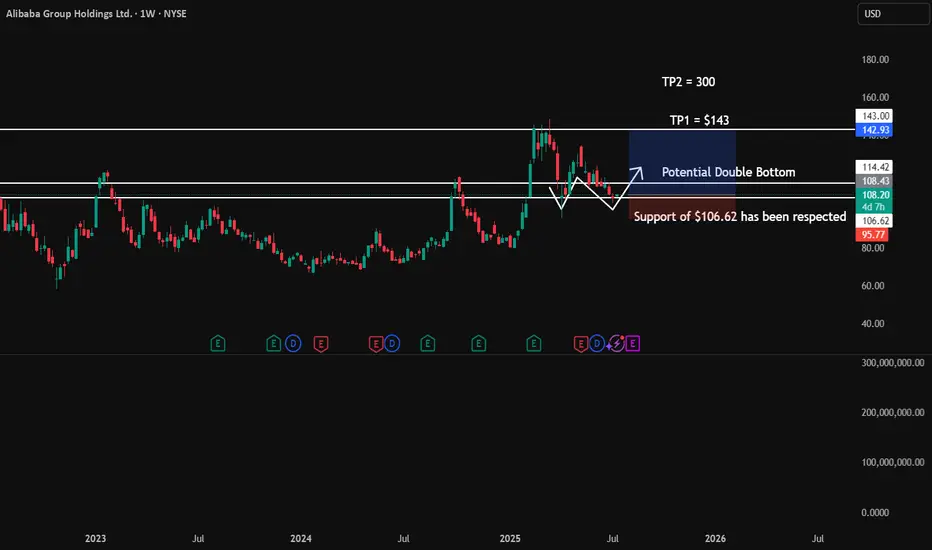
BABA longPotential double bottom to be formed on the Weekly TF.
I think well into Aug and Sept, this will mature.
$143 is a key price value zone.
$BABA 160+ before year end looks realistic thanks $NVDA- NASDAQ:NVDA export ban lifted for China will be beneficial for NASDAQ:NVDA for sure but main advantages would be for NYSE:BABA as they can get the shovels from the shop as well so that they can compete in Gold Rush and compete with NASDAQ:GOOGL , NASDAQ:META and other private companies l
BABA – Dollar Cost Averaging Opportunityhi Traders,
Let's have a look at BABA.
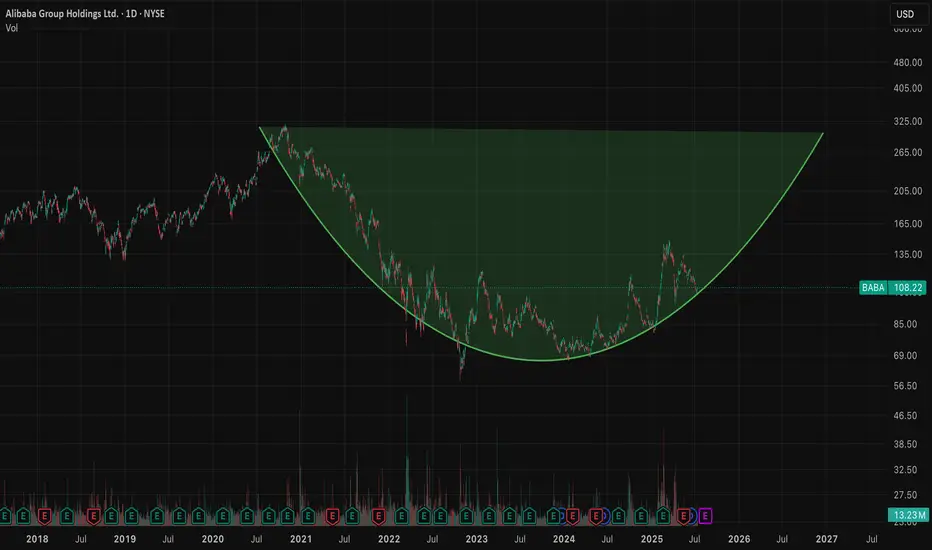
Alibaba (BABA) appears to be approaching the end of its correction phase within a well-defined ascending channel. Based on the current price action and technical setup, we believe now is a good time to begin dollar cost averaging into this stock.
Our identif

BABA: What are you seeing on this chart?BABA:
.
What are you seeing on this chart?
A perfect shakeout.
Smart money has joined at the bottom.
What's next?
.
US STOCKS- WALL STREET DREAM- LET'S THE MARKET SPEAK!

Alibaba | BABA | Long at $108.84Like Amazon, I suspect AI and robotics will enhance Alibaba's NYSE:BABA e-commerce, logistics, and cloud computing operations. There is some risk here, like other Chinese stocks, that they could be delisted from the US market if trade/war tensions rise. But I just don't think that is likely (no m

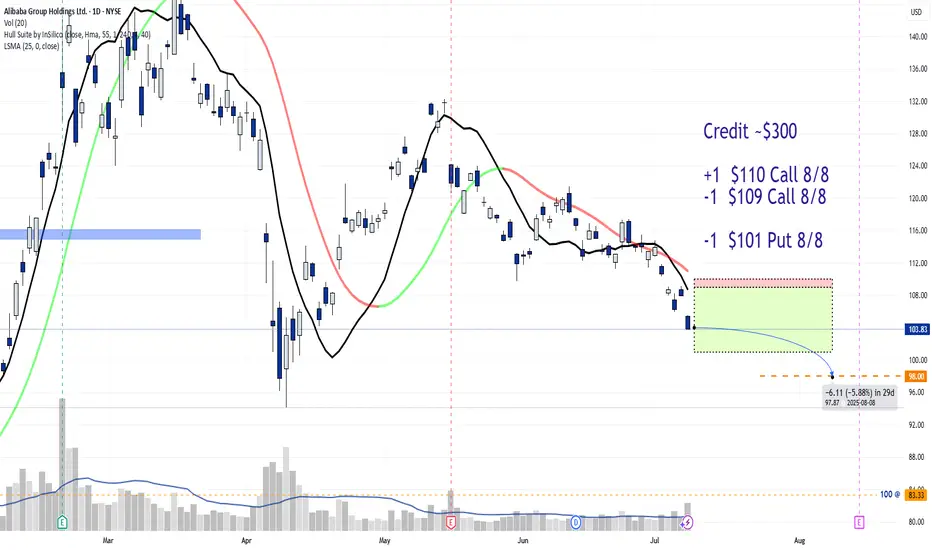
JADE LIZARD Trade for an Aug 8th expirationCredit ~$300
+1 $110 Call 8/8
-1 $109 Call 8/8
-1 $101 Put 8/8
AT EXPIRATION:
PRICE > $110 = profit of $200
PRICE between $101-$109 = profit of $300 (max)
PRICE < $101 = Assigned to purchase 100 shares of BABA @ $98 per share, (avg cost).
$BABA don’t miss this milky bottle. Called this out at $105 in minds. This Monthly declining volume, support at $100, and uptrend pattern. China will boom into the end of Q3 and early 2026. Target is $180 and $200.
WSL.
Long $BABA - NYSE:BABA is testing 200 SMA
- NYSE:BABA moves are explodes higher then cools then retest support then explodes higher than the last high. It's called trading with higher wavelength
-> Move 1: Started April 2024 when the trend reversal started. $68 -> $89 with around +30% then retraced $9

See all ideas
Summarizing what the indicators are suggesting.
Neutral
SellBuy
Strong sellStrong buy
Strong sellSellNeutralBuyStrong buy
Neutral
SellBuy
Strong sellStrong buy
Strong sellSellNeutralBuyStrong buy
Neutral
SellBuy
Strong sellStrong buy
Strong sellSellNeutralBuyStrong buy
An aggregate view of professional's ratings.
Neutral
SellBuy
Strong sellStrong buy
Strong sellSellNeutralBuyStrong buy
Neutral
SellBuy
Strong sellStrong buy
Strong sellSellNeutralBuyStrong buy
Neutral
SellBuy
Strong sellStrong buy
Strong sellSellNeutralBuyStrong buy
Displays a symbol's price movements over previous years to identify recurring trends.
Curated watchlists where 89988 is featured.


Frequently Asked Questions
The current price of 89988 is 103.1 CNY — it has increased by 1.54% in the past 24 hours. Watch ALIBABA GROUP HOLDING LTD stock price performance more closely on the chart.
Depending on the exchange, the stock ticker may vary. For instance, on HKEX exchange ALIBABA GROUP HOLDING LTD stocks are traded under the ticker 89988.
89988 stock has risen by 5.83% compared to the previous week, the month change is a 3.13% rise, over the last year ALIBABA GROUP HOLDING LTD has showed a 45.21% increase.
We've gathered analysts' opinions on ALIBABA GROUP HOLDING LTD future price: according to them, 89988 price has a max estimate of 158.32 CNY and a min estimate of 95.96 CNY. Watch 89988 chart and read a more detailed ALIBABA GROUP HOLDING LTD stock forecast: see what analysts think of ALIBABA GROUP HOLDING LTD and suggest that you do with its stocks.
89988 reached its all-time high on Mar 7, 2025 with the price of 135.5 CNY, and its all-time low was 59.8 CNY and was reached on Jan 22, 2024. View more price dynamics on 89988 chart.
See other stocks reaching their highest and lowest prices.
See other stocks reaching their highest and lowest prices.
89988 stock is 1.75% volatile and has beta coefficient of 1.58. Track ALIBABA GROUP HOLDING LTD stock price on the chart and check out the list of the most volatile stocks — is ALIBABA GROUP HOLDING LTD there?
Today ALIBABA GROUP HOLDING LTD has the market capitalization of 1.86 T, it has decreased by −2.07% over the last week.
Yes, you can track ALIBABA GROUP HOLDING LTD financials in yearly and quarterly reports right on TradingView.
ALIBABA GROUP HOLDING LTD is going to release the next earnings report on Aug 14, 2025. Keep track of upcoming events with our Earnings Calendar.
89988 earnings for the last quarter are 1.58 CNY per share, whereas the estimation was 1.55 CNY resulting in a 1.69% surprise. The estimated earnings for the next quarter are 1.99 CNY per share. See more details about ALIBABA GROUP HOLDING LTD earnings.
ALIBABA GROUP HOLDING LTD revenue for the last quarter amounts to 238.70 B CNY, despite the estimated figure of 238.90 B CNY. In the next quarter, revenue is expected to reach 252.95 B CNY.
89988 net income for the last quarter is 12.35 B CNY, while the quarter before that showed 49.73 B CNY of net income which accounts for −75.17% change. Track more ALIBABA GROUP HOLDING LTD financial stats to get the full picture.
ALIBABA GROUP HOLDING LTD dividend yield was 0.80% in 2024, and payout ratio reached 13.85%. The year before the numbers were 1.39% and 22.64% correspondingly. See high-dividend stocks and find more opportunities for your portfolio.
As of Jul 17, 2025, the company has 124.32 K employees. See our rating of the largest employees — is ALIBABA GROUP HOLDING LTD on this list?
EBITDA measures a company's operating performance, its growth signifies an improvement in the efficiency of a company. ALIBABA GROUP HOLDING LTD EBITDA is 183.23 B CNY, and current EBITDA margin is 17.78%. See more stats in ALIBABA GROUP HOLDING LTD financial statements.
Like other stocks, 89988 shares are traded on stock exchanges, e.g. Nasdaq, Nyse, Euronext, and the easiest way to buy them is through an online stock broker. To do this, you need to open an account and follow a broker's procedures, then start trading. You can trade ALIBABA GROUP HOLDING LTD stock right from TradingView charts — choose your broker and connect to your account.
Investing in stocks requires a comprehensive research: you should carefully study all the available data, e.g. company's financials, related news, and its technical analysis. So ALIBABA GROUP HOLDING LTD technincal analysis shows the buy rating today, and its 1 week rating is neutral. Since market conditions are prone to changes, it's worth looking a bit further into the future — according to the 1 month rating ALIBABA GROUP HOLDING LTD stock shows the buy signal. See more of ALIBABA GROUP HOLDING LTD technicals for a more comprehensive analysis.
If you're still not sure, try looking for inspiration in our curated watchlists.
If you're still not sure, try looking for inspiration in our curated watchlists.