Gold Defies the Fed – The Clash for a New Monetary Order🪙 Gold Defies the Fed – The Clash for a New Monetary Order 📈
🏆 Gold Bulls Rejoice — The Chart Speaks Loud
From $1,700 to over $3,200 — gold has defied every rule in the macro playbook. It rallied through rising rates, a strong dollar, and a supposed tightening cycle. This move isn't just about demand — it's a signal .
📉 Interest Rate Timeline: 2020–2025
Gold moved counter to monetary logic — here’s the full context:
2022 🔺 R: 0.25 ➝ 4.50
Start of aggressive rate hikes – CPI peaked at 9.1% 🔥
2023 ⚒️ R: 4.50 ➝ 5.50
Peak tightening – gold didn’t flinch
2024 ✂️ R: 5.50 ➝ 4.25
Mid-year rate cuts – inflation cooled to 2.4% ❄️
2025 🔁 R: 4.25–4.50
Fed paused, Trump pushing for deeper cuts – tariffs complicate the easing path
🇨🇳 The China Factor – A Strategic Gold Game
#1 producer AND importer
Keeps all domestic production
Estimated holdings: 13,000–17,000 tons
Investing globally (Africa, Asia, LatAm)
Possible BRICS-backed gold currency on the horizon?
China isn't just hedging inflation — it's preparing for monetary evolution.
💱 CPI From Fire to Frost
2022: CPI at 9.1% 🔥
2025: 2.4% ❄️ — near the Fed’s 2% target
Yet despite “normal” inflation, the Fed holds — a sign of deeper uncertainty.
🧭 The 4 Modes of Gold – Explained on Chart
Trump Mode : Aggressive cuts → Gold targets $3,300–$3,600
Feds Mode : Status quo → Gold tests $3,000
China Mode : Strategic surge → Long-term $3,998+
Bitcoin Mode : Digital store of value rises → Gold reverts to $2,537 zone
These are not just technical levels — they represent global monetary narratives.
🕰️ Will History Repeat Itself?
In 1873, Germany adopted gold. China stayed on silver — and lost its monetary edge.
Today, it’s not silver vs gold — it’s gold vs Bitcoin .
China stockpiles gold
U.S. institutions embrace Bitcoin
Trade wars have become currency wars
This isn't a normal market — this is the early stage of a global monetary shift .
🔮 Final Thoughts
We stand at the crossroads of history .
Gold has already chosen its path.
Bitcoin is waiting in the wings.
And fiat? Under pressure.
Stay awake. Stay diversified. The next monetary standard may already be forming.
One Love,
The FXPROFESSOR 💙
GDRM2025 trade ideas

GC heading down againGold is respecting the 2-2.5 stdv like clockwork. After reaching 3130 I expect gold to return down to first 3034, and then eventually down to 2959. This will retrace back to fib 0 for the original manipulation legs as showed on chart. There is also an RSI div on 1H

Gold trend directionGold 93887 has given V patten inside raising flag pattern. Based on chart formation we find the move could be a possible trap with 90587. We expect Gold to drop to test 90587 initially before the flag pattern break down and drop down to our earlier target .
News : supply of gold has increased, demand has decreased. Central banks worldwide are expected to slow their pace of acquisition. According to a survey by the World Gold Council, 71% of central banks plan to either reduce their gold reserves or maintain current levels.
Liquidity Concern :"We're getting a lot of stress in the gold market because of liquidity concerns and margin covering by speculators," said Bart Melek, head of commodity strategies at TD Securities.

Gold "Breakout" - Dollar Tank EditionBought some GLD this morning because I couldn't think of any other play, and I'm watching the market drop and bond yields rise. Then I look at the dollar index and saw it dropping too. The Euros are selling off all US assets, that's why the drop happened between midnight and noon.
The 2% "pump" wasn't really a pump, the dollar dropped 2% this morning. (Though there was a 0.5% actual pump before close.)
Gold (in dollars) will break out if the dollar index drops below support (I posted a chart). I've been looking for a high confidence big trade, I'm going big on gold if the dollar loses support, and that can happen as early as tomorrow. Keep an eye on the dollar index, I'll be at work so I will not be posting my trade entry.
Note that it's not really a breakout, if you look at gold futures in Swiss francs, it's not even near the top. Also, this trade does not apply to people trading in other currencies like Euros or yens.
I think Trump ruined confidence in the dollar, the US market, and bonds. If that's the case, then gold is the way to go.

Possible big short on Gold?Definitely not looking to buy at current prices. COT data showing significant decrease in NC positions and they've been getting out of their longs. Weekly RSI divergence as well. Hasn't had a meaningful higher low in weeks.

Gold Futures– Expanding Triangle Top HypothesisAs of April 14, 2025, gold has surged to record highs near $3,265, but the technical picture suggests trend exhaustion. Price action resembles a potential expanding triangle top, with bearish divergence on RSI and momentum, declining volume on rallies, and seasonal cycles hinting at weakness into May–June. This may not be a fresh impulse but rather a volatile topping formation. If the triangle pattern holds, we could see a breakdown toward the $2,950–$2,800 zone before another base forms. Short-term traders should be cautious and consider scaling into shorts only on failed bounces near resistance. Longs may want to wait until strong support zones around $2,750–$2,850 show signs of stabilization. Risk/reward now favors defense over chase.
Bearish Divergence Across the Board:
RSI & Momentum indicators failed to confirm new highs
Volume spiked on selloffs, not on breakouts
Possible expanding triangle top forming (ABCDE pattern), often a major topping structure
Cycle & Fibonacci Confluence:
Seasonal weakness into May–June aligns with cycle top
Key retracement targets: $3,045 → $2,950 → $2,870 → $2,800
Support zone to watch: $2,750–$2,850
Trade Strategy Ideas:
Short-Term Plan (1–3 Weeks)
Bias: Bearish or Neutral
Pattern: Expanding Triangle (C Wave Possibly Unfolding)
Key Levels:
Resistance: $3,265 (recent high), $3,200 (round-number, prior Wave B)
Initial Downside Targets: $3,045 (23.6% Fib), $2,950 (38.2%)
Stretch Target: $2,870–$2,800 (50–61.8% Fib, Cycle Support Zone)
Entry Plan (Short Bias):
Consider short positions on weak bounce rejections near $3,200–$3,240 if momentum remains divergent.
Watch for breakdowns under $3,100 with high volume confirmation.
Stop Loss: Above $3,275 (new highs invalidate C wave assumption)
Scale Out: Partial profits at $3,045, more at $2,950
Final Target: $2,870–$2,800 zone
Re-evaluate: If strong reversal candles or bullish volume return before $2,950, exit early.
Medium-Term Plan (1–2 Months)
Bias: Wait for correction to finish before new long
Key Timing: Cycle projection into late May–June 2025
Buy Zone (if correction unfolds):
Primary: $2,750–$2,850 (50–61.8% retracement & prior breakout zone)
Entry Strategy:
Wait for a weekly bullish reversal candle or a clear RSI bottoming with momentum confirmation in the $2,750–$2,850 zone.
Prefer entries during a low-volatility retest or after a capitulation flush into major support.
Stop Loss: Below $2,700
Initial Targets for Bounce: $3,045 → $3,200
Scale Out Strategy:
Scale in between $2,800–$2,750
Begin scaling out above $3,045 and $3,150 if bounce occurs
Long-Term Plan (3–6+ Months)
Bias: Neutral to Cautiously Bullish (contingent on structure post-correction)
Trend Review: If correction resolves and price bases around $2,800, long-term bulls may re-enter.
Invalidation of Bullish Thesis: A sustained break below $2,700 with heavy volume and commercial selling.
Next Major Bullish Cycle Potential:
Wave structure reset scenario: After expanding triangle resolution and larger ABC correction, new 5-wave impulse could begin in late Q2 2025.
Macro-Level Support: If global macro uncertainty rises again, gold could re-target $3,300 and higher.
Action: Remain flat until a confirmed low forms. Position building to be considered once weekly momentum resets and smart money returns.
📌 DYOR. Not financial advice.
#Gold #GC_F #Futures #ElliottWave #TechnicalAnalysis #Seasonality #Momentum #RSI #ShortSetup

Short XAU (Gold) Gold Futures are showing a very clean impulsive move through Elliot Wave TA. You can see the running flat on the 2nd wave leading to a very strong move on the Wave 3 major move. The Wave 5 is shorter than the Wave 3 to confirm the possible completion of this 5 Wave move up.
A weaker DXY (USD) is throwing an obstacle to this beautiful setup. Let's see some stability to the bonds market which should lead to stability in the equities market. This should help propel traders taking profits on this Gold rush.

Gold silver coffee4 15 25 I wanted to do this video before the market moved any higher today. I don't know if it's a paradox or not but it looks to me like gold is going to go higher today after it's been coiling since last week and I explained the Dynamics of a coil and the expansion of a coil and hopefully I said it clearly enough that you at least understand my point of view... and then whether it works or not it's a matter of what the market does and I can't change the market. so gold is near an all-time high and it looks like the buyers are coming in to take it higher but as it stands it's hard to know what's going on because it's early in the morning and nothing's really happening ... and my explanation would be that as bullish as the pattern is for gold to go higher it's still contracted. on the other hand silver is not contracted at all it is so expanded that there's a possibility that if silver starts going higher it can have very impressive moves because it's an expanded Market... and they move a lot better with a lot more efficiency than a contracted Market. and the Paradox is that the goal looks like it's going higher to a new high and the silver might go a lot higher because it's expanded. and I'm going to tell you right now if you read this none of it may happen ... but I would be very surprised if gold doesn't go higher... it only takes a few ticks. what really is going to be important to me... his if the silver actually trades the ABC pattern that I put on that chart because that pattern creates a very large Target area that can have tremendous effects on the silver market because it would be driven much closer to its all-time high which is $50.... so if silver goes several points higher there's a good chance it can attract more buyers to drive silver closer to its all time high..... in effect this changes the silver market which is lagging compared to the gold market.

Gold4 10 25 this is a relatively short video 15 minutes maybe a little bit more looking at the dollar and looking at Gold. I think gold is getting ready to go higher and it's because of a pattern that developed last night. the way the bars are moving and expanding is triggering a belief for me that the market is going higher. there are reasons why it might go lower since it's in a Range box. the dollars going lower the Gold's going higher you have 1 or 2 bars that make incredible swings and those swings are bi-directional in that one goes up by a lot and then the next bar goes down by a lot..... this is because it's an expanding Market that makes money for buyers and sellers and expanding markets can be very stressful because they make big changes and then on the next bar you get a big change in the other direction.... so you have to think a little bit differently and count on what you think where both sides of the market.... the buyers and the seller and know where they are. if there's 1 point that I think is very important and that is that the 2 bar reversal when the market was at support is really where you would take the best trade based on the way I look for opportunity in a market and it's important to look at where that is and what it looks like because it makes a total difference and how your experience with your entries will change for the better.

gold trend direction .. Follow upGold 92870 - Has given a inside bar pattern ( bearish ) and signals are diverged suggests drop to 87300
goodreturns.in wrote :
Market Outlook for Gold Prices in India According to a recent report by FXStreet, "Gold prices may witness a short-term pause as bulls take a breather following an extended rally. The report notes that while the fundamental outlook remains bullish, the metal appears slightly overbought on the daily chart." "From a technical standpoint, the Relative Strength Index (RSI) is currently hovering just above the 70 level, indicating overstretched market conditions. As a result, analysts suggest that it would be wise for traders to wait for some near-term consolidation or a modest price correction before entering new long positions."

Gold correction to set-up the stage for a multi-year run?I think one should monitor Gold closely as it may be setting up for a multi year run.
I provide levels to watch.

GC1!: Buy ideaGold is in an oversold zone, as indicated by our RSI indicator. Therefore, we should expect a rise.

Gold Trade Review – Potential Pop, Drop, then ATH's SetupWe are currently watching a potential pop and drop and potential ATH scenario developing in gold. Price is holding above a key daily level at $3,021.4 , which will serve as the critical pivot area. A sustained move below this level will likely trigger continuation toward the next significant daily level at $2,968.5 for T1, and potentially further into the weekly/daily support zone at $2,953.2 , with an extended target at the daily level of $2,929.0.
I would expect that zone to provide support, though there is an untested area lower near the recent lows at $2,893.6. Ideally, I do not want to see price move much beyond our first weekly/daily support zone mentioned above but would lean on the lower level as a last ditch effort to hold the structure.
From the current price structure, based on Fridays close there's also potential for a move higher into (#1) $3,058 , which is an untested daily level (approached from below). If this level acts as firm resistance, it could trigger the anticipated drop into the zones outlined above. Keeping an eye on being above or below $3,021.4 will be critical for progression in either direction.

Short trade
📉 Trade Breakdown – Sell-Side (CG1! Futures)
📅 Date: Thursday, April 10, 2025
⏰ Time: 11:45 AM (New York Time)
🕒 Session: London to NY Overlap – Late NY AM
📉 Pair/Instrument: CG1!
📈 Trade Direction: Short (Sell)
Trade Parameters:
Entry: 3179.7
Take Profit (TP): 3149.7 (–0.94%)
Stop Loss (SL): 3186.0 (+0.20%)
Risk-Reward Ratio (RR): 4.76
Reason: Observing exhaustion in a rally before NY closes liquidity window with a price sweep into high (supply zone) signalling a reversal.

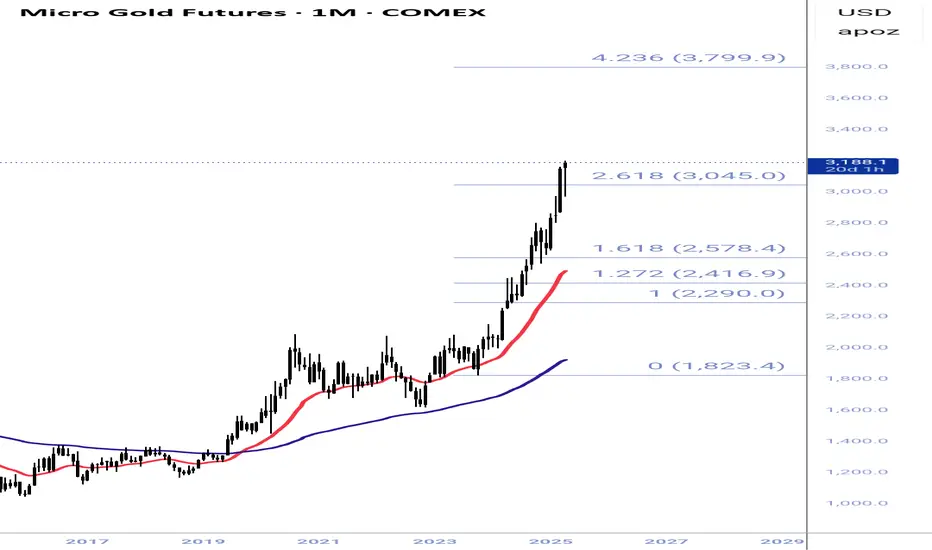
Gold - The Blow Off TopAs gold hit a high today I took a look at the chart. Incredible run going back many years. But what goes up must come down. Based on a Fib-extension we can see where price has hit resistance and turned it into support. It happened at 1, 1.272, 1.618, and briefly at 2.618. It has remarkably pushed through that. So in my studies of markets and fibonacci I've found that 4.236 often times bring about the top on a parabolic move. So by following that logic I would put the top, at least a local one, at $3,800. Roughly 25% from here. Anyways, that's my 2 cents on Gold. Happy trading.
Weekly Market Analysis - 9th April 2025Here we are with another market analysis. This time, a bit late in the week on a Wednesday, but it is what it is! We have CPI today and PPI tomorrow, so this should be an interesting week. Overall, gut instinct tells me we would be pushing lower for the DXY, but again, i'm not betting anything on it. I trade the candles, I trade the structure, I don't trade guesses.
I hope you find the video analysis useful. Take care this week!
- R2F Trading

Gold vs Inverted Dollar IndexThis is what I was talking about... note that the dollar index is inverted (upside down).
For the past week, most of the move in gold is due to the movement in the dollar index because we're looking at gold futures in dollars.
Dollar tanks, then gold futures goes up in dollars. It may just stay flat in terms of Euros or francs.
So basically I got lucky shorting it last week, lol. The dollar bounced.

Likely bottom values-SUB 30 SILVER at 100 GSR-BACK THE TRUCKStocks are pulling the entire market, every sector, down, as it approaches a final 4 year cycle low. Here are the criteria most probable to be met in anticipating a bottom

GC Swing Short Trade idea based on supply and demand, intermarket analysis and cross market valuation. Following a structured approach with clear entry, risk management, and confluence factors.

We might get a play on Gold soon! Been waiting for price to come for these levels for almost a month now. Now that we are finally here I'm just trying to keep my cool and wait for things to line up inside of the killzone. We could get a nice bullish swing here. We just have to wait for price to show us thats what it wants to do.

Inverse Head And ShouldersGold has a clear IH&S(Inverse Head & Shoulders. It shows gold will move upwards all the way to 3200.

Can Gold Continue Higher? Last month, I pointed out that Large Speculators started to close out their net-long positions in Gold futures, betting on the possibility of a reversal as they attempted to time the market turn at all-time highs. This behavior continued for several weeks, yet Gold’s price continued its upward rally, leaving many traders scratching their heads. What’s particularly puzzling is the lack of chasing in this rally, especially considering the massive price movement since then. This is particularly surprising because Large Speculators, for the most part, are trend-followers — and right now, the trend in Gold is unmistakably bullish.
When comparing positioning in Gold to Silver, there’s a distinct difference. While Large Speculators initially followed the rally in Silver, continuing to buy as Silver lagged behind Gold, this strategy was much more reactive. Silver’s underperformance relative to Gold made sense, given that Silver is more crowded than Gold — meaning there’s less demand and fewer buyers.
The key takeaway from this analysis is that the Commitment of Traders (COT) report can offer valuable insights into which market presents the better risk/reward trade. In this case, the COT report highlighted Gold as the superior trend to follow, especially for traders looking to capitalize on precious metals amidst all the tariff news and rising market uncertainty. By using the COT, traders can refine their strategies to focus on trends with more significant potential, rather than getting distracted by more volatile, crowded trades.

We now have a direction for GOLDSeems the entire market was waiting on Trump to do his thing. Now that we have that news out the way on Tarrifs the market is much more likely to give up a direction. Grounds for much safter plays.
