Gold trend directionGold 92480 is showing signs of increasing volume. We expect Gold will drop to 90575 to complete the accumulation and move higher.
GDU1! trade ideas

Gold Futures Wyckoff Re-accumulation and Lunar Day SynergyWe’re observing a textbook Wyckoff Reaccumulation unfolding on Gold Futures (4H), with somewhat clean volume behavior and alignment with recent lunar cycle activity — pointing toward a potential Wyckoff Phase D launch.
Wyckoff Breakdown:
1. Buying Climax established the range.
2. Automatic Reaction and Secondary Test defined support and resistance.
3. A Shakeout/Spring briefly broke support, absorbed supply, and reversed.
4. Spring Test held structure (though not on noticeably lower volume).
5. A clear Jump Over the Creek followed — strong demand emerging.
6. LPS (Last Point of Support) formed during a choppy pullback on Lunar Days 12–13, staying above demand and within structure.
We’re now in a pivotal moment — price is poised for continuation if buyers defend the LPS zone.
🌙 Lunar Days 12–13 (May 7–10)
-Typically a time of building energy + internal tension.
-Retests of breakout zones.
-Erratic, tricky pullbacks that challenge emotional conviction.
-The illusion of market weakness despite underlying strength.
📌 Gold pulled back during these days, testing the jump zone with indecision — but structure held. The LPS formed under cosmic pressure, showing resilience.
🌕 Lunar Day 15 – Full Moon (May 11–12)
-The culmination point — emotionally and energetically.
-Expect large candles, climax volume, or even fakeouts.
-Common reversal signals: parabolic spikes, gap reverals, wicks.
-Ends a trend — or confirms a Wyckoff phase transition.
📌 In our context, the Full Moon lines up with price stabilizing above LPS. Supply appears to be drying up. We could now be entering Phase E, or an aggressive Phase D continuation with a possible markup leg.
🌓 Lunar Day 16 – Integration & Clarity (May 12–13)
A time for reflection, balance, and trend confirmation.
If Day 15 broke upward on strong volume, today might:
-Consolidate healthily
-Retest support (LPS)
-Hold gains for next leg up
If no follow-through on Day 15:
-Expect a calmer retest — offering a second chance for buyers to step in without emotional overreaction.
💡 Key Levels to Watch:
LPS support zone — needs to hold for bullish continuation.
Volume confirmation — essential for validating Phase D → E transition.
Reaction to Full Moon volatility — will reveal true intent.

Gold's Correction May Not be Over Yet - Here's WhyHere is my 2-minute technical take on why gold could be looking at a break below 3200 as part of a deeper correction, before it even considers resuming its almighty bullish rally.
Matt Simpson, Market Analyst at City Index and Forex.com

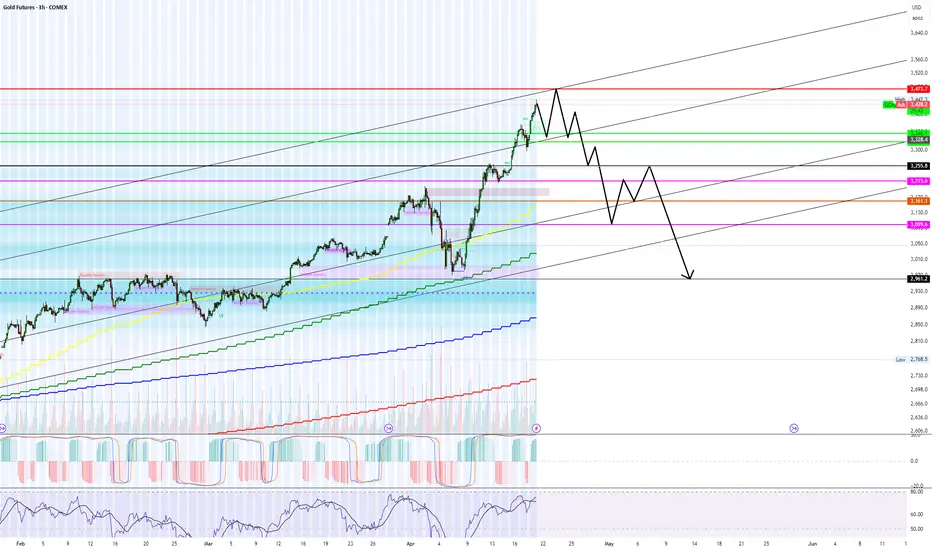
Agree to disagree... Gold is topping right now.My price path seen above is a complete guess but it stems from long term trend lines and more importantly order flow from last week.
On Thursday there was a #1 trade on AMEX:PHYS for $200+ Million at the green levels in my chart above (Equivalent levels). PRICE WILL 100% go to my green lines by end of this week 04/25.
We are over shooting the dark pool sale but a lot, however, this is always to trap retail and create fomo/peak fear.
In the correction/recession cycles, gold ALWAYS TOPS LAST before the crash...
Gold Hourly & 4H Analysis UpdateGold CMP 3290
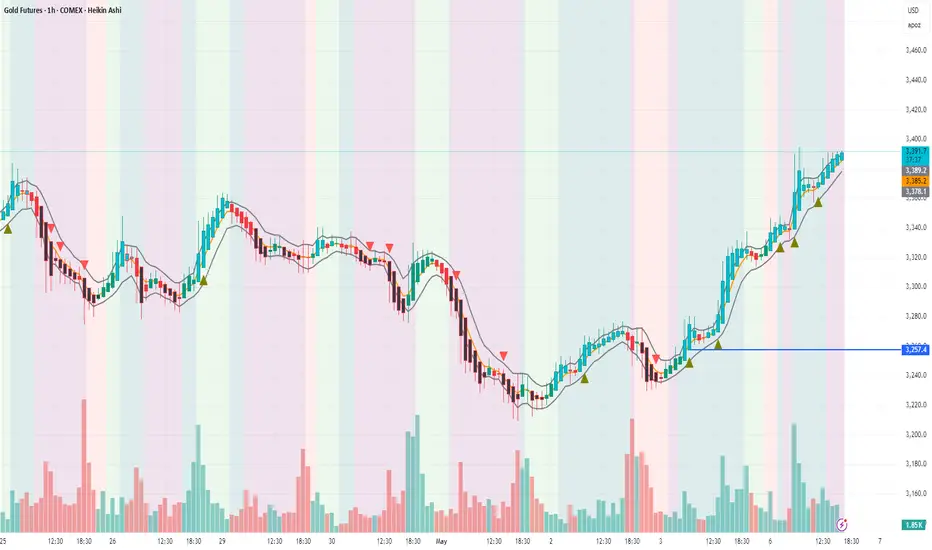
Yesterday on the Hourly chart , Gold gave a Buy Signal at 3257 , and today it rallied up to 3395 — a clear momentum of 138 points . It also gave a fresh breakout on the 4H time frame , indicating strong upward momentum.
Currently, resistance is seen at the 3420 levels .
If Gold breaches 3420 , we could see further upside toward 3450–3465+ levels .
However, failure to breach 3420 may trigger a reversal .
Positional traders can continue to Hold Gold positions with a Stop Loss at 3355 levels
Bearish Price Action for GoldThe risk on trade is putting further downward pressure on gold. Combine that with the bearish technical setup( multiple divergences, triangle pattern break, Trendline pattern break, bearish evening star candlestick pattern) and the charts suggest this move has room to extend to the downside. Conservative pattern targets suggest the PML(previous monthly low) is in play which is 2970. That seems reasonable as it is a conservative target. As I write this gold is testing 3240 which is a PWL(previous weekly low) and it is acting as support. Gold is below its monthly pivot of 3266 so the bears and bulls will probably fight this one out for a day or two and then the picture will get clearer if this move wants to extend or it is simply a correction in a longer term uptrend.

Gold- at the CUSP of making history!!Chart Analysis:
Instrument: Gold Futures (1-hour timeframe)
Key Patterns Identified:
Flag & Pole Pattern: A sharp upward move (pole) followed by a consolidation (flag) indicating potential continuation.
Rounding Bottom: A gradual rounding formation indicating accumulation and potential upward movement.
Sloping Trendline Resistance: Marked as a diagonal dashed line indicating an area where price might face resistance.
Key Levels:
97,579: A horizontal resistance level that is crucial for breaking upward.
99,999: A major resistance level, with a note that closing above it could push prices to 106,000.
Gap Zone: Indicated with a query if it will be filled, implying a possible pullback before a further move.
RSI (Relative Strength Index):
Current RSI is around 53, indicating a neutral momentum.
The RSI-based moving average is around 47.43, suggesting that the price might still consolidate before a directional move.
Summary:
The chart suggests a potential bullish continuation if Gold Futures close above the 99,999 mark.
The presence of a rounding bottom supports a bullish bias, but the gap highlighted raises caution about a potential retracement.
Traders might watch for a breakout above the sloping trendline or a gap fill before positioning.


Retrace Complete...but we need 1 more Sweep on Gold!This pullback is what I waited for and it took all week for it to happen. Not sure if I will get the bullish move today being that it is Friday. But if they hit the level I'm looking for I will try at least once. Keeping expectations low since its the end of the week. but things are shaping out for us to have a STRONG bullish week next week.

Gold Should complete the Retrace before giving another DirectionWas expecting the pullback. Now I just need to wait for it to finish before trying to buy it. Price should give us a solid confirmation when its finally ready. want to see them take out some lower levels first. If price gives up a entry during Asia session we could see a nice short.

Gold Future AnalysisFriday & Monday Gold Has Created a Response Supply & Demand, Where the Market Broken Supply With Good Volume Where We Can See a Good Buyers or Bulls Stepped In & expected the market to test 98940 in couple of weeks

AUDUSD and Gold both in a wedge getting ready to break outCOMEX:GC1! FX:AUDUSD
AUDUSD Looks bearish, so far, heading into a tight wedge within a larger bear flag. AUD being commodity currency I am looking at gold as well which too seems to be in bullish descending triangle.But these descending triangle could also break down strongly. There is a potential strong move coming in AUDUSD and high probability it would be to upside
But Its still wait and watch for now

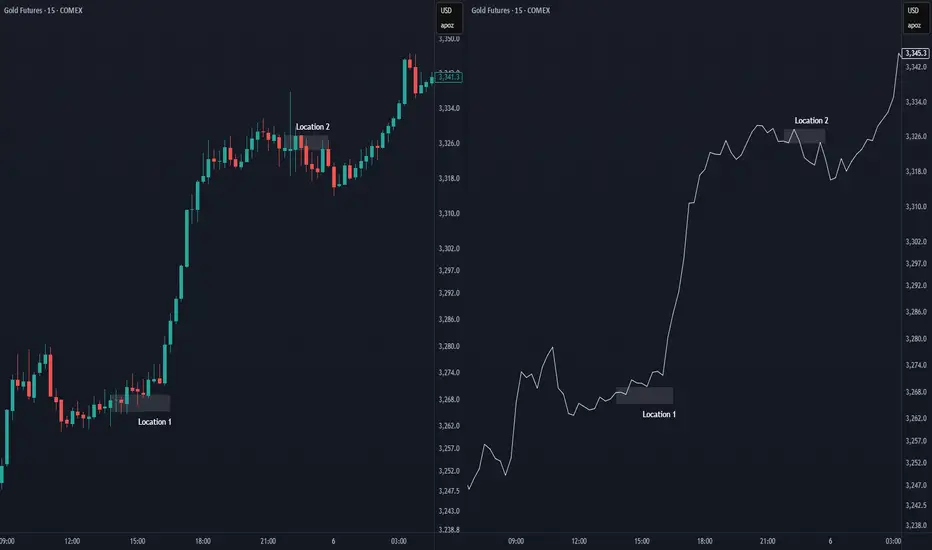
Location 15m London & NY Session 6 May 2025There are 4 setups based on a 15 minute structure on 6th May 2025.
Location 1 :
- Trend buy
- Structure breakout buy
Location 2 :
- Trend buy
- Structure breakout buy
Location 3 :
- Trend buy
- Structure breakout buy
Location 4 :
- Trend buy
- Structure breakout buy

Location 30m London & NY Session 6 May 2025There are 2 setups based on a 30 minute structure on 6th May 2025.
Location 1 :
- Trend buy
- Structure breakout buy
Location 2 :
- Trend buy
- Structure breakout buy

Location 15m London & NY Session 5 May 2025There are 2 setups based on 15 minute structure on 5th May 2025.
Location 1 :
- Trend buy
- Structure breakout buy
Location 2 :
- Structure breakout sell
GOLD📈 Final Trade Plan – GOLD
Component Value
Trade Direction BUY
Entry Price 91692
Stop Loss (SL) 86710
Risk ₹4982
Target Price 104340
Reward ₹12648
Risk-Reward Ratio 2.5
Last High 99358
Last Low 86710
✅ Trade Strengths
✅ All timeframes are UP—clear trend alignment.
✅ ITF entry zone is precise and aligned with MTF, giving high-probability entry.
✅ MTF and HTF zones have stacked and tested structures, offering base support.
✅ Last high (99358) is within reach before hitting full target (104340).
⚠️ Watch Outs
🔻 Wider SL (₹4982) – ensure position sizing is adjusted to accommodate capital management.
⚠️ R:R is moderate (2.5)—acceptable but not high-conviction. Consider scaling out:
1st Target: 99358 (last high)
2nd Target: 104340 (projected)
🧭 Trade Strategy Suggestions
🎯 Consider a partial entry at 91692 and full commitment if price retests 90890 zone (ITF distal).
📉 Use trailing stop once 99358 is breached—protect profits while aiming higher.
📊 Watch for intraday volume spikes or bullish engulfing candles around 91000–91700 zone for confirmation.
🟡 GOLD – Multi-Timeframe Demand Zone Analysis
🔷 Higher Timeframe (HTF)
Timeframe Trend Demand Logic Proximal Distal Avg Zone
Yearly UP Rally–Rally 79775 76563 78169
Half-Yearly UP BUFL 79775 67400 73588
Quarterly UP BUFL 1742* 73300 37521*
HTF Avg 53764 72421 63093
🧠 Note: The Qtrly Proximal (1742) seems like a typo (possibly from copy-paste). If intended as 81742, it aligns better with trend context. Assuming that, adjusted HTF avg would be 80540 approx.
📌 Insight: HTF is bullish with demand structure tightening upward. Price is now well above these zones, indicating continued momentum from previously respected demand.
🔷 Medium Timeframe (MTF)
Timeframe Trend Demand Logic Proximal Distal Avg Zone
Monthly UP BUFL 86592 81639 84116
Weekly UP BUFL 91423 87172 89298
Daily UP Support (DMIP) 88444 86710 87577
MTF Avg 88820 85174 86997
📌 Insight: Structure still shows strength, with 88444–91423 forming a strong cluster of MTF support. Entry at 91692 is right at the top end of support, so confirmation matters here.
🔷 Intraday Timeframe (ITF)
Timeframe Trend Demand Logic Proximal Distal Avg Zone
240M UP BUFL 91692 90890 91291
180M UP BUFL 91692 90890 91291
60M UP BUFL 91692 90890 91291
ITF Avg 91692 90890 91291
📌 Insight: The exact match across all ITFs shows very tight and fresh demand, providing strong conviction at this zone—perfect sniper level.

GOLD sellers pushes to $3000
Logic behind this idea;
1. Structural break of last support
2. Five legged down of wave 'A' in wave signifies further five wave down for wave 'C'
3. Weekly candle losses its 50% support
4. Weekly price not able to break previous peak and subsequently closed below MSS
5. All these criteria will get valid if the price fell below $3180 next week

Current long position GoldHolding position on gold expecting price to continue to the uptrend have stop loss below those blocks

Gold holds long term bull run - for now Gold rebounded sharply after several days of trending down when it hit the long term bull run support (bottom line on chart).
Next stop major resistance around 3,260 which is fast approaching.
We expect high probability rejection down from this level due to the move into higher risk assets with a calming of the macro economic environment…but as always, with Gold anything can happen!
Look for confirmation then this top trend line forms a solid resistance with the long term bull trend line providing support. Current bull run pattern running out of space to run.
Good luck everyone!

GOLD MINI PRICE CHARTgold mini forming H&S at an important area, taking support at SR flip zone, looks like break below SR flip zone headed for big correction in gold
