HSI1! trade ideas


Hang Seng UpdateFUtures red because CHina dumped but it looks like they're going to bounce next week.
Don't expect China to drop the market any further, in fact, they're usually good at pumping when their market goes up.

26K LikelyDistribution will likely take place around 25500 and 25850 before a possible trap move towards 26k or even 26500.


May be. May be not.A real difficult one.
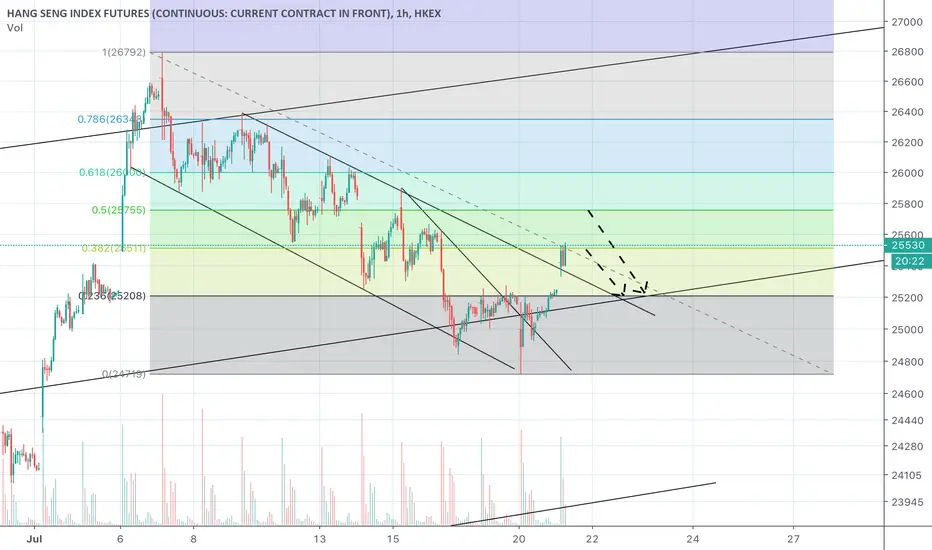
Sold off perfectly after taking out the stops above 25188 as anticipated but 2 things don't sit well with me for a short case. First is volume. A bit too high. Daily close well off its lows as well. Second is SPX just filling its gap. Everyone would be jumping on sell wagon. If only markets were that easy to trade.
But my instincts could be totally off and it might just tank down from here.
Picture will be clearer after Tomorrow.
You decide.


No Gap requires cautionIt was all set up so perfectly. The fact that it didn't happen has increased the odds for a pullback.
Momentum is still with the sellers so one or both of the recent swing lows may be taken out and then the pullback.
Will update again in few sessions if i see something developing.
Regards

Monday to Gap down?Will we see an opening gap on Monday to the downside?
It's all setup really nicely. If it does, i don't expect it to get filled anytime soon. Move down should accelerate from there onward.
ATM, i see very little bullish case to support the idea of Gap or the parallel channel acting as a support for another rally.
Resistance now at 24750-850.

HSI - to bounce or to break?The Hang Seng Index had a boosting rally a couple of weeks ago, but lost its hold at the top of the channel and had been working its way down slowly since. Unlike the STI, the HSI appears relatively stronger given the environment and situations it has been in, particularly over the past year and a half.
It is a t the lower end of the channel, and candlesticks indicate a slight push down to test the support, followed by a bounce, and a likely fail about two or three weeks later... the downside fallout could come earlier, but there is little now to trigger it, albeit a surging COVID-19 cases in the territory.
Ominous weeks to follow, watch for bounce or failure.

Post Fed. HSI Super BearishRallied briefly but as anticipated it was short lived and sold off from first resistance. We now have an inside day fake out on dailies and are very close to the key levels 24300-500. Acceleration gap through there will signal the start of mark down. With the amount of distribution, 20k should be minimum but its not just the last 3 months. It has been going on since late 2017(refer to my 23 May post, linked below).
If you are short, hold onto this one. It can be very big.


Monday's opening will have a lot to say
Gap through 24500 and there will be no looking back. No Gap may provide great opportunity to go short around 26k.

$HSI - Hang Seng Futures Very Bearish$AAPL $SPY $QQQ $NQ_F -- $HSI_F The hang seng futures daily chart is still extremely bearish. It recently restested the neckline of a previously broken down H&S and rejected hard. As you can see from the chart its also in a clear bear flag that is likely to break down very soon

HSII don’t think it’s a breakout for HSI, rather a stimulus from the HK Nasdaq. My opinion is that HSI would fall back to 25185, and then there should be some big movements around that level.
Coming Down NicelyAfter the Buying Climax on 7th of July, brief distribution was carried out between 25950-26250.
Today saw a gap down and a selloff to first of the 4 unfilled gaps below which is acting as a support for time being.
Key resistance above now is 25850-950.
Move down so far appears to be in a channel formation.
Major chunk of distribution took place between 24500-300 since the low in March. Gap through that will signal the start of a markdown and accelerated move towards 20k and below.
Regards


Buying Climax and a Top?
Zigzagged with huge volume(see above) at the open, took out the stops above the very important level marked in Yesterday's post and has since been on the decline. We will know for sure in next few sessions but there is a good chance that Today marks the start of a significant decline which will take HSI to 20k and below if my analysis of distribution near the 24k level are correct.
First significant support is the gap at 25250-500. It can get real ugly in no time so trade carefully.

